Working Capital Landing: A Comparative Study
About The Extent Of Impact Of Working Capital In
The Context Of ‗Air India‘ & ‗Indigo‘ Airlines
Sayyad Saadiq Ali, K. Hema Divya
Abstract: In current situations management of transportation business in a successful manner via airlines is a very challenging task due to the reason of newly emerging services in airline business to fulfil the dream of common man to fly in the sky at all. Most of the airline companies are coming with price cutting strategies to capture the market share. All these measures direct towards spending more investment in creative products and services. Working capital plays a highly predominant role in these contexts of spending, retaining and capturing the market. In this study an analysis of changes in working capital in Air India and IndiGo airlines has been carried-out to know the extent of influence of working capital on the liquidity status of Air India. From the results of analysis, it has found that the standard deviation in case of all components in Air India is higher than in case of IndiGo airlines. The coefficient of variation of current assets and current liabilities is higher in case of IndiGo airline. The coefficient of variation of total working capital in case of Air India airline is negative. From the ratio analysis, it has found that all the liquidity ratios are far behind than ideal parameters in case of Air India than in IndiGo airlines.
Keywords: current assets, current liabilities, liquidity ratios, quick ratio and absolute liquid ratio.
I. INTRODUCTION
A. History & status of Air India [1]
Air India was started as ‗Tata Air Services‘ and renamed as ‗Tata Airlines‘ by J.R.D.Tata in the year 1932. In the first year of business operations, Tata Airlines had made a net profit of Rs.60,000/-. After World War II, routine commercial services were restored in India and
Some important phases of Air India since last decade The company has sold three ‗Air India Airbus A310-300 flights‘ in March 2009 due to overcome the obligation of debts. After a long time (six years) Air India declared its first positive EBITDA (earnings before interest, tax, depreciation and amortization) by following strategy of selling and leasing back of its newly acquired Boeing 787 Dream liners. The airline was invited to be a part of the Star Alliance in 2007.The combined losses for Air India and Indian Airlines in 2006–07 were ₹7.7 billion (US$110 million) and after the merger, it went up to ₹72 billion (US$1.0 billion) by March 2009.
Revised Manuscript Received on April 07, 2019.
Sayyad Saadiq Ali, Research Scholar, Department Of Commerce & Management, Koneru Lakshmaiah Education Foundation, Green Fields, Vaddeswaram, Guntur District, Andhra Pradesh, Pin- 522502.
Dr. K.Hema Divya, Associate Professor, Department Of Commerce & Management, Koneru Lakshmaiah Education Foundation, Green Fields, Vaddeswaram,, Guntur District, Andhra Pradesh, Pin- 522502.
The company sold three Airbus A300 and one Boeing 747-300M in March 2009 for $18.75 million to clear the debt. By March 2011, Air India had accumulated a debt of ₹426 billion (US$5.9 billion) and an operating loss of ₹220 billion (US$3.1 billion), and was seeking ₹429 billion (US$6.0 billion) from the government.
Air India became the 27th member of Star Alliance on 11 July 2014. In August 2015, it signed an agreement with Citibank and State Bank of India to raise $300 million in external commercial borrowing to meet working capital requirements. As of May 2017, Air India is the third largest carrier in India (after IndiGo and Jet Airways), with a market share of 13%.
Privatisation in pipe line
On 28 June 2017, the Government of India announced the privatisation of Air India. A committee has been set up to start the process.
B. History & Status of ‘IndiGo’ airlines [2]
IndiGo airline was founded in 2005 and business operations have been commenced from 4 August, 2006. Its parent company is Interglobe Aviation Limited, headquartered at Gurgaon. Rakesh Agarwal and Rahul Bhatia were the co-founders of Indi Go airlines.
Some landmarks of IndiGo airlines
IndiGo is a most economic airline in Indian context of airline business. It is the largest airline in India by passengers‘ carried and fleet size, with a 41.3% domestic market share as of June 2018. It is credited as one of the largest cost sensitive airlines company in Asian continent and placed as 7th largest airlines company by carried 46 million in the year 2017. The airline is operating its services to 57 destinations both locally and internationally. Within a short period of its establishment, IndiGo Airlines Company has delivered its 50th aircraft in the year 2012. For the first quarter of 2012, IndiGo was the most profitable company of Indian sky market interms of volume of passengers. In the 3rd quarter of 2012 again IndiGo was crowned as the largest airline company in Indian market. In the month of January, 2013, after Indonesian airlines company ‗Lion Air‘ IndiGo was placed as the next fastest growing company in Asian airlines business context. By following the regulation of the civil aviation ministry of India in the context of number of aircrafts delivery was limited to only below 5, IndiGo has planned to go with
regional flights by setting up of a subsidiary in the market. In August 2015, IndiGo placed an order of 250 Airbus A320neo aircraft worth $27 billion, making it the largest single order ever in Airbus history. IndiGo announced a ₹32 billion (US$450 million) initial public offering on 19 October 2015 which opened on 27 October 2015.
C. Introduction about Working Capital
Definitions of Working Capital
According to Weston & Brigham - ―Working capital refers to a firm‘s investment in short-term assets, such as cash amounts, receivables, inventories etc.[3]
Working capital means current assets. —Mead, Baker and Malott [3]
―The sum of the current assets is the working capital of the business‖ —J.S.Mill [3]
The capital which is used in day to day operations of the business is termed as working capital. This capital is also called as fluctuating capital. The relationship between fixed capital and working capital is generally positive and the extent of working capital is correlated with so many internal and external aspects of the business. They are size of the firm, technology of the business, production cycle, market coverage, production policy, credit policy, receivables management policy, currency market fluctuations, skilled labour etc.
Generally an organization can face three phases of working capital status. They are optimum level, deficiency and excessive working capital. It is always a crucial task in front of a financial manager of a business to predict the extent of volume of working capital required based on ever changing internal and external situations. So, for facing these risky financial markets it is better to adopt the strategy of maintaining little excessive than positive working capital is suggestible.
Objective of the study:
To study about the extent of impact of changes in working capital on financial health of ‗Air India‘ by comparing with the ‗Indi Go‘.
Period of the study: 2011-12 to 2016-17 (Six years)
Statistical measures: Mean, Standard deviation and Co
efficient of variation.
Abbreviations - INV – inventories, TR – trade receivables, STLA – short-term loans & advances, STLA – short-term loans & advances, OCA – other current assets, TCA – total current assets. TP – trade payables, STB – short-term borrowings, STP – short-term provisions, OCL – other current liabilities, TCL – total current liabilities, WC – working capital, NWC – net working capital, INC – increase, DEC – decrease, CV – coefficient of variation, STD DEV – standard deviation. CR – current ratio, QR – quick ratio, ALR – absolute liquid ratio.
II. REVIEW OF THE LITERATURE
Farrah Wahieda Kasiran, Noredi Azhar Mohamad and Othman Chin in their article of working capital management efficiency, have divided the entire management of working capital into three aspects. They are performance management, utilization of working capital and efficiency of working capital. From their analysis, they have stated that the effective management of working capital results superior performance of the firm. The utilization of current assets results timely fulfilling the obligation of current dues. They have highlighted the role of the government to facilitate environment to firms to grab the opportunities and focussing on avoiding crisis of short-term obligations. [4]
Gamze Vural, Ahmet Gokhan, Sokmen Emin and Huseyin Çetenak in their investigation have found that firms can increase their profits by effective management of receivables and by cutting the length of the working capital cycle. From their investigation they have demonstrated that increasing the leverage results decline in profits. They have also found that there is proportionality exists between value of the firm and minimising the cash conversion cycle. [5] Jakpar S, Tinggi M, Siang TK, Johari A, Myint KT and Sadique MS in their research have found that there is a perfect positive relationship exist between exogenous variables like firm size, longer aggregate collection period and long stock conversion period with endogenous variable of the firm, i.e., profitability. They have found a new dimension concept that as longer as debt collection period, profitability will be improved. They have also illustrated that profitability of a firm is negatively related to its debt ratio. [6]
James S. Sagner has stated that mergers & acquisitions will create scope for effective utilization of sick assets of both firms either they are going for merging strategy or acquirer firm if they have selected acquisition strategy. From the analysis of last three decades he concluded that most of the intensions of mergers & acquisitions have turned out in to mare dreams due to the reason of deviations like marketing strategies, production processes, technologies, financial prospects between the parties participating in the strategy of mergers and acquisitions. [7]
Monika Wieczorek-Kosmala, Anna Dos, Joanna Błach and Maria Gorczynska in their study have found that larger the firm‘s
operations directs high level of working capital management results minimise the liquidity risk. The operating cash of a firm also derived from the level of liquidity reserves to be maintained by the firm to minimize the risk. A firm‘s management of liquidity reserves varies with the importance, magnitude and time coincidence of their requirement. From their analysis, they have found that there is a positive correlation exists between financial consistency and amount of liquidity reserves of the firm.[8]
Paul Muoki Nzioki, Stephen Kirwa Kimeli, Marcella Riwo Abudho and Janiffer Mwende Nthiwa in their presentation have stated that by reducing cash conversion cycle, minimising debt collection period and lengthening the payment periods liquidity
framing policies in such a way to shorten the cash conversion cycle and hence improve gross operating profit. By delay payments firm has the scope of reinvestment in short-term avenues for resulting more returns. [9]
Shikha Bhatia and Aman Srivastavain their research have narrated that financial performance of a firm and their cash conversion cycles are negatively correlated in Indian context. In their study they have explained that by shortening the stock conversion period in to final products and by expanding relaxation period for the customers, a positive sign will be generated about the firm and hence directed towards improvement of financial performance would be possible. [10]
Stephen M. Payne has suggested 10 tips to avoid working capital blunders for smooth functioning of operating activities of the firm. They are - the firm needs to believe in the capability of financial manager solely in fixing the working capital problems, short span efforts like delay payments to creditors up to the level of extent and forwarding for collection activities, the firm needs to take actions like incentive atmosphere to the top level executives after collection of total sales, but not like lower level employees. Waiting for business recovery is most important for a firm before improving the working capital process, believing in ERP (Enterprise Resource Planning) is the key success factor for working capital management, connecting the customers and suppliers across the firm policies, appropriate level of inventory is to be maintained by the firm, new approaches to be adopted by the firm to collect receivables before treating them as bad debts. Adopting the strategy of to-stock for fulfilling the needs of make-to-demand and make-to-order will generate new working capital for the firm. [11]
Steven M. Fazzari and Bruce C. Petersen in their article have stated that there is a sensitive relationship exists between internal financing and profitability outcomes. They have described that if firms are having higher liquidity then they can have a greater chance of controlling fixed investment relative requirement differentiations. [12]
III. ANALYSIS AND INTERPRETATION
A. Analysis of working capital in ‘Air India’ airlines
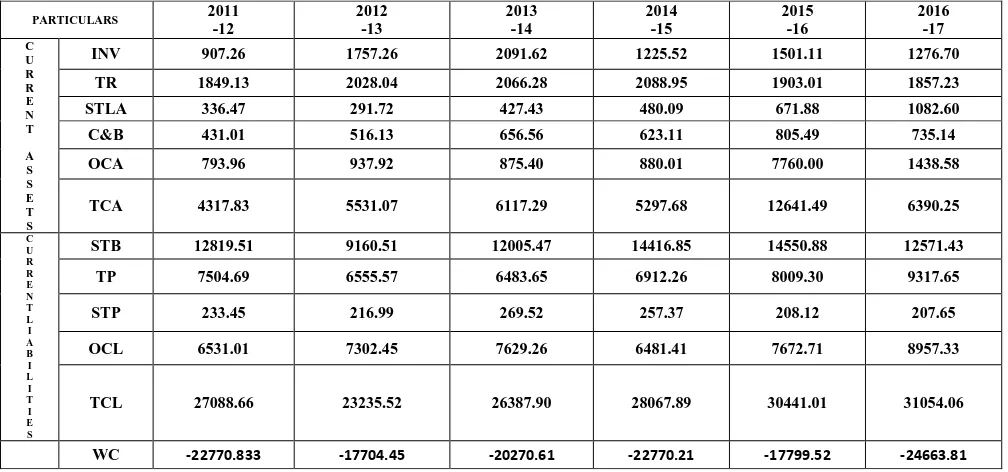
Table 1 represents the schedule of changing patterns of working capital in ‗Air India‘ from 2011-12 to 2016-17.Table 1 is divided into two heads, i.e., current assets and current liabilities. Current assets having the components like inventories, trade receivables, short-term loans & advances, cash & bank balances and other current assets. Current liabilities include short-term borrowings, trade payables, short-term provisions and other current liabilities.
In the year 2011-12, the total current assets were at Rs.43178.30 million, total current liabilities were at Rs.270886.60 million.
In the year 2012-13, the total current assets were increased to Rs.55310.70 million and total current liabilities were decreased to Rs.232355.20 million with net increase of working capital of Rs. 50663.80 million and reached to Rs.-177044.50 million. The reason for this increase in current assets is increase in inventories from Rs.9072.60 million to Rs.17572.60 million, increase in other current assets by Rs.1439.60 million, decrease in short-term borrowings from Rs.128195.10 million to Rs.91605.10 million and decrease in trade payables from Rs.75046.90 million to Rs.65555.70 million.
In the year 2013-14, the total current assets were increased to Rs.61172.90 million, current liabilities were increased to Rs.263879.00 million with net decrease in the working capital of Rs. 25661.60 million. The decrease in working capital is due to the reason of huge increase in short-term borrowings from Rs.91605.10 million to Rs.120054.70 million and increase in other current liabilities from Rs.73024.50 million to Rs.76292.60 million.
In the year 2014-15, the total currents were decreased to Rs.52976.80 million, current liabilities were increased to Rs.280676.90 with a net decrease in working capital to Rs.24996.00 million and reached to Rs.-227702.10 million. The cause for decrease in working capital is due to the huge decrease in inventories from Rs.20916.20 million to Rs.12255.20 million and increase in short-term borrowings from Rs.120054.70 million to Rs.145508.80 million.
In the year 2015-16, the total current assets were increased to Rs.126414.90 million along with increase in current liabilities to Rs.310540.60 million. The net increase in working capital by Rs.49706.90 million and reached to Rs.-177995.20 million. The reason for this increase in working capital is due to huge increase in other current assets to Rs.77600.00 million.
In the year 2016-17, the total current assets were decreased to Rs.63902.50 million with simultaneous increase in total current liabilities to Rs.310540.60 million. Hence net working capital also decreased about Rs.68642.90 million and reached to Rs.-246638.10 million. The reason for this downfall of working capital is decrease in other current assets from Rs.77600.00 million to Rs.14385.80 million, increase in trade payables by Rs.13083.50 million and increase in other current liabilities by Rs.12846.20 million.
Table 1: Schedule of Changes in Working Capital of Air
Source:
Annual reports of ‗Air India‘
From the table 1, it is clear that from the year 2013-14 every year the total current liabilities were gradually increased due to the reason of increasing indebtedness. Though in the year 2015-16, Air India has tried to increase their current assets up to a considerable level but those actions were not enough to compensate their critical situation.
Due to these situations, Air India is not in a situation to compete with its competitors in air traffic by coming with cost cutting strategies to raise their market. It has been observed that, by collection of 6 years of analysis, there is no much difference in working capital position of Air India airlines and reached to even huge negative position.
B. Analysis of working capital in ‘IndiGo’ airlines
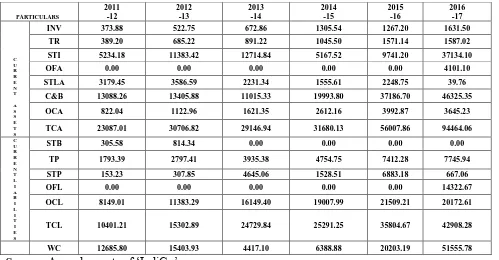
Table 2 represents the schedule of changing patterns of working capital in ‗IndiGo‘ from 2011-12 to 2016-17.Table 2 is divided into two heads, i.e., current assets and current liabilities. Current assets having the components like inventories, trade receivables, short-term investments, other financial assets, short-term loans & advances, cash & bank balances and other current assets. Current liabilities include short-term borrowings, trade payables, short-term provisions, other financial liabilities and other current liabilities.
In the year 2011-12, the total current assets were at Rs.23087.01 million, current liabilities were at Rs.10401.21 million with net working capital at Rs.12685.80 million. In the year 2012-13, the total current assets were increased to Rs.30706.82 million. The reason for this increase is, increase in short-term investments from Rs.5234.18 million to Rs.11383.42 million. Hence net working capital has increased about Rs.2718.13 million and reached to Rs.15403.93 million.
In the year 2013-14, the total current assets were decreased to Rs.29146.94 million, total current liabilities were increased from Rs.15302.89 million to Rs.24729.84 million. Hence net
decrease in working capital is Rs.10986.83 million and reached to Rs.4417.10 million.
The reason for this decrease in net working capital is due to decrease in cash & bank balances from Rs.13405.88 million to Rs.11015.33 million and increase in current liabilities like short-term provisions from Rs.307.85 million to Rs.4645.06 million.
In the year 2014-15, the total current assets were increased to Rs.31680.13 million, current liabilities were increased to Rs.19007.99 million with net increase in working capital about Rs.1971.78 million and reached to Rs.6388.88 million. Due to huge amount of increase in cash and bank balances from Rs.11015.33 million to Rs.19993.80 million and huge decrease in short-term provisions from Rs.4645.06 million to Rs.1528.51 million.
In the year 2015-16, the total current assets were increased to Rs.56007.86 million, the total current liabilities were also increased to Rs.35804.67 million.
Hence the net increase in working capital is Rs.13814.31 million and reached to Rs.20203.19 million. The increase in short-term investments from Rs.5167.52 million to Rs.9741.20 million, increase in cash & bank balances from Rs.19993.80 million.
Table 2: Schedule of changes in Working Capital of IndiGo from 2011-12 to 2016-17 (Rs. in million)
PARTICULARS 2011
-12
2012 -13
2013 -14
2014 -15
2015 -16
2016 -17 C
U R R E N T
A S S E T S
INV 907.26 1757.26 2091.62 1225.52 1501.11 1276.70
TR 1849.13 2028.04 2066.28 2088.95 1903.01 1857.23
STLA 336.47 291.72 427.43 480.09 671.88 1082.60
C&B 431.01 516.13 656.56 623.11 805.49 735.14
OCA 793.96 937.92 875.40 880.01 7760.00 1438.58
TCA 4317.83 5531.07 6117.29 5297.68 12641.49 6390.25
C U R R E N T L I A B I L I T I E S
STB 12819.51 9160.51 12005.47 14416.85 14550.88 12571.43
TP 7504.69 6555.57 6483.65 6912.26 8009.30 9317.65
STP 233.45 216.99 269.52 257.37 208.12 207.65
OCL 6531.01 7302.45 7629.26 6481.41 7672.71 8957.33
TCL 27088.66 23235.52 26387.90 28067.89 30441.01 31054.06
[image:4.595.47.551.54.290.2]
Source:
Annual reports of ‗IndiGo‘
In the year 2016-17, the total current assets were increased incredibly to Rs.94464.06, current liabilities were also increase to Rs.42908.28 million. Hence net increase in working capital is Rs.31352.59 million and finally reached to Rs.51555.78 million. The reason for this huge expansion in working capital is due to increasing short-term investments from Rs.9741.20 million to Rs.37134.10 million, started investment in other financial assets to Rs.4101.10 million and decrease in short-term provisions from Rs.6883.18 million to Rs.667.06 million. From the Table 2, it can be observed that total current assets in IndiGo airline were increased almost four times more than starting year of analysis, total current liabilities also increased almost four times to starting year of analysis. Simultaneously net working capital also increased almost more than four times than starting year of analysis.
C. Comparison of Current Assets, Current Liabilities & Working Capital of Air India and IndiGo Airlines
[image:5.595.41.540.60.320.2] [image:5.595.46.558.544.785.2]From the Table 3, it is clear that the mean value of current assets in Air India is more than in IndiGo due to the reason of huge amount of operations and current assets. The mean value of current liabilities in Air India is almost 11 times to the current liabilities in IndiGo. Hence the mean value of total working capital in Air India is negative with huge amount. The standard deviation of every component of Table 3 in Air India is greater than in IndiGo. The standard deviations of total current liabilities and total working capital in IndiGo are much lesser than in Air India.
Table 3: Statement of Current Assets, Current Liabilities, Working Capital (Rs. in million)
Year
Air India IndiGo
TCA TCL TWC TCA TCL TWC
2011-12 43178.30 270886.60 -227708.30 23087.01 10401.21 12685.80
2012-13 55310.70 232355.20 -177044.50 30706.82 15302.89 15403.93
2013-14 61172.90 263879.00 -202706.10 29146.94 24729.84 4417.10
2014-15 52976.80 280678.90 -227702.10 31680.13 25291.25 6388.88
2015-16 126414.90 304410.10 -177995.20 56007.86 35804.67 20203.19
2016-17 63902.50 310540.60 -246638.10 94464.06 42908.28 51555.78
Mean 67159.35 277125.07 -209965.72 44182.14 25739.69 18442.45
Std
Dev 29914.18 28609.15 28750.18 27118.50 12177.69 17227.67
CV 44.54 10.32 -13.69 61.38 47.31 93.41
Source: Compiled and calculated from annual reports of Air India &
IndiGo airlines From Table 3, it is notified
that coefficient of variation in
PARTICULARS
2011 -12
2012 -13
2013 -14
2014 -15
2015 -16
2016 -17
C U R R E N T A S S E T S
INV 373.88 522.75 672.86 1305.54 1267.20 1631.50
TR 389.20 685.22 891.22 1045.50 1571.14 1587.02
STI 5234.18 11383.42 12714.84 5167.52 9741.20 37134.10
OFA 0.00 0.00 0.00 0.00 0.00 4101.10
STLA 3179.45 3586.59 2231.34 1555.61 2248.75 39.76
C&B 13088.26 13405.88 11015.33 19993.80 37186.70 46325.35
OCA 822.04 1122.96 1621.35 2612.16 3992.87 3645.23
TCA 23087.01 30706.82 29146.94 31680.13 56007.86 94464.06
C U R R E N T L I A B I L I T I E S
STB 305.58 814.34 0.00 0.00 0.00 0.00
TP 1793.39 2797.41 3935.38 4754.75 7412.28 7745.94
STP 153.23 307.85 4645.06 1528.51 6883.18 667.06
OFL 0.00 0.00 0.00 0.00 0.00 14322.67
OCL 8149.01 11383.29 16149.40 19007.99 21509.21 20172.61
TCL 10401.21 15302.89 24729.84 25291.25 35804.67 42908.28
case of total working capital in Air India is negative valued. There is much difference between coefficient of variation of current assets and current liabilities of IndiGo airline by comparing with similar components of Air India Airline Company.
D. Comparison of Financial Performance of Air India and IndiGo through Liquidity Ratios
Financial ratios represent the meaningful relations between different components of financial statements of a firm or multiple firms. Liquidity ratios represent the status of current assets and current liabilities which can be paid or to be collected by the firm with in a financial year.
Current ratio is the ratio of assets convertible in the accounting year to those liabilities which are paid by the firm for its obligations in that year. The ideal current ratio is 2:1. Quick ratio is the ratio of quick assets to current liabilities. Quick assets are the difference of current assets and sum of stock and prepaid expenses. The ideal quick ratio is 1:1.
[image:6.595.42.290.488.648.2]Absolute liquid ratio is the ratio of absolute liquid assets and current liabilities. Absolute liquid assets are the summation of cash, bank balances and short-term investments. The ideal absolute liquid ratio is 0.5:1.
Table 4: Statement of Liquidity Ratios in Air India & IndiGo airlines during 2011-12 to 2016-17
YEAR Air India IndiGo
CR QR ALR CR QR ALR
2011-12 0.16 0.13 0.02 2.22 2.18 1.76
2012-13 0.24 0.16 0.02 2.01 1.97 1.62
2013-14 0.23 0.15 0.02 1.18 1.15 0.96
2014-15 0.19 0.14 0.02 1.25 1.2 0.99
2015-16 0.41 0.37 0.03 1.56 1.53 1.31
2016-17 0.21 0.16 0.02 2.2 2.16 1.95
Source: Compiled and calculated from annual reports of Air India & IndiGo From the Table 4, it is clear that during entire period of
analysis current ratio, quick ratio and absolute liquid ratios are in better position in case of IndiGo airline than Air India. The current ratio of IndiGo airline is almost nearby the ideal ratio in 2011-12, 2012-13 and 2015-17, the quick ratio is better in the years 2013-14 and 2014-15, the absolute liquid ratio is better in the years 2013-14 and 2014-15.
IV. RESULTS & DISCUSSIONS Air India
Rectification needed area Results influenced to Modification of capital
structure
Reduction in overall cost of capital
Minimisation of total operations
To generate effectiveness at every stage of operations Full government support By starting from zero
budget scope of finding relevant amount of profits
Air India by its huge size and high volume of operations, it is in deep threat of uncontrollable obligations. It is in such a big trouble that even Union Government is not in a situation to bring back Air India on track of positive profits. Even in the last quarter of 2018, Air India has declared 20 percent profits expansion since last seven years. But along with these profits, they have declared that these profits are not enough to compensate even interest payments of past dues by the company.
To overcome this indebtedness situation, Air India was offered to merge itself with Star Alliance Group. But Air India wasn‘t benefited by such collaboration. Due to the reason of high amount of current liabilities over current assets, liquid ratios of Air India are far below the ideal mark. To overcome this situation Air India needs to get support from government of India and has to take some indigestible decisions like reducing the work force, sale of fixed assets, redesigning the fleet according to demand, redesigning the capital structure to reduce overall cost of capital, switching-off the traditional strategies which have resulted pains to it. REFERENCES
1. https://en.wikipedia.org/wiki/Air_India 2. https://en.wikipedia.org/wiki/IndiGo
3. Financial Management & International Finance, the Institute of Costs and Works Accounts of India
4. Farrah Wahieda Kasiran, Noredi Azhar Mohamad and Othman Chin, ―Working Capital Management Efficiency: A Study on the Small Medium Enterprise in Malaysia‖, Procedia Economics and Finance, 35, 2015, pp.297 – 303.
5. Gamze Vural, Ahmet Gokhan Sokmen, Emin and Huseyin Çetenak, ―Effects of Working Capital Management on Firm‘s Performance: Evidence from Turkey‖, International Journal of Economics and Financial Issues, Vol. 2, No. 4, 2012; pp.488-495.
6. Jakpar S, Tinggi M, Siang TK, Johari A, Myint KT and Sadique MS, ―Working Capital Management and Profitability: Evidence from Manufacturing Sector in Malaysia‖, Journal of Business & Financial Affairs, 2017; Volume 6, Issue 2.
7. James S. Sagner, ―Why working capital drives M&A today‖, Journal of Corporate Accounting & Finance, 2007; Volume 18, issue 2.
8. Monika Wieczorek-Kosmala, Anna Dos, Joanna Błach and Maria Gorczynska, ―Working capital management and liquidity reserves: The context of risk retention‖,
9. Paul Muoki Nzioki, Stephen Kirwa Kimeli, Marcella Riwo Abudho and Janiffer Mwende Nthiwa, ―Management of working capital and its effect on profitability of manufacturing companies listed on Nairobi securities exchange (NSE), Kenya‖, International Journal of Business and Finance Management Research, 1, 2013, pp.35-42.
AUTHORS PROFILE
10. Shikha Bhatia and Aman Srivastava, ‗Working Capital Management and Firm Performance in Emerging Economies: Evidence from India‘,
Management and Labour Studies, 41(2), 2016, pp.1–17.
11. Stephen M. Payne, ‗Ten working capital blunders to avoid‘, Journal of Corporate Accounting & Finance, 2002; Volume 14, issue 1. 12. Steven M. Fazzari and Bruce C. Petersen, ‗Working Capital and Fixed
Investment: New Evidence on Financing Constraints‘, The Rand Journal of Economics, Vol. 24, No. 3, 1993, pp. 328-342.
13. www.airindia.in 14. www.goindigo.in
Research Scholar, Department of Commerce & Management,, Koneru Lakhmaiah Education Foundation (KLEF), Vaddeswaram, Green Fields, Guntur District, PIN- 522502, Andhra Pradesh,, 1Assistant Associate Professor, 2Department of Commerce & Management, 2Koneru Lakhmaiah Education Foundation (KLEF), 2Green Fields, 2Vaddeswaram, 2Guntur, 2PIN- 522502, 2Andhra Pradesh, 2divya10_mba@kluniversity.in India 2Phone no- +91-9603742715.