International Journal of Innovative Technology and Exploring Engineering (IJITEE) ISSN: 2278-3075, Volume-8 Issue-8 June, 2019
Abstract: Big data is the collection and analysis of a large set of data which holds many intelligence and raw information based on user data, Sensor data, Medical and Enterprise data. Since the volume of the medical data is increasing due to the presence of a vast number of features; the conventional rule mining technique is not competent to handle the data and to perform precise diagnosis. For instance, this paper intends to implement the improved rule mining technique to overcome the above-mentioned limitations. The model comes out with two main contribution stages (i) Using Map Reducing Framework (ii) Classification. Initially, the input medical data is given to map reduce framework. Here, Multi-linear Principle Component Analysis (MPCA) is used for reducing the given bulk data. Then, the reduced data is given to the classification process, where it classifies the disease with high accuracy. For this, this paper uses Support Vector Machine (SVM) classifier. After the completion of implementation, the proposed model compares its performance over other conventional methods like Principle Component Analysis- NN (PCA-NN), Independent Component Analysis- NN (ICA-NN) and MPCA-NN respectively in terms of performance measures like accuracy, specificity and, sensitivity, and the superiority of the proposed model is proven over other methods.
Index Terms: Medical Data, Disease Diagnosis, Feature Extraction, NN Classification, MPCA
I. INTRODUCTION
Nowadays, big data is the most admirable research topic. However, the mining of needed data from a huge volume of data is considered as the major issue. Numbers of researches are in progress to find the solution for this problem [7]. The solutions often vary from some conventional data mining approaches, by which the process of mining should be more effective and improvable. Handling of big data offers an issue to conventional computation daises and hardware as well. A well-modelled algorithm is quite critical in resolving the problems related to big data. Further, bigdata is not only the fact of criterions like volume, velocity as well as a variety of data (stored data), but it also deals with the potential value of the corresponding data, which has been already present with poor coordination and kept in extensively dissimilar formats through industries that not share their data openly. Usually,
Revised Manuscript Received on June 9, 2019.
Dr.Juby Mathew, School of Computer Sciences, Mahatma Gandhi University, Kottayam, Kerala, India
Dr.R Vijayakumar, Professor, School of Computer Sciences, Mahatma Gandhi University, Kottayam, Kerala, India
Ms.Julie John, De Paul Institute of Technology, Angamaly.
the „data stream model‟ is determined as the model where the data moves incessantly at large-speed. Almost all big data is concerned as data streams, by which the respective novel data are produced unceasingly. Data streams have a huge volume of data that could not be saved in internal or external memory [6].
The learning of medical diseases, as well as wounds or injuries, often produce large amounts of data. The developing area of bioinformatics associates the interesting research parts of biology[5]. As well as informatics for the development of diverse approaches and tools for examining biological data. tThree challenges are convoluted in this procedure that is i) gathering clinical and genomic information ii) regaining applicable information from huge data iii) mining novel knowledge from large volume data. As it is known that last decade has reviewed numerous life science research troops that have also produced a large amount of clinical as well as genomic information from „Human Genome Project (HGP)‟ and most of the data are openly accessible via online sources. Normally, the formulation intelligence researchers have resourced with machine learning (ML) approach and also with Data Mining (DM) algorithms for exploiting the biological information. However, the challenges like over-fitting and less efficacy to classification often happen since the biological data are noisier, great dimensional space, the minimum size of samples and certain gene series have a great alteration.
This paper intends to propose a diagnosing model of disease to overcome the issues that present in the field of medical science. The novel diagnosis model initially gives the input data to map-reduce framework, where it reduces the data using MPCA concept. The reduced data is given to the SVM classifier. Moreover, the developed model compares with other methods like PCA, ICA, and proves the efficiency of the proposed model. The rest of the paper is arranged as follows: Section II reviews the literature work; Section III gives the explanation of the proposed diagnosis model. Section IV details the phase of diagnosis model (SVM). Section V gives the results obtained, and Section VI concludes the paper.
II. LITRATUREREVIEW A. Related Works
In 2016, Dewan et al. [1] have developed a novel classifier for multi-class classification of biological data. The major issue reflected in this investigation were overfitting, noisy instances as well as class-imbalance
data. The developed
rule-based classifier has utilized two classification
Principal Component Analysis with SVM for
Disease Diagnosis
model decision tree and k-nearest-neighbor algorithms. Here, decision trees were adopted for introducing classification rule, while k-nearest-neighbor was used for analyzing the miss-classified instances as well as eliminating vagueness among the contradictory rules. The performance of developed classifier was evaluated by comparing it with well-approved conventional machine learning as well as data mining algorithms on genomic data. The investigational outcomes have indicated that the developed classifier was more superior than other methods.
In 2016, Yuanfang Chen et al. [2] have assessed the influence of the network structure under disease dynamics; this was done by analyzing the huge data gathered by mobile devices by Realistic Contact Networks (RCNs). The corresponding mobile devices were carried by certain volunteers. The approach was designed to identify the dynamic structure of RCNs, by outcome of the evaluation. Moreover, they have developed a prediction algorithm, which was by model for disease dynamics. At last, it has proved that the developed algorithm has effectively enhanced the accuracy of predicting disease.
In 2013, Chih-Wen et al. [3] have developed and offered an ICU support system icuARM, which was on the basis of „Associate Rule Mining (ARM)‟, and they have also constructed a publicly open database MIMIC-II (Multi-parameter Intelligent Monitoring in Intensive Care II) which comprises over 40,000 ICU records of more than 30,000 patients. Additionally, icuARM was created with numerous association rules to do real-time data as well as information mining in ICU setting. They have evaluated the relations among patients' situations like demographics, comorbidities, and medications. Along with this, the ICU results including ICU length of stay was also evaluated. Subsequently, this has worked out in the real time scenario.
In 2015, James A.Rodger [4] had offered the Patient Informatics Processing of Software Hybrid Hadoop Hive to orchestrate database model. The corresponding method was taken place by arranging the dispersed servers and by running different tasks parallel, and also by managing all the respective communications and data transmission among different parts in the system. Moreover, they have hired the Apache Hive as the infrastructure of data warehousing that develops on top of Hadoop. Finally, they have developed a Misdiagnosis Minimization model, which was utilized for data analysis. The developed method has highly enhanced the classification of data via survival rate, mortality rate as well as morbidity rates.
B. Review
Table 1 shows the features and challenges regarding the mining of biological big data. This paper intends to recognize the different methods applied to mine the medical data. The recently used superior methods were discussed in literature from which the Decision tree [1] [5], k-Nearest-Neighbor algorithms [1] [4] and Realistic Contact Networks [2] come under supervised learning and Apriori algorithm [3] come under unsupervised learning. Even though they were the better-quality algorithm, it suffers from certain limitations. Those issues are the suffering due to overfitting, complication under non- numeric data, slow computation, etc. For instance, the Apriori algorithm [3] was a former classical algorithm
[image:2.595.307.546.163.441.2]which is very slow, and the database used for the computation must be scanned at each level. However, the entire algorithm above does not extract precise information during the mining of biomedical data. So, it is needed to focus on implementing the finest rule mining approach for extracting the precise information even if the computation time is very fast.
TABLE I. FEATURES AND CHALLENGES OF MINING OF BIOLOGICAL BIG DATA
Authors [Citation ]
Adopted methodology
Features Challenges
Dewan Md [1]
Decision tree and k-Nearest-Neighbor algorithms
Exemplary classificat ion accuracy
Noisy and misclassifi ed variants are optimized
May suffer from over fitting
Difficult to handle non- numeric data
Requires pruning
Yuanfang Chen et al.
[2]
Realistic Contact Networks
Improved predicatio n accuracy Chih-Wen
et al. [3]
Apriori algorithm flexible data mining in real-time
Slow algorithm
Database has to be scanned at every level James
A.Rodger [4]
Nearest-neighbour algorithms
Reduced error
Reduced misclassifi cation
Model cannot be interpreted
Computationally effective
Hang Yanga and Simon Fong [5]
Decision tree Good accuracy
Less use of memory
May suffer from over fitting
Difficult to handle non- numeric data
Requires pruning
[image:2.595.306.547.564.837.2]III. PROPOSEDDISEASEDIAGNOSISMODEL The proposed disease diagnosis model on big medical data is demonstrated in Fig 1. The needed data for diagnosing the disease is given as the input to map reduce framework, where the data gets condensed. For this, MPCA is used to condense the bulk input data. The MPCA model is the extension of PCA dimensionality reduction. The resultant reduced data is given as the input to SVM classifier and results in the classified output as the diagnosed disease[7].
International Journal of Innovative Technology and Exploring Engineering (IJITEE) ISSN: 2278-3075, Volume-8 Issue-8 June, 2019
A. Map-Reduce Framework
This is the first process of the proposed disease diagnosing model, where the given bulk data gets reduced using this map-reduce framework, which is illustrated in Fig 2. Map Reduce framework is developed as the parallel distributed programming model for processing respective large-scale datasets efficiently without losing its quality. The map reduces algorithm comprise two major tasks:
Map task Reduce task
The Map task chooses a troop of information or data and converts it to another troop of data, in such a way that individual elements are smashed into tuples (also called key-value pairs). Similarly, Reduce task proceeds with the output of Map task as the input as well as combines the generated data tuples (key-value pairs) into a minor set of tuples. Here, the reduce task always executed after the completion of map job. The framework includes certain phases:
Input phase
Map
Intermediate Keys Combiner Shuffle and sort Reducer Output phase
Input Phase: This is a record reader that translates each record into an input file and transmits the parsed data to mapper that is in the custom of key-value pairs.
Map: Map is a function that is a user-defined function that takes a sequence of key-value pairs as well as progresses every individual to create either zero or more key-value pairs.
Intermediate Keys: The key-value pairs or tuples that created by the mapper is termed as intermediate keys.
Combiner: The combiner is a kind of local reducer that troops the same data from the map phase into recognizable groups. For this, the combiner uses the intermediate keys from the mapper and uses as the input and smears an user-defined code to combine the values in the least scope of one mapper. This is not as much important in Map Reduce algorithm; this is optional.
Shuffle and Sort: Normally, the Reducer task initiates with this step. It downloads the trooped tuples onto the local machine, in which the reducer runs. The distinct key-value pairs are arranged by key into a higher data list. The equivalent keys are sets, by which their respective values can be easily iterated in the Reducer task.
Reducer: This reducer utilizes the combined key-value paired data as input and then it runs a Reducer function on each. In this phase, the data is accumulated, filtered, and joined in many ways, and it needs a wide spread range of progression. After the completion of extension, it provides either zero or additional key-value pairs to the last step.
Output Phase: In this phase, there is an output formatter, which translates the last key-value pairs from the Reducer function and writes that observation onto a file with the aid of
[image:3.595.315.537.52.220.2]a record writer. This phase outputs the condensed dataData that gives as the input to MPCA.
Fig. 2.
Representation of phases of MapReduce
framework
Fig.2 Representation of phases of MapReduce framework
IV. DIAGNOSISSTRATEGYVIASVMCLASSIFIER In this paper, SVM classifier is aided to classify or diagnose the disease using the resultant reduced data, and moreover, some relevant information can also be gained through this process.
SVM is basically a two-class classifier that can produce a hyperplane for classifying two data segments. As per the statistical theory, the objective of SVM is to identify the optimal (maximize) margin. This is determined by the least distance among the hyperplane and any of the sample points. The data point‟s subset that defines the hyperplane location is called the support vectors. The hyperplane for two-class linearly separable issue in an n-dimensional feature space is given as in Eq. (1).
H
x V Yg0 T(1)
where V denotes the normal vector and g indicates the
distance from hyperplane to origin. H
x Is learned viatraining data set,
xi,yi
;i1,....h , wheren i
x
andyi
1,1
. H
x Classifies the training samples moreprecisely with the following conditions: ifyi1,H
x 1and if yi1,H
x 1 . The point thatmake H
x 1or1 s are called support vector. The perpendicular distance from any point xin the sample space to the hyperplane is defined as in Eq. (2).
| | | | | |
| | V
g Y V y V
g Y V
r n
T n n
T
(2)
The objective of SVM is to identify a hyperplane for maximizing the distance among the hyperplane as well as the training data points that are closest to the hyperplane. The problem is hence changed into the given equivalent convex quadratic problem that is in Eq. (3).
2 , 2| | | |
1 min V
g
V (3)
Input Input Input Input Input
Map Map Map Map Map
K1:o K2:o K1:o K2:o K1:o K3:o K1:o K2:o K1:o K4:o
Group by Key
K1:o,o,o,o,o K2:o,o,o K3:o K4: o
R R R R
Output Input phase
Map phase
Intermediate
key Combiner
Shuffle and sort
Reducer phase
So that y
V xi g
i N Ti 1, 1,2,3...
3
. With the aid of lagrange multipliers, Eq. (5) is defined as in Eq. (4).
y x x a a y y a a a
a i j i j i j
N
j N
i i N
i
a 2 ,
1 max
1 1
1
(4)
so that 1 i i0
N
iaay (5)
whereai,i1,2....N. The original issue or problem is denoted
by i i
N i
iyx
V
1
and i
N i
iy
1
0
. Hence, having the attained
lagrange multipliers, the determination of bothw andg is done. In general, the data might get overlapped, hence making the accurate division of the training data challenging and that could lead to reduced generalization. The classifier outputs the diagnosed disease [10].
V. RESULTSANDDISCUSSIONS A. Simulation setup
The proposed disease diagnosing model was implemented in Java. The disease diagnosis is done Lung cancer, and the
datasets were downloaded from
https://archive.ics.uci.edu/ml/machine-learning-databases /lung-cancer/ (lung cancer dataset). The proposed diagnosing model was compared to some other conventional feature extraction models and classification methods like PCA-NN, ICA-NN, and MPCA-NN, respectively in terms of performance measures like accuracy, specificity, and sensitivity
B. Performance Analysis of Lung Cancer
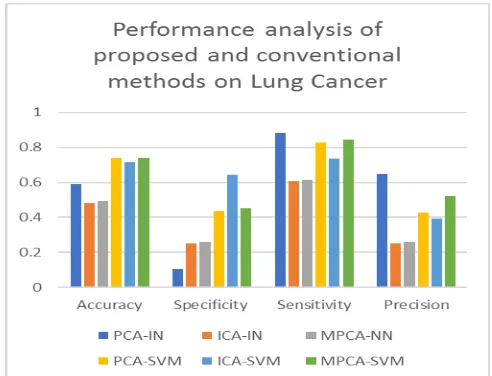
The analysis of the proposed model over other conventional methods on diagnosing lung cancer is shown in Table II. From the table, it is evident that the accuracy of developed approach is 58.89%,48.27%,49.25%,73.96% and
71.64% better than PCA-NN, ICA-NN,
MPCA-NN,PCA-SWM and ICA-SVM, respectively. The specificity of the proposed model is very high than other methods, which are 10.58%,25%,26.08%,43.63% and
64.28% better from PCA-NN, ICA-NN,
MPCA-NN,PCA-SWM and ICA-SVM, respectively. The
sensitivity of proposed model is
88.28%,60.52%,61.36%,82.88% and 73.58% better from PCA-NN,ICA-NN,MPCA-NN,PCA-SWM and ICA-SVM, respectively. The precision of developed diagnosing model is 65%,25%,26.08%,42.85% and 39.13% enhanced than
PCA-NN,ICA-NN,MPCA-NN,PCA-SWM and ICA-SVM,
[image:4.595.47.291.56.267.2]respectively.
TABLE II. PERFORMANCEANALYSISOFPROPOSEDAND CONVENTIONALMETHODSONLUNGCANCER
Measures PCA-N N
ICA-N N
MPCA-N N
PCA-SV M
ICA-SV M
[image:4.595.312.558.65.253.2]MPCA-SV M Accuracy 0.58896 0.48275 0.49253 0.73966 0.71641 0.73979 Specificity 0.10588 0.25 0.26087 0.43636 0.64285 0.4528 Sensitivity 0.88224 0.60526 0.61363 0.82887 0.73584 0.84615 Precision 0.65 0.25 0.26087 0.42857 0.39130 0.52173
Fig. 3. Performance analysis of proposed and conventional methods on lung cancer
[image:4.595.304.550.369.541.2]C. Examination of Proposed Model by Varying the Training Percentage
Fig 4 illustrates the accuracy of the proposed model by varying the training percentage.
Fig. 4. The accuracy of proposed and conventional methods by varying training percentage to 50%, 60%, 70 %, 80% and 90 in
Lung cancer
The performance of the proposed model is compared to other conventional methods. Fig shows the accuracy of diagnosing Lung cancer disease. From the graph, it is evident that the accuracy of the proposed model for 50% training is 18.39%, 24.46%, 16.72% and 21.38% better from ICA-SVM, MPCA-NN, ICA-NN, and PCA-NN, respectively. For 60% training, the accuracy of the proposed method is 0.75%, 11.35%, 32.23%, and 21.43% better from ICA-SVM, MPCA-NN, ICA-NN and PCA-NN, respectively. For 70% training, the accuracy of the proposed MPCA-SVM model is 6.43%, 14.22%, 19.23% and 17.11% superior to ICA-SVM, MPCA-NN, ICA-NN and PCA-NN, respectively. The proposed model for training percentage 80 is 14.74%,
27.78%, 53.24% and
23.94% better than
[image:4.595.42.295.709.780.2]International Journal of Innovative Technology and Exploring Engineering (IJITEE) ISSN: 2278-3075, Volume-8 Issue-8 June, 2019
ICA-NN and PCA-NN, respectively.
[image:5.595.46.292.157.302.2]The sensitivity of the proposed model over other methods by varying the training percentage is illustrated in Fig 5. In this, the sensitivity of the proposed model for diagnosing the Lung cancer diagnosis is illustrated in Fig. Here, the sensitivity of the proposed method is 16.34%, 6.35%, and 28.51% better from ICA-SVM, MPCA-NN, and ICA-NN, respectively.
Fig. 5. Sensitivity of proposed and conventional methods by varying training percentage to 50%, 60%, 70 %, 80% and 90%
in Lung cancer
For 60% of training, the proposed model attains great sensitivity than other methods, which is 14.81%, 23.43%, and 18.68% better from ICA-SVM, MPCA-NN, and ICA-NN, respectively. For 70% training, the proposed model concerning sensitivity is 3.74%, 22.77%, and 2.49% better than ICA-SVM, MPCA-NN, and ICA-NN respectively. For 80% of training, the proposed model is 7.54%, 15.89%, and 21.95% better than ICA-SVM, MPCA-NN and ICA-NN, respectively. For 90% of training, the proposed model has attained better sensitivity than other methods, and it is 8.83%, 3.49%, and 37.26% better than ICA-SVM, MPCA-NN and ICA-NN respectively. The specificity of the proposed model over other conventional methods is given in Fig 6 by varying the training percentage. The diagnosis of lung cancer is illustrated in Fig
Fig. 6. Specificity of proposed and conventional methods by varying training percentage to 50%, 60%, 70 %, 80% and 90%
in Lung cancer
In this, for 50% training, the proposed method is 3.43% better than PCA-SVM, 25.88% better than ICA-NN and 70.93% better than PCA-NN. For 60% of learning, the proposed method is 9.42% better from MPCA-NN and 72.35% better from PCA-NN. For 70% of training, the developed diagnosis
model is 11.07% better than MPCA-NN and 69.55% better than PCA-NN. For 80% training, the specificity of the proposed method is 5.71%, 17.58%, 17.58%, 16.66% and 73.52% better from PCA-SVM, MPCA-NN, ICA-NN, and PCA-NN, respectively.
VI. CONCLUSION
This paper has proposed a new disease diagnosing model in two stages (i) Utilization of Map Reducing Framework for reducing the huge data (ii) Classification. Initially, the input medical data was given to mapping reduce framework. Here, MPCA was used to reduce the given bulk data. Then, the reduced data was given to the classification process, where it classifies the disease with high accuracy. For this, this paper uses SVM classifier. After the implementation, the developed model has compared its performance over other conventional methods like PCA-NN, ICA-NN, and MPCA-NN, respectively in terms of performance measures like accuracy, specificity, and sensitivity. From the results, it was observed that the accuracy of the proposed model was 2.31%, 39.69%, 61.54% and 40.86% better than PCA-SVM, MPCA-NN, ICA-NN, and PCA-NN, respectively. The specificity of the proposed model was 11.54%, 13.53%, 53.65%, 82.38%, and 49.86% superior to ICA-SVM,
PCA-SVM, MPCA-NN, ICA-NN, and PCA-NN,
respectively. The sensitivity of the proposed diagnosis model is 4.02% and 7.54% better from MPCA-NN and PCA-NN, respectively. Thus the results have proven the superiority of the proposed model over other methods concerning accurate disease diagnosis.
ACKNOWLEDGMENT
The authors wish to acknowledge the funding support from Mahatma Gandhi University, Kottayam, Kerala, India
REFERENCES
1. Dewan Md. Farid, Mohammad Abdullah Al-Mamun, Bernard Manderick and Ann Nowe, "An adaptive rule-based classifier for mining big biological data", Expert Systems with Applications, vol. 64, pp.305–316, 2016.
2. Yuanfang Chen, Noel Crespia, Antonio M. Ortizb and Lei Shuc, "Reality mining: A prediction algorithm for disease dynamics based on mobile big data", Information Sciences, July 2016.
3. C. W. Cheng, N. Chanani, J. Venugopalan, K. Maher and M. D. Wang, "icuARM-An ICU Clinical Decision Support System Using Association Rule Mining," IEEE Journal of Translational Engineering in Health and Medicine, vol. 1, pp. 4400110-4400110, 2013.
4. James A.Rodger, "Discovery of medical Big Data analytics: Improving the prediction of traumatic brain injury survival rates by data mining Patient Informatics Processing Software Hybrid Hadoop Hive", Informatics in Medicine Unlocked, vol. 1, pp.17–26, 2015.
5. Hang Yang and Simon Fong, "Countering the concept-drift problems in big data by an incrementally optimized stream mining model", Journal of Systems and Software, vol. 102, pp. 158–166, April 2015. 6. Chih-Fong Tsai, Wei-Chao Lin and Shih-Wen Ke, "Big data mining
with parallel computing: A comparison of distributed and Map Reduce methodologies", Journal of Systems and Software, vol. 122, pp. 83–92, December 2016.
7. Juby Mathew, Vijayakumar R, “Big Data Processing Framework for Cancer Diagnosis Using Support Vector Machine classifier” on IJEAM(International Journal of Engineering, Applied and Management Sciences
[image:5.595.55.267.553.680.2]8. O. Maqbool, H. A. Babri, A. Karim and M. Sarwar, "Metarule-guided association rule mining for program understanding," IEEE Proceedings - Software, vol. 152, no. 6, pp. 281-296, 9 Dec. 2005. 9. Hyun Hak Kim and Norman R. Swanson, "Mining big data using
parsimonious factor, machine learning, variable selection and shrinkage methods", International Journal of Forecasting, August 2016.
10. Juby Mathew, Vijayakumar R, “Multilinear Principal Component 11. Analysis with SVM for Disease Diagnosis on Big Data” on IETE
Journal of Research e-ISSN: 0974-780X, p-ISSN: 0377-2063, 2019 12. Yunliang Chen, Fangyuan Li and Junqing Fan, "Mining association
rules in big data with NGEP", Cluster Computing, vol.18, no. 2, June 2015.
13. Hela Ltifi, Emna Benmohamed, Christophe Kolski and Mounir Ben Ayed, "Enhanced visual data mining process for dynamic decision-making", Knowledge-Based Systems, September 2016.
Dr Juby Mathew is a Dynamic, Resourceful Teaching Professional. He received his PhD in Computer Science from Mahatma Gandhi University, Kottayam. He pursued his MCA from Periyar University, Salem, MPhil in Computer Science from Madurai Kamaraj University and M.Tech from MS University, Tirunelveli. So far he has published his articles in 8 international Journals and presented papers in more than twenty National and International Conferences. Over 15 years of diversified teaching and corporate experience made him actively involved in all areas of education, including Curriculum Development, Student Mentoring, Student Career Preparation, and Community Work. At present, he is working as an Associate Professor in the Department of Computer Applications at Amal Jyothi College of Engineering, Kanjirapally, Kerala. He won Best Faculty award as a result of his proven ability to enhance students' performance, promising to shape a better world for the students and empower them with knowledge. He has reviewed many paper publications and journals and PhD thesis within an incredibly short period.