USEFULNESS OF CTP SCORE AND MELD SCORE
IN LISTING PATIENTS FOR LIVER TRANSPLANTATION
Dissertation Submitted to
THE TAMIL NADU DR. M.G.R. MEDICAL UNIVERSITY in partial fulfillment of the regulations
for the award of the degree of
D.M (GASTROENTEROLOGY) BRANCH – IV
DEPARTMENT OF MEDICAL GASTROENTEROLOGY
GOVT. STANLEY MEDICAL COLLEGE & HOSPITAL
THE TAMIL NADU DR. M.G.R. MEDICAL UNIVERSITY
CHENNAI, INDIA.
CERTIFICATE
This is to certify that the dissertation entitled “USEFULNESS OF CTP SCORE
AND MELD SCORE IN LISTING PATIENTS FOR LIVER
TRANSPLANTATION” is the bonafide original work of Dr. R. MURALI in
partial fulfillment of the requirements for D.M (GASTROENTEROLOGY)
BRANCH – IV Examination of the Tamilnadu Dr. M.G.R. Medical University to
be held in August 2010. The period of study was between January 2008 and
December 2009.
Dr.C.VAMSADHARA, M.D., Ph.D. DEAN
Govt. Stanley Medical College & Hospital, Chennai-600 001.
Prof. V. JAYANTHI , M.D.,D.M., Professor & Head
Department of Medical Gastroenterology
DECLARATION
I, Dr.R.MURALI, solemnly declare that the dissertation
titled, “USEFULNESS OF CTP SCORE AND MELD SCORE IN
LISTING PATIENTS FOR LIVER TRANSPLANTATION” is a
bonafide work done by me at Govt.Stanley Medical College & Hospital
during 2007-2010 under the guidance and supervision of
Dr.V.JAYANTHI, M.D.,D.M., Professor and Head, Department of Medical
Gastroenterology, Stanley Medical College, Chennai-600 001.
The dissertation is submitted to The Tamilnadu, Dr. M.G.R. Medical
University, towards partial fulfillment of requirement for the award of
D.M Degree (BRANCH – IV) in Gastroenterology.
Place: Chennai.
Date:
ACKNOWLEDGEMENT
I express my profound gratitude to Dr.C.VAMSADHARA, MD.,
Ph.D., Dean of Government Stanley Medical College and Hospital,
Chennai–600001 for permitting me to use all the needed resources for this
dissertation work.
I sincerely express my grateful thanks to Prof V. JAYANTHI, M.D.,
D.M., Professor and Head, Department of Medical Gastroenterology,
Stanley Medical College for her unstinted support and advice rendered
throughout my study. I thank her for being a constant source of
encouragement and inspiration not only in this study but in all my
professional endeavours.
I express my sincere thanks to all the Assistant Professors,
Dr A. Murali, Dr T. Rajkumar Solomon, Dr. M. S. Revathy and
Dr. R. Ravi, Department of Medical Gastroenterology, Stanley Medical
College, Chennai.
My sincere thanks to Mr. A. Vengatesan, Lecturer in statistics,
clinical Epidemiology unit, Institute of Social Paediatrics, Govt. Stanley
I also sincerely thank Ethical Committee, Stanley Medical College,
Chennai for approving my study.
I extend my sincere thanks to my subjects but for them the project
would not have been possible.
I am greatly indebted to all my friends, Postgraduate colleagues who
have been the greatest source of encouragement, support, enthusiasms,
CONTENTS
Serial. No.
Title Page No.
1. INTRODUCTION 1
2. AIM OF THE STUDY 4
3. REVIEW OF LITERATURE 5
4. MATERIALS AND METHODS 29
5. RESULTS 32
6. DISCUSSION 44
7. SUMMARY 49
8. CONCLUSION 52
9. BIBLIOGRAPHY 53
10. ANNEXURES 63
Abbreviations Proforma
INTRODUCTION
Liver transplantation is the only definite treatment modality for patients with
end-stage liver cirrhosis. A major function of the predictive model is to
accurately assess the probability of mortality within a given time interval, so
that a timely liver transplantation can be performed.
The Child score, which was first proposed in the 1960s and then modified as
the Child-Turcotte-Pugh (CTP) score. The selection of predictors and
construction of the CTP system were empirical, and the system contains
parameters that were felt very important to affect the outcome.
Although never formally validated as a prognostic tool, the CTP score is
useful to assess the relative risk of mortality in patients with cirrhosis and
has been popular for the past 3 decades. However, a major defect of the CTP
system is a relatively narrow score range from 5 to 15. While the waiting list
of liver transplantation is rapidly growing and patients on the waiting list far
out number the cadaveric liver donors, the priority of patients with the same
CTP score awaiting transplantation becomes difficult to judge.
A simple first-come, first-served principle was proposed and used in the
transplantation society [1]. However, investigators subsequently found that patients with a longer waiting time may actually have a less severe degree of
affects survival and was abandoned as a criterion in organ allocation.
Another potential inherent flaw of the CTP system is that it contains
subjective variables, including the severity of encephalopathy and ascites,
which may be greatly influenced by personal judgment from center to center
during status interpretation. These drawbacks compromise the fairness of
organ allocation in liver transplantation.
The concept of a model for end-stage liver disease (MELD), initiated by the
Mayo Clinic group in 2000[2], emerged and was aimed to amend these defects. The MELD was originally created for the prediction of mortality
after Transjugular Intrahepatic Porto systemic Shunt [3]. On the basis of simple, readily available, and reproductive variables [serum creatinine,
bilirubin, international normalized ratio (INR), and initially etiology], the
MELD allows the identification of patients with end-stage liver disease and
a median survival as short as 3 months.3 Because of the objective nature of its components and its ability to identify increasing death risk, this score was
adopted by the United Network for Organ Sharing (UNOS) in place of the
CTP score for the allocation of livers from deceased donors [4]. If the MELD represents determinant progress in terms of methodology and validation, its
accuracy for the prediction of outcome in cirrhotic patients is also not
Hence, this study is to evaluate the superiority of CTP vs. MELD score in
prediction of outcome in patients with End stage Liver disease, who are
AIM
The main aim of this prospective study was to compare the accuracy of
the Child-Pugh score and the MELD score for the prediction of 3 month
REVIEW OF LITERATURE
Thomas Starzl carried out the first human liver transplant in 1963 in Denver.
Initially the outcomes were very poor; however the persistence of Starzl and
his team was rewarded and in 1968, Calne set up the second transplant
program in Cambridge.
Patients were usually very sick at the time of transplant and few survived
the post-operative care. Over the next two decades, the numbers of patients
grafted gradually increased and survival rates improved. There is no one
reason for this improvement, but better selection, improved anaesthetic and
surgical techniques, the use of powerful and specific anti-microbial and
immunosuppressive agents all made significant contributions. In the 1980s,
new programs developed primarily in North America and in Europe. Now
liver transplantation has become a routine procedure for patients with
end-stage liver disease.
The decision to consider liver transplantation is based on:
1. An assessment of the severity of liver failure.
2. The prognosis for the patient in response to current medical/surgical
therapy
3. The quality of the patient’s life (as a consequence of the liver disease)
patient’s health.
The determination of suitability is independent of the underlying diagnosis,
and for that reason the conditions for which liver transplantation may be an
appropriate therapy constitute a list of almost all liver diseases.
The Donor Organ Shortage
The source for donor livers in the western world is almost exclusively from
heart beating brain dead donors. Sophisticated schemes are required to
identify potential donors, retrieve their organs and transport the organs to the
location of the potential recipient. At the same time, the number of potential
recipients awaiting liver transplant continues to grow at a furious pace,
outstripping the modest increases in donor numbers. This has meant that
there are many more recipients for every donor liver. Thus in the United
States in 2000, there were over 17000 patients on the waiting list, only 4579
cadaveric transplants done and 371 living related transplants. There were
1347 deaths on the waiting list [7]. The disparity between donor availability and recipient number has led to growing numbers of patients on the waiting
list for liver transplant.
Innovative responses to the donor shortage have been introduced but while
these approaches may help relieve the situation, they are unlikely to ease the
1. Non-heart beating donors. Non-heart beating donors are uncommon,
and the frequency of primary graft non-function and later, biliary strictures
are greater in these allografts.
2. Split livers—the division of a cadaveric organ between two recipients.
However, only some cadaveric donor livers are suitable for splitting.
3. Living donation—the harvesting of liver segments from living donors.
Many recipients lack a family member or friend who is suitable or willing
for living donation. Moreover, living segmental liver transplantation poses
real risks of morbidity and even mortality (1% or more) for the donor.
4. Use of marginal donors and extended use donor organs
Marginal donors: some donor livers are associated with a higher
probability of primary non-function (the so-called marginal donor). Marginal
organs include those from older or obese donors, or donors who are unstable
prior to organ retrieval. Other marginal grafts include steatotic livers, in
which histology demonstrates greater than 25% microvesicular or
macrovesicular fat. These grafts are associated with a higher incidence of
primary non-function of the allograft.
Extended use organs from patients infected with present or past viral
hepatitis B or C and those with extrahepatic malignancy or treated bacterial
already infected by the same virus, albeit only after the recipient is apprised
and has given consent. An example would be putting an anti-hepatitis C
positive liver into an antihepatitis C positive recipient, or an anti-HBcore
positive liver into an HBsAg positive recipient.
5. Xenotransplants: the use of genetically modified animals, such as pigs or
primates, is still a very long way from clinical use. While some of the
problems of hyperacute rejection may be overcome, problems, such as
chronic rejection, freedom from introducing infection (such as the porcine
endogenous retrovirus (PERVs) as well as physiological concerns make it
unlikely that this approach will provide a solution to the organ shortage
in the next decade.
6. Increasing organ donation: There are wide variations in the rates of
organ donation—between 8 and 37 donors per million. Attempts to increase
organ donation by education have largely failed: the most successful model
in Spain is dependent on provision of a well-organized system of donor
co-ordinators and acceptance cell transplantation and hepatocyte
transplantation. Thus, it is unlikely that these methods will meet the needs of
Selection for Liver Transplantation
Evaluation of candidates for liver transplantation can be reduced to three
core questions:
• What is the severity and prognosis of the patient’s liver disease?
• Are there confounding medical, surgical or psychological factors
which would reduce the expectation of a liver transplantation?
• What are the wishes of the patient in regards to liver transplantation?
These questions are best addressed in a multidisciplinary process. The
evaluation may be carried out in an outpatient setting.
The prospective candidate is assessed by transplant surgeons and physicians,
social workers, and selected subspecialists including psychiatrists,
cardiologists, pulmonologists and nephrologists. Previous investigations
including radiographs and biopsies are retrieved and new investigations are
ordered where necessary. When the information gathering segment of the
evaluation is complete, the patient is presented to the transplantation
evaluation committee and a decision is made regarding placement on the
Liver transplant programs must inform and educate prospective recipients
and their families of the risks and benefits of liver transplantation. It is
important to provide the patient with the opportunity to withdraw from
transplant assessment if they do not wish to proceed. Conversely, whenever
the transplant program determines that the patient is not a suitable candidate;
the program should facilitate the patient in receiving a second opinion
regarding their suitability, if they should so wish.
Indications for consideration of liver transplantation in patients with
chronic liver disease
Recurrent gastroesophageal variceal hemorrhage
Refractory ascites
Spontaneous bacterial peritonitis
Severe hepatic encephalopathy
Hepatorenal syndrome
Hepatopulmonary syndrome
Hepatocellular carcinoma
Absolute contraindications
Severe (uncontrolled) infection outside the hepatobiliary system
Metastatic cancer (except some neuroendocrine cancers)
Extra hepatic cancer (other than local skin cancer)
Cholangiocarcinoma
Advanced cardiopulmonary disease
AIDS
Severe pulmonary hypertension
Technical considerations (e.g., widespread intra-abdominal venous
thrombosis)
Relative contraindications
Recent drug or alcohol abuse
Age >70 years
HIV infection, without AIDS
Inability to be compliant with immunosuppression protocol and/or
participate in routine post-transplant medical follow-up
Advanced chronic renal disease
Allocation and Distribution of Donor Livers
Different countries have adopted different approaches to allocation of
cadaveric donors of solid organs for transplantation:
US: In the US, there is no Federal limitation on the number of transplant
centers. Patients are centrally listed and available organs allocated to the
individual recipient. At present allocation gives priority to the sickest
patient. The greatest priority is given to patients with fulminant hepatic
failure or primary allograft non-function, and for certain pediatric
indications. For all other candidates, priority is determined by the MELD or
PELD (the pediatric scoring system) score. An adjustment has been made
for patients with hepatocellular cancer.
UK: The number of centers designated for NHS (public funded) treatment is
controlled by central government. The six transplant units have areas
(according to their contracted activity) and any organ offered in their area
can be used for a listed patient. Supra-urgent patients (those with fulminant
hepatic failure) will have national priority. The individual unit determine
which recipient should receive donor organs offered to that area. The units
have agreed indications and contra-indications to ensure equity and justice.
Europe: European countries have adopted a range of approaches to organ
retrieval, allocation and distribution.
Timing of Placement on the Waiting List
A useful approach to the often difficult questions regarding timing of
placement of a patient with liver disease on the transplant waiting list is to
consider compensated (or stable) and decompensated cirrhosis.
Stable Cirrhosis: is defined as cirrhosis in a patient who has never
experienced any one of the four cardinal features of decompensation:
variceal hemorrhage, accumulation of ascites, jaundice associated with
cirrhosis, or encephalopathy.
Decompensated cirrhosis: cirrhosis and the onset of at least one of these
clinical phenomena is defined as decompensated cirrhosis. The onset of
decompensation is associated with significantly impaired survival and
indicates the need to evaluate for liver transplantation. Spontaneous bacterial
peritonitis and or hepatorenal failure are indicators of significantly worsened
prognosis, and should prompt transplantation evaluation.
Indications for evaluation of liver transplantation are listed above.
Paradoxically, some of these indications may, when severe, become
Assessment of Severity and Prognosis of Chronic Liver Disease
The severity of liver failure in patients with chronic liver disease can be
assessed by several models although the two models currently used are the
Child-Pugh classification and the MELD score.
Child-Turcotte-Pugh Class
In the Child Pugh classification scoring is done based on the following
parameters listed in the table.
Child-Turcotte-Pugh classification
Variable 1 2 3
Encephalopathy None Grade I or II Grade III or IV
Ascites None Mild Moderate
Bilirubin (mg/dl) <2 2-3 >3
Albumin (g/dl) >3.5 2.8-3.5 <2.8
Prothrombin time
Prolongation in seconds
INR
<4
<1.7
4-6
1.7-2.3
>6
>2.3
Scores are summed to determine Child’s class: A=5-6, B = 7-9 & C=10-15.
variables (ascites, encephalopathy and nutritional status). Again, the
selection of these five variables as well as the cut-off values for bilirubin and
albumin are empirical. The five variables and their respective cut-off values
were arranged so as to define three distinct groups of increasing severity (A,
B and C). Patients whose individual values fall into different groups could
not be categorized. Therefore, variables have been ascribed 1, 2 and 3 points
according to whether their values fell within the limits of groups A, B and C,
respectively. The score is the sum of these points, ranging from 5 to 15. It is
generally (but not universally) accepted that patients with a score between 5
and 8 belong to group A, patients with a score between 9 and 11 belong to
group B and patients with a score between 12 and 15 belong to group C.
A modified version, termed Child–Pugh score, has been proposed almost 10
years later [9] , In this modified version, nutritional status is replaced by Prothrombin time. A difficulty comes from the fact that, across different
countries, prothrombin has been expressed either as a time value
(prothrombin time in seconds) or as a percentage of the activity of normal
plasma (Prothrombin index or ratio). It can be estimated that the original
cut-off values of 4 and 6 seconds for prothrombin time correspond to a ratio of
approximately 50% and 40% of normal, respectively. The lowest cut-off
corresponding to the sum of individual points, allows to categorize patients
in Child– Pugh grades A (5–6 points), B (7–9 points) and C (10–15 points).
Importantly, the total range of points (5–15) is not equally distributed across
grades A, B and C, probably in an attempt to mirror more efficiently the
clinical impact of the each grade in terms of prognosis.
The variables included in Child–Pugh score are often considered as
reflecting the synthetic (albumin and prothrombin) and elimination
(bilirubin) functions of the liver. However, this concept may be viewed as an
oversimplification. Indeed, albumin is influenced not only by hepatic
synthetic function but also by transvascular escape or clearance, favoured by
sepsis [10] and ascites [11]. Similarly, bilirubin is increased in case of renal insufficiency, hemolysis, and sepsis [12], all of which are not uncommon in patients with cirrhosis. Decreased prothrombin index may be related to the
activation of coagulation, the major cause of which is sepsis [13]. Metabolic encephalopathy can be precipitated by sepsis or renal insufficiency [14]. As a result, albumin, bilirubin, prothrombin and encephalopathy represent
prognostic markers coming from a broader source than the pure assessment
of liver ‘functions’. Thus, Child–Pugh score may be viewed as a multiorgan
assessment in patients with underlying cirrhosis rather than a simple
Child score and subsequently, Child–Pugh score were initially proposed in
the limited setting of the evaluation of surgery for portal hypertension
(portacaval shunting and transection of the oesophagus) [9]. However, its prognostic value has been demonstrated in many other situations involving
cirrhosis over the last 30 years. In particular, multivariate analyses using
Child–Pugh score as an entity have shown that it has an independent
prognostic value in the settings of ascites[15],ruptured oesophageal varices [16] subclinicalencephalopathy[17],hepatocellular carcinoma [18],liver surgery [19], alcoholic cirrhosis [20], decompensated HCV-related cirrhosis [21], primary sclerosing cholangitis [22], primary biliary cirrhosis [23] and Budd–Chiari syndrome [24]. Interestingly, the prognostic information provided by the addition of different markers of liver metabolism (such as the elimination of
galactose, ICG, aminopyrine, or lidocaine) to the variables of Child–Pugh
score is limited [25–28]. Similarly, the addition of usual anthropometric markers of nutritional status does not seem to add much to the predictive
value of Child–Pugh score [29]. This finding is in contrast with the initial assumption made in Child– Turcotte score which, in contrast to Child–Pugh,
included nutritional status [8].
The main application of Child–Pugh score has been to stratify or to select
non-randomly administered therapy, or for randomized clinical trials. Contrasting
with its wide validation as a prognostic index, Child–Pugh score is seldom
incorporated into algorithms for the management of individual patients, with
the exception of patient selection for surgical resection of hepatocellular
carcinoma [30] or for extrahepatic surgery [31]. However, at the bedside, Child– Pugh score is widely used as a simple descriptive or prognostic
indicator and is frequently associated to other indicators.
A first limitation is related to the fact that the five basic components of
Child–Pugh score have been selected empirically. It can be argued that
studies reported thereafter, have shown that these variables do have a
statistically significant impact on the outcome [32, 33–37]. However, not all variables have an independent influence. It can be anticipated, for instance,
that albumin and coagulation factors, both synthesized by the liver, are
strongly correlated to each other. Including these two variables in a single
score might result in overweighting their influence. Only multivariate
analysis allows selecting variables, which do not fully interfere with each
other.
A second limitation comes from the arbitrary use of cut-off values for the
quantitative variables. Neither there is evidence that these cut-off values are
evidence that mortality risk increases linearly across Child’s grades A, B and
C. For example, a patient with a bilirubin level of 3 mg/dl will be
categorized in the same bilirubin class (class C) that a patient with a
bilirubin level of 30 mg/dl. This represents a ‘ceiling effect’ on quantitative
variables which does not exist with continuous scores derived from
regression models.
And further limitations are due to the fact that important prognostic factors
are not taken into account. In particular, a number of studies have
emphasized the determinant influence of renal function in the course of
cirrhosis [15, 33, 35, 36]. For instance, the weight of creatinine is more than twice as high as that of bilirubin in MELD score [36].
Other studies have shown that markers of portal hypertension including
oesophageal varices [38], portal blood velocity [39] and hepatic venous pressure gradient [26] provide additional prognostic information when added to the variables of Child–Pugh score.
Lastly, Child–Pugh score does not take into account the cause of cirrhosis,
the possible coexistence of several causal factors, and the persistence of a
damaging process such as persistent alcohol abuse, ongoing HBV or HCV
In previously reported studies, the variation in survival explained by Child–
Pugh score remains low (less than 50%), as it is the case with most survival
models [41] emphasizing the fact that other factors play an important role in prognosis.
MELD Score
The complex issues of optimal indications for transplantation and
prioritization for the allocation of liver grafts have been the main incentives
to the development and widespread diffusion of MELD score. However, it
must be noted that MELD score has been originally created with the aim of
predicting survival after Transjugular intrahepatic portosystemic shunt
(TIPS)[36], a context that may differ from that of candidates for transplantation. On the basis of multivariate analysis using Cox model, the
authors found
that, among a list of predetermined variables, four objective variables had a
significant and independent impact on survival; namely bilirubin, creatinine,
INR and the cause of cirrhosis (alcoholic and cholestatic versus other
causes).
Logarithmic transformation of quantitative values has been used in order to
coefficient has been attributed to each prognostic variable as a reflect of
their proper weight on mortality. For a given patient, the final risk score (the
ancestor of the current MELD score), derived from a survival function, is as
follows: R=0.957 loge (creatinine [mg/dl]) + 0.378 loge (bilirubin [mg/dl]) +
1.120 loge (INR) + 0.643 (cause of cirrhosis). ‘Cause of cirrhosis’ is quoted
0 if alcoholic or cholestatic and 1 for all other causes. Unfortunately, this
score does not allow a direct estimation of the probability of survival at a
given time for one patient with given values of creatinine, bilirubin and INR.
Estimating the probability of survival needs further computation based on
the survival function of the model. A pocket chart that can be used for
estimating life expectancy with individual values has been proposed.
Unfortunately, the normogram is not really friendly for use at the bedside. In
the same series, Child–Pugh score, although significantly correlated with a
poor outcome on univariate analysis, could not accurately predict survival on
multivariate analysis. Interestingly, Child–Pugh score was particularly
inaccurate in the subgroup of patients of grade B with renal impairment,
highlighting the key importance of renal function in cirrhosis.
For years, the allocation of liver grafts had been based on waiting time.
However, important studies clearly showed that waiting time is not an
criteria for more efficient and fair organ placement [42]. Again, attention skipped from TIPS to transplantation. In a subsequent study [2], a slightly modified score, termed MELD, was tested in different populations of
cirrhotic patients. For ease of use, the score was multiplied by 10 and
rounded, giving the following formula: MELD score = 9.6 loge (creatinine
mg/dl) +3.8 loge (bilirubin mg/dl) + 11.2 loge (INR) + 6.4 (cause of
cirrhosis [0 if cholestatic or alcoholic, 1 otherwise]). This study showed that
MELD score adequately predicts mortality in hospitalized as well as
ambulatory cirrhotic patients, that the model is generalizable to patients with
various causes and severity of cirrhosis, that MELD score is a useful scale
for assessing On the grounds of these results, MELD score was finally
adopted in the United States in 2002 as the reference scoring system to rank
patients for liver transplantation. Practically, two additional modifications
have been performed so far. Firstly, the variable referring to the cause of
cirrhosis (cholestatic or alcoholic versus other causes) has been abandoned
and replaced by a constant value. As a result the current score is as follows:
9.6 loge (creatinine mg/dl) + 3.8 loge (bilirubin mg/dl) + 11.2 loge (INR)+
6.4.
Secondly, candidates with HCC are listed with a MELD score equivalent to
according to which the tumor is classified as stage I or II. Stage I
corresponds to a single nodule less than 2 cm. Stage II corresponds to a
single nodule between 2 and 5 cm, or 2 or 3 nodules each less than 3 cm. By
February 2003, these additional MELD points have been lessened to 20 and
24, respectively, because it was felt that patients with HCC had
over-prioritization. Nonetheless, these patients if not transplanted within 3
months, receive additional MELD points equivalent to a 10% increase in
pre-transplant mortality every 3 months until they are transplanted or
determined to be unsuitable for transplantation, because of excessive tumor
progression. This latter change has been done because a significant
proportion of patients with HCC have a compensated cirrhosis and low
MELD score. Although they are good candidates for transplantation, they
would be unlikely to be transplanted, unless receiving ‘extra’ points
In contrast to Child–Pugh score, the variables of MELD score have been
selected in a given population and the score has been validated thereafter in
an independent sample [2, 36]. Recently, studies have been reported confirming that MELD is a robust risk score in patients undergoing TIPS,
retransplantation for early graft failure. It has been suggested that MELD
score is significantly correlated to mortality risk in patients with
non-paracetamol-induced acute liver failure while, in contrast, there is no
correlation between MELD score and mortality in those with paracetamol
overdose or early graft failure [44]. Nonetheless, the use of MELD score in patients with acute liver failure, whether related or not to paracetamol, seems
highly questionable since neurological status, a crucial prognostic index in
this context, is not taken into account.
The application of MELD score for ranking candidates for transplantation
gave the opportunity to assess prospectively its advantages over waiting time
and UNOS status for prioritization in the US. By comparing data from two
time periods, before and after MELD, a recent evaluation has shown that the
application of MELD score for prioritization resulted in a 12% decrease in
the total number of new candidates listed for transplantation [45]. Practically, less patients with low risk scores were listed to ‘take place’ on the list and
take advantage of it in terms of waiting time. In addition, there was a 3.5%
reduction in mortality on the waiting list (a difference which was not
statistically significant as compared to pre-MELD period), a 10% increase in
result solely from MELD score) and no significant change in post
transplantation survival [45]. After additional points were ascribed to patients with small HCC, a significant decrease in the interval between listing and
transplantation as well as a significant decrease in the rate of dropout from
the waiting list due to tumor progression were observed [46]. However, a perverse effect of the system was that, in parallel, there was a threefold
increase in the number of patients listed with a diagnosis of HCC.
Importantly, there was also a significant increase in the proportion of
patients who were found to have a misdiagnosis of HCC and no identifiable
tumor on the explanted liver [47]. It is often difficult to ascertain the malignant nature of small nodules (<1 cm) within a cirrhotic liver, even with
current imaging techniques [48]. The current allocation system obviously incites to categorize patients as having a small HCC, even when the
malignancy is not clearly demonstrated.
In contrast to its ability to evaluate pre-transplant mortality risk in
candidates for transplantation, pre-transplantation MELD score seems to be
a poor predictor of post transplantation survival, except for extreme values
(>35) [49–51]. Indeed, post-transplantation survival depends on many factors other than recipient’s condition, most of which (in particular those related to
Limitations
MELD score shares with Child–Pugh score several limitations. First, the use
of multivariate analysis to determine which variables will be included in the
final score can be viewed as more reliable than empirical selection of
variables. However, multivariate analysis is performed on the basis of
variables, which initially were also selected empirically because they were
felt to have a potential prognostic influence. Therefore, it cannot be excluded
that some important variables have not been taken into account for analysis.
It is worth noting that some of the most widely accepted prognostic scores,
such as TNM (for Tumor Node Metastasis), Glasgow coma scale and
APACHE score rely on predictive variables selected empirically and not
statistically.
Second, variables included in MELD score, in contrast to encephalopathy
and ascites, are theoretically objective and not influenced by subjective
appreciation. However, in practice, creatinine and bilirubin can be altered by
therapeutic interventions (diuretics in particular), sepsis or hemolysis. The
choice of INR rather than other markers of coagulation including
prothrombin time and Prothrombin index is a controversial issue. Another
There are also some proper limitations to MELD score. While its principal
application has been liver transplantation and allocation of donors, MELD
score has been established among a population of candidates for TIPS.
Although MELD proved to be a robust and efficient prognostic score in
candidates for transplantation [6], it is possible that a score specifically tailored for liver transplantation could have been even more effective in this
setting.
Another limitation comes from the absence of clear-cut discriminant values
with MELD score. With time, hepatologists have been used to deal with the
simple limits of Child–Pugh’s class A, B and C. Such discriminant limits
with MELD score have not yet been determined in a broad scope of
situations. A prospective evaluation of MELD score in different situations
(or for different therapeutic interventions) might lead to different cut-off
values, rendering the decision process more complex than with the universal
use of Child–Pugh classes.
The principal limitation of MELD score is the need for computation,
limiting its usefulness at the bedside. MELD, derived from a study focussing
on TIPS patients, has not been anticipated to be widely used. Logarithmic
transformation of quantitative variables has been chosen to improve
evidence that statistical refinements translate in an identifiable improvement
in accuracy and reproducibility.
As an example, the cause of cirrhosis played a statistically significant and
independent role in the original model. However, it seems that the accuracy
did not change much when the cause of cirrhosis was eventually removed
from the list of variables [2, 36]. Whether a simplified score using the same objective variables, but without the need for computation would give a
MATERIALS AND METHODS
It was a prospective study between January 2008 and Dec 2009, where
consecutive patients with cirrhosis attending the liver clinic of Government
Stanley Medical College & Hospital were studied.
Inclusion criteria: Patients with an initial CTP score of 7 or more (equivalent
to class B or C) to fulfill the minimal listing criteria for liver transplantation,
were included.
The diagnosis of liver cirrhosis was based on the characteristic findings
including physical stigmata of cirrhosis, decreased serum albumin, and
increased serum globulin levels, computed tomography or ultrasonography
findings of uneven liver surface, coarsened echogenicity of liver
parenchyma, enlarged spleen and/or detection of ascites, and detection of
esophageal varices by endoscopy. The presence and severity of ascites were
detected and evaluated by computed tomography or ultrasonography. The
definition of hepatic encephalopathy was according to the West Haven
The underlying etiology of liver disease was attributed to hepatitis B virus
(HBV) infection if patients were seropositive for hepatitis B surface antigen
(HBsAg, RIA kits, Abbott Laboratories, North Chicago, IL) and attributed
to hepatitis C virus (HCV) infection if patients were seropositive for
antibody against HCV by a second-generation enzyme immunoassay
(Abbott Laboratories, IL) on at least two occasions.
The CTP scoring system is classified from A to C and calculated on the
basis of serum bilirubin and albumin levels, the prothrombin time (PT), and
the presence and severity of ascites and encephalopathy.9 To obtain the
MELD score for the patients, the Internet accessed at: www.unos.org or:
www.mayo.edu/int-med/gi/model/mayomodl-5-unos.htm.
The study was approved by the institutional review board and all patients
who participated in the study gave a written informed consent.
Statistical Analysis
Chi-squared test or Fisher’s exact test (two-tailed) was used for categorical
data. Spearman’s correlation analysis was used to estimate the correlation
score in predicting the risk of death, this study was performed by measuring
the concordance (c-statistic) equivalent to the area under the receiver
operating characteristic (ROC) curve. Receiving-operating-characteristic
(ROC) curve and the derived c statistic provide a global and standardized
appreciation of the accuracy of a marker or a composite score for predicting
an event. This statistic allows a simple comparison of the accuracy of
different prognostic scores within the same population. ROC curve
represents the plotting of sensitivity against 1-specificity. A c statistic of 0.5
means that discrimination is due to chance alone. A c statistic of 1 means
that the score perfectly predicts outcome (a goal never achieved in clinical
practice). Therefore, the accuracy of a score increases when c statistic moves
from 0.5 to 1. Comparison of the area under ROC curves was done using
the method of Hanley and McNeil. The outcome was assessed as 3-month
and 6-month mortality. All statistical analyses were conducted using SPSS
for Windows version 12 (SPSS, Inc., Chicago, IL) and MedCalc for
Windows version 4.2 (MedCalc Software, Mariakerke, Belgium). For all
RESULTS
A total of two hundred and one patients were enrolled during the study
period. Among them, 5 patients who underwent liver transplantation during
the follow-up were excluded from analysis. The natural history and outcome
were assessed for the remaining 196 cirrhotic patients who formed the basis
of this study.
Clinical characteristics and demographic data of patients included in the
study are shown in Table 1.The mean age of patients was 45.9 years (range
18 to 65 years).
Of the 196 patients, 150 were male and 46 were female. Patient who
underwent transplantation during the observation period were excluded for
this analysis. Forty patients died during the study period and 5 patients were
successfully transplanted. The mean CTP score was 7.44 (range 7 to 12) and
mean MELD score of all patients was 10.35 (range 6 to 41).
Of the 196 study patients, 16 (8.16%) and 40 (20.4%) patients died at 3- and
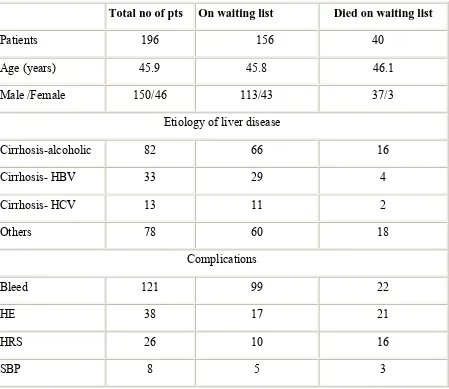
Table 1. Patient Characteristics and variables at the time of listing among
Survivors and Non-survivors on waiting list.
Total no of pts On waiting list Died on waiting list
Patients 196 156 40
Age (years) 45.9 45.8 46.1
Male /Female 150/46 113/43 37/3
Etiology of liver disease
Cirrhosis-alcoholic 82 66 16
Cirrhosis- HBV 33 29 4
Cirrhosis- HCV 13 11 2
Others 78 60 18
Complications
Bleed 121 99 22
HE 38 17 21
HRS 26 10 16
ETIOLOGY OF CIRRHOSIS
0 10 20 30 40 50 60 70 80 90
Alcohol HBV HCV Others
Etiology
N
u
m
b
er
o
f P
a
ti
en
ts
Of the 196 patients 41.8%of patients suffered from alcoholic liver disease
and 23.4% from virus hepatitis-induced cirrhosis. Other etiologies accounted
Complications of Cirrhosis
0 20 40 60 80 100 120 140
Bleed HE HRS SBP
Complications
N
u
m
b
er
o
f p
a
ti
en
ts
The Variceal Bleed represents a major complication constituting 61.7% and
Hepatic Encephalopathy was noted in 19.3% of the study population
The presence of Hepatorenal syndrome (HRS) and Spontaneous Bacterial
peritonitis (SBP) as complications of Liver cirrhosis were noted in 13.2%
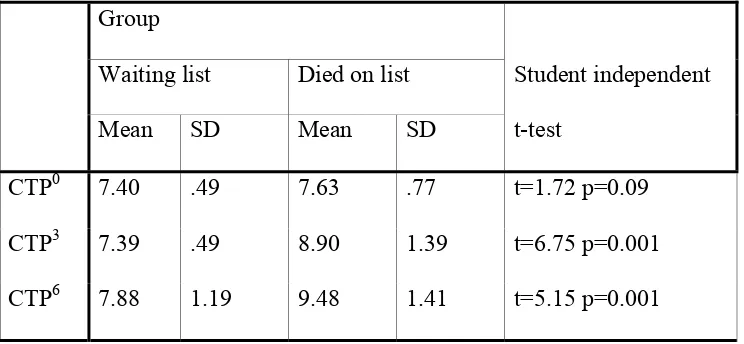
Table 2 : Follow up CTP scores are listed below
Group
Student independent
t-test Waiting list Died on list
Mean SD Mean SD
CTP0 7.40 .49 7.63 .77 t=1.72 p=0.09
CTP3 7.39 .49 8.90 1.39 t=6.75 p=0.001
CTP6 7.88 1.19 9.48 1.41 t=5.15 p=0.001
CTP0 = CTP score done at baseline. CTP3 = CTP score done at 3rd month. CTP6 = CTP score done at 6th month.
The Mean CTP score at baseline, 3 months and 6 months was 7.4, 7.39 and
7.88 respectively for patients in the waiting list and 7.63, 8.9 and 9.48
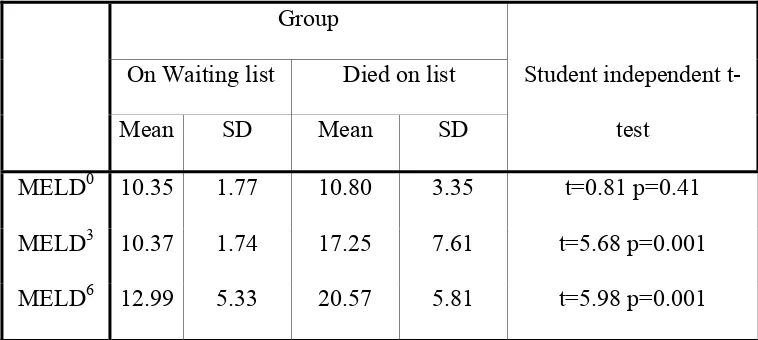
Table 3: Follow up MELD scores are listed below
Group
Student independent
t-test On Waiting list Died on list
Mean SD Mean SD
MELD0 10.35 1.77 10.80 3.35 t=0.81 p=0.41
MELD3 10.37 1.74 17.25 7.61 t=5.68 p=0.001
MELD6 12.99 5.33 20.57 5.81 t=5.98 p=0.001
MELD0 = MELD score done at baseline. MELD3 = MELD score done at 3rd month. MELD6 = MELD score done at 6th month.
The Mean MELD score at baseline, 3 months and 6 months was 10.35,
10.37 and 12.99 respectively for patients in the waiting list and 10.8, 17.25
Graph 1
CTP score ROC Curve
1 - Specificity
1.00 .75
.50 .25
0.00
S
ens
it
iv
it
y
1.00
.75
.50
.25
0.00
Source of the Curve
Reference Line
c6
c3
c0
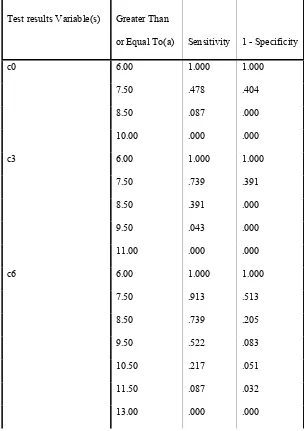
The ROC curve for CTP score at 3 months is 0.73 at CTP score 7.5 and also
Table 4: Coordinates of the Curve for CTP score
Test results Variable(s)
Positive if
Greater Than
or Equal To(a) Sensitivity 1 - Specificity
c0 6.00 1.000 1.000
7.50 .478 .404
8.50 .087 .000
10.00 .000 .000
c3 6.00 1.000 1.000
7.50 .739 .391
8.50 .391 .000
9.50 .043 .000
11.00 .000 .000
c6 6.00 1.000 1.000
7.50 .913 .513
8.50 .739 .205
9.50 .522 .083
10.50 .217 .051
11.50 .087 .032
Graph 2
MELD score ROC Curve
1 - Specificity
1.00 .75
.50 .25
0.00
S
ens
it
iv
it
y
1.00
.75
.50
.25
0.00
Source of the Curve
Reference Line
m6
m3
m0
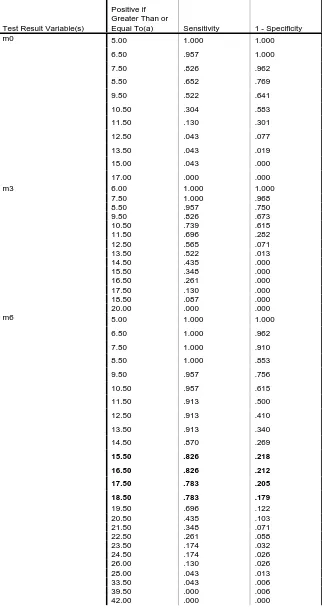
The ROC curve for MELD score at 3 months is 0.73 at MELD score 10.5
Table 5: Coordinates of the Curve for MELD score
Test Result Variable(s)
Positive if Greater Than or
Equal To(a) Sensitivity 1 - Specificity
m0 5.00 1.000 1.000
6.50 .957 1.000
7.50 .826 .962
8.50 .652 .769
9.50 .522 .641
10.50 .304 .583
11.50 .130 .301
12.50 .043 .077
13.50 .043 .019
15.00 .043 .000
17.00 .000 .000
m3 6.00 1.000 1.000
7.50 1.000 .968
8.50 .957 .750
9.50 .826 .673
10.50 .739 .615
11.50 .696 .282
12.50 .565 .071
13.50 .522 .013
14.50 .435 .000
15.50 .348 .000
16.50 .261 .000
17.50 .130 .000
18.50 .087 .000
20.00 .000 .000
m6 5.00 1.000 1.000
6.50 1.000 .962
7.50 1.000 .910
8.50 1.000 .853
9.50 .957 .756
10.50 .957 .615
11.50 .913 .500
12.50 .913 .410
13.50 .913 .340
14.50 .870 .269
15.50 .826 .218
16.50 .826 .212
17.50 .783 .205
18.50 .783 .179
19.50 .696 .122
20.50 .435 .103
21.50 .348 .071
22.50 .261 .058
23.50 .174 .032
24.50 .174 .026
26.00 .130 .026
28.00 .043 .013
33.50 .043 .006
Comparison of the Area under Curve (AUC) at 3- and 6-Month between
MELD and CTP Score.
The area under ROC of the CTP and MELD score at 3 months (0.73 vs.
0.73) and at 6 months (0.73 vs. 0.82).
A cut off point of 8.5 CTP score has been found optimal to predict
sensitivity of 73.9% and specificity of 79.5%.
A cut off point of 15.5 for the MELD score has been found optimal to
predict Sensitivity of 82.6% and specificity of 78%.
However, when the performance of the two scores was compared at 3 and 6
Comparative Analysis of CTP and MELD scores between the Survivors and
Non survivors.
MELD score
50 45 40 35 30 25 20 15 10 5 0
CT
P
s
c
or
e
13
12
11
10
9
8
7
6
group
Died
Alive
When CTP score more than 10 and MELD score more than 15 increase the
risk of survival for patients on waiting list. These patients have benefit from
DISCUSSION
Child Pugh score is the commonly used prognostic model to predict the
survival in cirrhotic patients and for organ allocation. The disadvantage of
using child score is due to inclusion of subjective parameters and variation
in the lab values. Whereas in MELD score, the parameters used are of the
objective type and better in identifying increasing death risk. The results of
various studies and present study which compares the CTP and MELD score
Table 6. Predictive value of CTP and MELD Score for Survival in Patients
with Chronic Liver Disease.
Reference Year Study
population
Patients End point C stat
CTP
C stat
MELD
Angermayr et al 2002 Chronic liver
disease
475 3 month 0.70 0.72
Botta F et al 2003 Cirrhosis 1291 1 year
mortality
0.69 0.67
Wiesner RH et al. 2003 Cirrhosis 3437 3 month
mortality
0.76 0.83
Giannini et al 2004 Chronic liver
disease
145 3 months 0.75 0.95
Daniel Gotthardt
et al
2009 Cirrhosis 268 2 years 0.73 0.68
Present study 2009 Cirrhosis 196 6 month
mortality
0.73 0.82
Angermayr et al.,[33] analysed retrospectively the largest series (n = 475) of
cirrhotics who had elective TIPS placement. In multivariate analysis, MELD
was the single independent predictor for both overall and 3-month survival.
1-year survival was not significantly different, compared with the CTP
(c-statistics for 3-month survival: 0.72 vs. 0.70).
Botta et al [6]. evaluated the short- and medium-term prognosis in a
European series of 129 cirrhotics followed for at least 1 year, comparing the
MELD and CTP scores. All patients had monoethylglycinexylidide (MEGX)
test. They recorded 12 deaths within 6 months and 31 within 1 year of
follow-up. MELD score showed significant correlation with both MEGX (r
= 0.542, P < 0.0001) and CTP (r = 0.817, P < 0.0001). The c-statistics for
CTP, MELD and MEGX were similar for 6-month (0.82, 0.79 and 0.82,
respectively) and 12-month survival (0.69, 0.67 and 0.68, respectively).
Wiesner RH et al [52] ,in their prospective study, MELD score was applied to estimate 3-month mortality to 3437 adult liver transplant candidates with
chronic liver disease between November 1999 and December 2001. In this
study cohort with chronic liver disease, 412 (12%) died during the 3-month
follow-up period. Waiting list mortality increased directly in proportion to
the listing MELD score. Patients having a MELD score <9 experienced a
1.9% mortality, whereas patients having a MELD score ≥40 had a mortality
rate of 71.3%. Using the c-statistic with 3-month mortality as the end point,
MELD score was 0.83 compared with 0.76 for the Child-Turcotte-Pugh
(CTP) score (P < 0.001).
Giannini et al [53] evaluated the predictive values of MELD and CTP scores
for 3-month mortality in 145 European cirrhotic patients. Comparison of the
c-statistics for CTP and MELD scores, showed that the MELD score was
significantly better than the CTP score (0.95 vs. 0.75) .
Daniel Gotthardt et al [54] in 2009 studied 268 consecutive patients listed for single-organ liver transplantation for non fulminant liver disease between
2003 and 2005. Comparing the predictive abilities of CTP and MELD
scores, the best discrimination between patients still alive on the waiting list
and patients who died on or were removed from the waiting list was
achieved at a CTP score of ≥9 and a MELD score of ≥14.4. The sensitivity
and specificity to identify mortality or severe deterioration for CTP was
69.0% and 70.5%, respectively and for MELD, it was 62.1% and 72.7%
respectively. This result was supported by the AUC analysis showing a
strong trend for superiority of CTP over MELD scores (AUROC 0.73 and
0.68, resp.; p = 0.091).
Botta F et al., and Daniel Gotthardt et al compared CTP and MELD shows
study by Angermayr et al, Wiesner RH et al, and Giannini et shows MELD
score is good in predicting survival over CTP score .
In the Present study, CTP and MELD scores had almost identical
discriminative ability for 3 month (0.73 vs. 0.73) survival, but MELD score
was better in predicting 6 month( 0.82 vs. 0.73) survival compared with CTP
score. In this Present study MELD score is good in predicting survival over
CTP score which is supported by the above studies.
Analyzing the data, it is evident that MELD is superior to the CTP scoring
system in predicting the survival in patients waiting for Liver
transplantation.
Possibly, the most important study limitations were the relatively small
sample size and the major drawbacks of the MELD score related to wide
variability of laboratory parameters such as serum creatinine and bilirubin.
The clinical scenario of patients with early to late stage cirrhosis may vary
widely, appropriate modifications and fine tuning of MELD are necessary in
determining the ranking status of patients on the waiting list, in order to
SUMMARY
The study was done in 201 patients with end stage liver disease who were
waiting for liver transplantation. Five patients underwent Liver
transplantation during observational period and were excluded from the
study. The remaining 196 patients were taken in to the study. This was
undertaken to assess the predictor of survival at 3 month and 6 month period
on waiting list.
A detailed history elicited as per proforma enclosed and through
examination done. The baseline investigation which includes Hemogram,
blood sugar, Serum Creatinine, Liver function test and Prothrombin Time
(INR) were done .The Baseline, 3 month and 6 month CTP and MELD
scores were calculated. The mean age of the study population was 45.9 years
(18-65). Of the 196 patients, 150 were male and 46 were female. 41.8%of
patients suffered from alcoholic liver disease and 23.4% from virus
hepatitis-induced cirrhosis.
Other etiologies accounted for 39.7%. The Mean CTP score at baseline, 3
months and 6 months was 7.4, 7.39 and 7.88 respectively for patients in the
waiting list and 7.63, 8.9 and 9.48 respectively for patients who died on
The Mean MELD score at baseline, 3 months and 6 months was 10.35,
10.37 and 12.99 respectively for patients in the waiting list and 10.8, 17.25
and 20.57 respectively for patients who died on waiting.
This study shows CTP and MELD scores had almost identical discriminative
ability for 3 month (0.73 vs. 0.73) survival, but MELD score was better in
predicting 6 month( 0.82 vs. 0.73) survival compared with CTP score.
Thus, there is good evidence to support the fact that MELD is superior to the
CTP scoring system in predicting the survival in patients waiting for Liver
transplantation.
Child-Pugh classification has been a reference for more than 30 years for
assessing the prognosis of cirrhosis. MELD score comes as the most serious
challenger for replacing Child-Pugh score and overcoming its limitations.
The principal advantages of MELD score are that
1. Variables selected based on statistical analysis rather than clinical
judgment.
2. Variables are objective and unlikely to be influenced by external
factors.
3. Eachvariable is weighted according its proper influence on prognosis.
In listed patients for liver transplantation, the CTP score more than 10 and
prioritized in the list for Liver transplantation to achieve maximum benefit
of transplantation. However to overcome the pitfalls of MELD scoring
system, modification can be done to include other clinical and biochemical
CONCLUSION
The present study highlights the following,
• The prognostication based on Child Pugh and MELD scores had
almost identical discriminative ability for predicting 3Month (0.73 vs.
0.73) survival in patients on Transplant Waiting list.
• The MELD score was better in predicting 6 month (0.82 vs. 0.73)
survival when compared with CTP score.
• A cut off point of 8.5 CTP score has been found optimal to predict
sensitivity of 73.9% and specificity of 79.5%.
• A cut off point of 15.5 for the MELD score has been found optimal to
predict Sensitivity of 82.6% and specificity of 78%.
In the setting of Liver transplant, the MELD may score better over the CTP
BIBLIOGRAPHY
1. Calabresi G, Bobbit P: Tragic choices the conflicts society confronts
in the allocation of tragically scarce resources. New York, WW
Norton, 1978.
2. Kamath PS, Wiesner RH, MalinchocM, et al. A model to predict
survival in patients with end-stage liver disease. Hepatology. 2001;
33:464–470
3. Malinchoc M, Kamath PS, Gordon FD, et al. A model to predict poor
survival in patients undergoing transjugular intrahepatic portosystemic
shunts. Hepatology. 2000; 31:864–871.
4. Freeman RB, Wiesner RH, Edwards E, et al. Results of the first year
of the new liver allocation plan. Liver Transplant. 2004;10:7–15.
5. Degre D, Bourgeois N, Boon N, et al. Aminopyrine breath test
compared to the MELD and Child-Pugh scores for predicting
mortality among cirrhotic patients awaiting liver transplantation.
Transplant Int. 2004;17:31–38.
6. Botta F, Giannini E, Romagnoli P, et al. MELD scoring system is
correlated with residual liver function: a European study. Gut.
2003;52:134–139.
7. The U.S. Scientific Registry of Transplant Recipients and The Organ
Procurement and Transplantation Network. Transplant Data
1988-1996.
8. Child CG, Turcotte JG. Surgery and portal hypertension. In: Child
CG, editor. The liver and portal hypertension. Philadelphia: W. B.
Saunders Co., 1964; 50.
9. Pugh RN, Murray-Lyon IM, Dawson JL, Pietroni MC, Williams R.
Transection of the oesophagus for bleeding oesophageal varices. Br J
Surg 1973;60:646–649.
10. Fleck A, Raines G, Hawker F, Trotter J, Wallace PI, Ledingham IM,
et al. Increased vascular permeability: a major cause of
hypoalbuminaemia in disease and injury. Lancet 1985;1:781–784.
11. Henriksen JH, Parving HH, Christiansen L, Winkler K, Lassen NA.
Increased transvascular escape rate of albumin during experimental
portal and hepatic venous hypertension in the pig. Relation to
findings in patients with cirrhosis of the liver. Scand J Clin Lab Invest
1981;41: 289–299.
13. Plessier A, Denninger MH, Consigny Y, Pessione F, Francoz C,
Durand F, et al. Coagulation disorders in patients with cirrhosis and
severe sepsis. Liver Int 2003;23:440–448.
14. Kunze K. Metabolic encephalopathies. J Neurol 2002;249: 1150–
1159.
15. Fernandez-Esparrach G, Sanchez-Fueyo A, Gines P, Uriz J, Quinto
L, Ventura PJ, et al. A prognostic model for predicting survival in
cirrhosis with ascites. J Hepatol 2001;34:46–52.
16. Merkel C, Bolognesi M, Sacerdoti D, Bombonato G, Bellini B,
Bighin R, et al. The hemodynamic response to medical treatment of
portal hypertension as a predictor of clinical effectiveness in the
primary prophylaxis of variceal bleeding in cirrhosis. Hepatology
2000;32:930–934.
17. Hartmann IJ, Groeneweg M, Quero JC, Beijeman SJ, de Man RA,
Hop WC, et al. The prognostic significance of subclinical hepatic
encephalopathy. Am J Gastroenterol 2000;95:2029–2034.
18. Barbara L, Benzi G, Gaiani S, Fusconi F, Zironi G, Siringo S, et al.
Natural history of small untreated hepatocellular carcinoma in
cirrhosis: a multivariate analysis of prognostic factors of tumor
19. Mansour A, Watson W, Shayani V, Pickleman J. Abdominal
operations in patients with cirrhosis: still a major surgical challenge.
Surgery 1997;122:730–735 [discussion 735–736].
20. Gluud C, Henriksen JH, Nielsen G. Prognostic indicators in alcoholic
cirrhotic men. Hepatology 1988;8:222–227.
21. Planas R, Balleste B, Alvarez MA, Rivera M, Montoliu S, Galeras
JA,et al.Natural history of decompensated hepatitis C virus-related
cirrhosis. A study of 200 patients. J Hepatol 2004;40:823–830.
22. Shetty K, Rybicki L, Carey WD. The Child–Pugh classification as a
prognostic indicator for survival in primary sclerosing cholangitis.
Hepatology 1997;25:1049–1053.
23. van Dam GM, Gips CH, Reisman Y, Maas KW, Purmer IM,
Huizenga JR, et al. Major clinical events, signs and severity
assessment scores related to actual survival in patients who died from
primary biliary cirrhosis. A long-term historical cohort study.
Hepatogastroenterology 1999;46:108–115.
24. Zeitoun G, Escolano S, Hadengue A, Azar N, El Younsi M, Mallet A,
et al. Outcome of Budd–Chiari syndrome: a multivariate analysis of
factors related to survival including surgical portosystemic shunting.
25. Testa R, Valente U, Risso D, Caglieris S, Giannini E, Fasoli A, et al.
Can the MEGX test and serum bile acids improve the prognostic
ability of Child–Pugh’s score in liver cirrhosis? Eur J Gastroenterol
Hepatol 1999;11:559–563.
26. Merkel C, Bolognesi M, Bellon S, Bianco S, Honisch B, Lampe H, et
al. Aminopyrine breath test in the prognostic evaluation of patients
with cirrhosis. Gut 1992;33:836–842.
27. Albers I, Hartmann H, Bircher J, Creutzfeldt W. Superiority of the
Child–Pugh classification to quantitative liver function tests for
assessing prognosis of liver cirrhosis. Scand J Gastroenterol 1989;24:
269–276.
28. Merkel C, Bolognesi M, Finucci GF, Angeli P, Caregaro L, Rondana
M, et al. Indocyanine green intrinsic hepatic clearance as a prognostic
index of survival in patients with cirrhosis. J Hepatol 1989;9:16–22.
29. Merli M, Riggio O, Dally L. Does malnutrition affect survival in
cirrhosis? PINC (Policentrica Italiana Nutrizione Cirrosi) Hepatology
1996;23:1041–1046.
30. Johnson P, Bruix J. Hepatocellular carcinoma and the art of
31. Friedman LS. The risk of surgery in patients with liver disease.
Hepatology 1999;29:1617–1623.
32. Gines P, Quintero E, Arroyo V, Teres J, Bruguera M, Rimola A, et al.
Compensated cirrhosis: natural history and prognostic factors.
Hepatology 1987;7:122–128.
33. Angermayr B, Cejna M, Karnel F, Gschwantler M, Koenig F, Pidlich
J, et al. Child–Pugh versus MELD score in predicting survival in
patients undergoing transjugular intrahepatic portosystemic shunt. Gut
2003;52:879–885.
34. Said A, Williams J, Holden J, Remington P, Gangnon R, Musat A,et
al. Model for end stage liver disease score predicts mortality across a
broad spectrum of liver disease. J Hepatol 2004;40:897–903.
35. Longheval G, Vereerstraeten P, Thiry P, Delhaye M, le Moine O,
Deviere J, et al. Predictive models of short- and long-term survival in
patients with nonbiliary cirrhosis. Liver Transpl 2003;9:260–267.
36. Malinchoc M, Kamath PS, Gordon FD, Peine CJ, Rank J, ter Borg
PC.A model to predict poor survival in patients undergoing
transjugular intrahepatic portosystemic shunts. Hepatology
37. Christensen E. Prognostic models in chronic liver disease: validity,
usefulness and future role. J Hepatol 1997;26:1414–1424.
38. Salerno F, Borroni G, Moser P, Sangiovanni A, Almasio P,Budillon
G, et al. Prognostic value of the galactose test in predicting survival of
patients with cirrhosis evaluated for liver transplantation. A
prospective multicenter Italian study. AISF Group for the Study of
Liver Transplantation. Associazione Italiana per lo Studio del Fegato.
J Hepatol 1996;25:474–480.
39. Zoli M, Iervese T, Merkel C, Bianchi G, Magalotti D, Marchesini
G,et al. Prognostic significance of portal hemodynamics in patients
with compensated cirrhosis. J Hepatol 1993;17:56–61.
40. Pessione F, Ramond MJ, Peters L, Pham BN, Batel P, Rueff B, et
al.Five-year survival predictive factors in patients with excessive
alcohol intake and cirrhosis. Effect of alcoholic hepatitis, smoking and
abstinence. Liver Int 2003;23:45–53.
41. Christensen E. Prognostic models including the Child–Pugh, MELD
and Mayo risk scores-where are we and where should we go? J
42. Freeman Jr RB, Edwards EB. Liver transplant waiting time does not
correlate with waiting list mortality: implications for liver allocation
policy. Liver Transpl 2000;6:543–552.
43. Schepke M, Roth F, Fimmers R, Brensing KA, Sudhop T, Schild HH,
et al. Comparison of MELD, Child–Pugh, and Emory model for the
prediction of survival in patients undergoing transjugular intrahepatic
portosystemic shunting. Am J Gastroenterol 2003;98:1167–1174.
44. Kremers WK, van IM, Kim WR, Freeman RB, Harper AM, Kamath
PS, et al. MELD score as a predictor of pretransplant and
posttransplant survival in OPTN/UNOS status 1 patients. Hepatology
2004;39:764–769.
45. Freeman RB, Wiesner RH, Edwards E, Harper A, Merion R, Wolfe
R.Results of the first year of the new liver allocation plan. Liver
Transpl 2004;10:7–15.
46. Sharma P, Balan V, Hernandez JL, Harper AM, Edwards EB,
Rodriguez-Luna H, et al. Liver transplantation for hepatocellular
carcinoma: the MELD impact. Liver Transpl 2004;10:36–41.
47. Hayashi PH, Trotter JF, Forman L, Kugelmas M, Steinberg T, Russ
on cadveric liver allocation in the era of MELD. Liver Transpl
2004;10:2–48.
48. Durand F, Regimbeau JM, Belghiti J, Sauvanet A, Vilgrain V, Terris
B, et al. Assessment of the benefits and risks of percutaneous biopsy
before surgical resection of hepatocellular carcinoma. J Hepatol
2001;35:254–258.
49. Onaca NN, Levy MF, Sanchez EQ, Chinnakotla S, Fasola
CG,Thomas MJ, et al. A correlation between the pretransplantation
MELD score and mortality in the first two years after liver
transplantation. Liver Transpl 2003;9:117–123.
50. Desai NM, Mange KC, Crawford MD, Abt PL, Frank AM,
Markmann JW, et al. Predicting outcome after liver transplantation:
utility of the model for end-stage liver disease and a newly derived
discrimination function. Transplantation 2004;77:99–106.
51. Jacob M, Copley LP, Lewsey JD, Gimson A, Toogood GJ, Rela M, et
al. MELD Pretransplant score and post liver transplantation survival
in the UK and Ireland. Liver Transpl 2004;10:903–907.
52. Wiesner R, Edwards E, Freeman R, Harper A, Kim R, Kamath P, et
al. Model for end-stage liver disease (MELD) and allocation of donor
53. Giannini E, Botta F, Fumagalli A, et al. Can inclusion of serum
creatinine values improve the Child-Turcotte-Pugh score and
challenge the prognostic yield of the model for end-stage liver disease
score in the short-term prognostic assessment of cirrhotic patients?
Liver Int 2004; 24: 465-70.
54. Daniel Gotthardt etal, Limitations of the MELD score in predicting
mortality or need for removal from waiting list in patients awaiting