MODELING THE CD4 DECLINE IN HIV WITH LOW COST PREDICTORS FOR EFFECTIVE HIV MANAGEMENT IN
RESOURCE POOR SETTINGS Dissertation submitted to
T
he Tamil Nadu Dr. M. G. R. Medical
University,
Chennai
in partial fulfillment of the award of degree of
MASTER OF PHARMACY
(Pharmaceutical Biotechnology)
Submitted by
K.PUSHPAVALLI
Under the guidance of Dr.D.C.SUNDERAVELANAssistant Professor,
Department of Pharmaceutical Biotechnology
MARCH – 2008
COLLEGE OF PHARMACY
SRI RAMAKRISHNA INSTITUTE OF PARAMEDICAL SCIENCES
CERTIFICATE
This is to certify that the dissertation entitled ‘MODELING THE CD4 DECLINE IN HIV WITH LOW COST PREDICTORS FOR EFFECTIVE HIV MANAGEMENT IN RESOURCE POOR SETTINGS' being submitted to The Tamil Nadu Dr. M.G.R. Medical University, Chennai in partial fulfillment of the Master of Pharmacy programme in Pharmaceutical Biotechnology, carried out by Miss K. PUSHPAVALLI in the Department of Pharmaceutical Biotechnology, College of Pharmacy, SRIPMS, Coimbatore, under my
direct guidance and supervision to my fullest satisfaction.
Dr.D.C.Sunderavelan, M.Pharm., Ph.D.,
Assistant Professor,
Department of Pharmaceutical Biotechnology,
College of Pharmacy,
SRIPMS,
Coimbatore –44.
Place: Coimbatore
CERTIFICATE
This is to certify that the dissertation entitled ‘MODELING THE CD4 DECLINE IN HIV WITH LOW COST PREDICTORS FOR EFFECTIVE HIV MANAGEMENT IN RESOURCE POOR SETTINGS' was carried out by Miss K.PUSHPAVALLI, in the Department of Pharmaceutical Biotechnology, College of Pharmacy,
Sri Ramakrishna Institute of Paramedical Sciences, Coimbatore, which
is affiliated to The TamilNadu Dr. M. G. R. Medical University, Chennai, under supervision and direct guidance of ,
Dr.D.C.Sunderavelan M.Pharm., Ph.D., Department of
Pharmaceutical Biotechnology, College of Pharmacy, SRIPMS,
Coimbatore – 44.
Prof.S.KRISHNAN, M. Pharm., (PhD.,)
Professor & Head,
Department of Pharmaceutical Biotechnology,
College of Pharmacy,
Place: Coimbatore SRIPMS,
Date: Coimbatore – 44.
CERTIFICATE
This is to certify that the dissertation entitled “MODELING THE CD4 DECLINE IN HIV WITH LOW COST PREDICTORS FOR EFFECTIVE HIV MANAGEMENT IN RESOURCE POOR SETTINGS’ was carried out by Miss K.PUSHPAVALLI, in the Department of Pharmaceutical Biotechnology, College of Pharmacy,
Sri Ramakrishna Institute of Paramedical Sciences, Coimbatore, which
is affiliated to The Tamil Nadu Dr. M. G. R. Medical University, Chennai, under supervision and direct guidance of,
Dr.D.C.Sunderavelan, M.Pharm., Ph.D., Department of
Pharmacology, College of Pharmacy, SRIPMS, Coimbatore – 44.
Dr. T. K. RAVI, M. Pharm., Ph. D., FAGE., Principal,
College of Pharmacy,
Place : Coimbatore SRIPMS,
ACKNOWLEDGEMENT
It was a matter of great pride that I was fortunate enough to have association with great personalities. I can remember their names only with profound gratitude and satiety.
“No work is accomplished, with optimum refinement; without the support and indulgence of eminent personalities”
Of all my facilitators, it was the magnanimity and support of my teacher and guide Dr.D.C Sunderavelan M.Pharm., Ph.D. Professor and Head of Department of Pharmaceutical Biotechnology, who was unconditional in encouraging throughout my project work.
My grateful thanks to Dr. T. K. Ravi. M.Pharm., Ph.D., FAGE, Principal, who wholeheartedly supported me in my endeavor to complete the project in time.
I sincerely thank Dr. Sumita Singh, Ph.D., Mr.Krishnan, M.Pharm, Professor, Department of Pharmaceutical Biotechnology for their valuable help and advice during my project work.
Above all I thank my parents, their selfless support, encouragement and care, which has enabled me to reach this level in life.
I owe my special thanks and gratitude to Dean Dr. Shanmugasundram, .Sri Ramakrishna Hospital for providing permission to utilize the hospital facilities.
CONTENTS
1. INTRODUCTION 1
2.1 HIV – I 1
2.2 HIV and Genetic Variation 2
2.3 Pathogenesis 3
2.4 Immunology 4
2.5 HIV Replication Cycle 7
2.6 Natural Progression of HIV – 1 15
2.7 Classification of HIV Diseases 19
2.8 Epidemiology 24
2.9 Treatment 25
2.10 Laboratory Monitoring of HIV 30
2. OBJECTIVE 38
3. MATERIALS AND METHODS 39
4. RESULTS 47
4.1 LITERATURE DATA ANALYSIS
47
4.2 EXISTING DATA ANALYSIS
70
4.3 PREDICTION
90
5. DISCUSSION 94
6. SUMMARY AND CONCLUSION 98
7. REFERENCE 99
INTRODUCTION
Human immunodeficiency virus type1 is a primary cause of AIDS, which is a slow and degenerative disease of human immune system. The pathogenesis of HIV-1 is complex and characterized by interplay of both host and viral factors. Most researchers believe that HIV originated in sub-Saharan Africa during 20th century1 and is now a pandemic, with an estimated 33.2 million people now living with the disease worldwide. As of January 2006, the United Nations Programme on HIV/AIDS (UNAIDS) and World Health Organization (WHO) estimated that AIDS has killed more than 25 million people since it was first recognized on June 5, 19812, making it one of the most destructive epidemics in recorded history2.
2.1 HIV-1
HIV-1 is a lentivirus belonging to the retrovirus family. The virus is diploid and contains two plus-stranded RNA copies of its genome. The approximately 9 kb RNA genome encodes at least 9 proteins, Gag, Pol, Env, Tat, Rev, Nef, Vif, Vpu and Vpr3
2.2 HIV and genetic variation5
Virus type Sub type Predominant area
HIV-1 M A Africa, Eastern Europe
B Europe,North
America,Austrilia,Thaila nd
C Southern Africa, India
D East and Central Africa
E Thailand
O\N West Africa
2.3 Pathogenesis
Fig:1
2.4 Immunology
Individuals infected with HIV show both cellular and humoral (antibody) immune responses to the virus, but these responses are unable to prevent the ultimate progression of disease in the great majority of infected individuals. Cellular responses are mediated by CTLs (CD8 cells) and helper T lymphocytes (CD4 cells) 8.
Fig:2 Viral Pathogenesis and immune response9
Infection
Viral
dissemination to lymphoid tissue
Viral dissemination
via blood
Viral
dissemination to CNS tissue
Trapping of virus
in follicular
dendritic cell network
Immune
Sequestration of virus in lymph nodes
Virus actively replicating in lymphoid tissue, CD4 cells and follicular
dendritic cells
Disruption of follicular
dendritic cell network, with increasing
‘escape of virus’
Increased
demands on immune
response
Destruction of
the immune
replication
Increased risk of infections and tumors
Appearance of clinical
symptoms
2.5 HIV Replication cycle10, 11, 12
Summary of HIV life cycle
1. Free virus enters into blood stream of human via various transmissions, and then recognizes
the site of infection and binds to it.
2. Fused with cell membrane and penetrate to cytoplasm
3. Internalization and uncoating supported by various host factors
4. Single standard viral RNA transcribed into double standard DNA by reverse transcriptase
5. Integrate their double standard DNA into host genome influenced by IN and VPR
6. Proviral formation
7. Proviral transcription by TAT
8. RNA of virus processed by REV and transported into cytoplasm
9. Formation of unspliced product of genomic RNA influenced by ENV.
10. Viral translation
11. Viral membrane protein transported to cell membrane
12. Assembling of viral proteins in immature virus
14. Maturation of virus by protease enzyme
Each step in replication cycle is equally important to make an infective virion and thus each step acts as novel target for antiviral strategies .Focusing the molecular strategies which delays the progression or block replication of HIV-1 infected individual’s gains paramount importance.
Table:1 Molecular strategies against targets in HIV
replication cycle3, 11, 13, 14, 15
Targets Strategy against
target
Drugs
1 1. chemokine ligand
mediates receptor blokade
RANTES
1.AOP
2.PSC
2.Antisence RNA VRX4-96
3.Ribozymes
-4.SiRNA(0.5 Kb
dsRNA CD4 domain of SU)
-5.Chimeric \fusion protein
PRO 542
6.Intracellular antibody (sFUS)
Cynovirin-11KDa
cyano bacteria
7.Monoclonal antibody
Mab 12G5
Anti ECL 2
TNX-355
2
A.Receptor blocking
1.chemicals
2.Mab
B.GP 120 inhibition
AMD 3100
AK 602
AMD 070
INCB 9471
Maraviroc *
Enfuvirtide *
PRO 140
HGS 0004
BMS 378806
4 1.NRTI Lamivudine *
Abacavir *
Stavudine *
Didanosine *
Emtricitabine *
Tenofovir *
Apricitabine
Amdoxovir
Dioxolan ethyminedine
Elvucitabine
KPUI 461
MIV 210
RAcivir
2.NNRTI Delavirdine *
Efavirenz *
Nevirapine *
(+)calanolide
BILR 355 B
Etravirine
Rilpivirine
3.Ribozymes
-4.RNA decoy tRNA 3 Lys mutant
5.Anti RT dimerization Small peptide
15-19 AA
6.RNA aptamer
-7.Anti sense
-5
1.Irreversible noncompetitive enzyme inhibition
Dicaffeoyl quinic acids
2.other chemicals 2,4 dioxo butanoic
acid analog
Reltegravir
GSK 364735
Elvitegravir
3.Dinudotide Pdc pISodv
4.sFU
-7.
1.Antisense RNA HGTV43
2.RNA decoys TAR decoys
3.Si RNA Tat SiRNA Vs NF bp
65
4.Transdominant negative protein
Tat mutant
5.Ribozymes RR Z2
6.Fusion protein
-7.Mab BI-201
8.chemical agent
Benzodiazepine oligo pyrrole hybrids
Aromatic polyamide carrying halogen
1.TAPB-Br
2.TAPP-Br
8. 1.TNP Rev M10
Rev 38
2.RNA decoys
PRE decoys
C41 nucleotide
Rre sciIAB
RNA decoy
3.SFU NES specific SFU
4.Antisense Synthetic
phosphorothiosate oligodeoxy nucleotide
5.RNA aptamer
-6.Antibiotic
Leptomycin B
NUP 214\CAN
Delte-CAN
7.Fusion protein NSIRM –Rev mutant
8.intercalating dye Pyronin Y
Diphenyl furan
9. 1.Antisense Anti sense to U3 5'
LTR gag –Env
Env region
-3.sFU SFU 105
4.Anti intracellur
protein
Poly arginine peptide
12.
1.Anti sense RNA 1.43kb to
psi-gag region
2.Ribozymes
-3.RNA decoys
-13
1.Nef TNPs
-2.Anti sense
-3.Ribozymes
-14. 1.Gag TNP
-2.Anti sense
-3.Protease inhibitor Saquinavir *
Indinavir *
Ritonavir *
Nelfinavir *
Amprenavir *
Atazanavir *
Lopinavir *
Atazanavir *
Daruanvir *
Tipnavir *
Darunavir *
Fosampnonavir *
PPL-100
4.Maturation inhibitor Bevirrimat *
2.6 Natural progression of HIV-1
Natural history of infection encompasses an acute phase that lasts months, followed by an early /clinically latent phase that typically 3-10 years, and ultimately by the immune collapse characterized by AIDS7.
Four stages of HIV infection can be described9
i) Primary infection: Infection with HIV results in rapid proliferation of the virus in blood and lymph nodes. The infected person may experience a seroconversion illness, which usually resolves within weeks. The CD4 cell count declines rapidly before virus is controlled by the immune system, whereupon the count returns to near normal.
ii) Early immune deficiency (CD4 cell count>500/ML):During this phase the immune system has controlled the virus, which is largely restricted to lymphoid tissue. In this phase, damage inflicted by the virus is limited to the regenerative capacity of the immune system and people with HIV are usually without symptoms.
iv) Advance Immune Deficiency (CD4 cell count <200/ML): The virus which proliferates throughout the body overcomes the immune system. Major opportunistic infections and malignancies become increasingly common and require increasing medical intervention
Table:2 Natural History of HIV Infection in adult
EXPOSURE TO HIV INFECTION
Seroconversi on illness
Asymptomatic period
Subtle
Symptoms and
Signs of
Immunodeficien cy
ANTIBODY TITRE AND INFECTIVITY Not Detectable (Window Period) Highly Infectious Detectable antibodies Infectious Detectable antibodies Infectious Antib odies may or may not be detec table Highl y Infect ious
TIME PERIOD 12 Weeks 3-5 years 2-3 years 1-2
years
STAGE OF HIV DISEASE Primary Infection (CD4 cell count near Early Immunodeficien cy
(CD4 cell count >500
Intermediate
immunodeficien cy
(CD4 cell count
Term inal illnes s
normal) cells/µ l) <500
>200 cells /µl
cell coun t <200
cell /
µl)
2.7 Classification of HIV Disease
HIV damages the immune system, leaving the infected person vulnerable to a variety of infections (called "opportunistic" infections to indicate that they arise in the setting of immune impairment). The effect of HIV on the immune system is monitored by measuring the CD4 (helper) lymphocyte count in the blood. A normal CD4 count (between approximately 600 and 1,200 cells/µL) indicates that the immune system has not undergone sufficient damage to put the individual at risk for opportunistic illness
CD4+ T-Lymphocyte Categories
The three CD4+ T-lymphocyte categories are defined as follows:
Category 1: greater than or equal to 500 cells/mL
Category 2: 200-499 cells/uL
Category 3: less than 200 cells/uL
Clinical Categories
The clinical categories of HIV infection are defined as follows:
Category A
Asymptomatic HIV infection
Persistent generalized lymphadenopathy
Acute (primary) HIV infection with accompanying illness or history of acute HIV infection
Category B
Bacillary angiomatosis
Candidiasis, oropharyngeal (thrush)
Candidiasis, vulvovaginal; persistent, frequent, or poorly responsive to therapy
Constitutional symptoms, such as fever (38.5 C) or diarrhea lasting greater than 1 month
Hairy leukoplakia, oral
Herpes zoster (shingles), involving at least two distinct episodes or more than one dermatome
Idiopathic thrombocytopenic purpura
Listeriosis
Pelvic inflammatory disease, particularly if complicated by tubo-ovarian abscess
Peripheral neuropathy
Category C
Candidiasis of bronchi, trachea, or lungs
Candidiasis, esophageal
Cervical cancer, invasive *
Coccidioidomycosis, disseminated or extrapulmonary
Cryptococcosis, extra pulmonary
Cryptosporidiosis, chronic intestinal (greater than 1 month's duration)
Cytomegalovirus disease (other than liver, spleen, or nodes)
Encephalopathy, HIV-related
Herpes simplex: chronic ulcer(s) (greater than 1 month's duration); or bronchitis, pneumonitis, or esophagitis
Histoplasmosis, disseminated or extra pulmonary
Isosporiasis, chronic intestinal (greater than 1 month's duration)
Kaposi's sarcoma
Lymphoma, Burkitt's (or equivalent term)
Lymphoma, immunoblastic (or equivalent term)
Lymphoma, primary, of brain
Mycobacterium avium complex or M. kansasii, disseminated or extra pulmonary
Mycobacterium tuberculosis, any site (pulmonary * or extra pulmonary)
Mycobacterium, other species or unidentified species, disseminated or extra pulmonary
Pneumocystis carinii pneumonia
Pneumonia, recurrent *
Progressive multifocal leukoencephalopathy
Salmonella septicemia, recurrent
Wasting syndrome due to HIV
The World Health Organization has developed a clinical staging system for HIV infection. This system relies more heavily on clinical rather than laboratory evaluation, and has been used widely in resource-constrained areas where laboratory testing is not widely available.
WHO STAGING SYSTEM FOR HIV INFECTION AND DISEASE IN ADULTS AND ADOLESCENTS
Clinical Stage I:
Asymptomatic
Persistent generalized lymphadenopathy (PGL)
Performance scale 1: Asymptomatic, normal activity
Clinical Stage II:
Weight loss, < 10% of body weight
Minor mucocutaneous manifestations (seborrheic dermatitis, prurigo, fungal nail
infections, recurrent oral ulcerations, angular cheilitis)
Herpes Zoster, within the last 5 years
Recurrent upper respiratory tract infections (i.e., bacterial sinusitis) and/or
Clinical Stage III:
Weight loss, > 10% of body weight
Unexplained chronic diarrhoea, > 1 month
Unexplained prolonged fever (intermittent or constant), > 1 month
Oral candidiasis (thrush)
Oral hairy leukoplakia.
Pulmonary tuberculosis, within the past year
Severe bacterial infections (i.e., pneumonia, pyomyositis) and/or performance scale
3: bed-ridden, < 50% of the day during the last month
Clinical Stage IV:
HIV wasting syndrome, as defined by CDC
Pneumocystis carinii pneumonia
Toxoplasmosis of the brain
Cryptosporidiosis with diarrhoea, > 1 month
Cytomegalovirus (CMV) disease of an organ other than liver, spleen or lymph nodes
Herpes simplex virus (HSV) infection, mucocutaneous > 1 month, or visceral any
du ration
Progressive multifocal leukoencephalopathy (PML)
Any disseminated endemic mycosis (i.e. histoplasmosis, coccidioidomycosis)
Candidiasis of the oesophagus, trachea, bronchi or lungs
Atypical mycobacteriosis, disseminated
Non-typhoid Salmonella septicaemia
Extrapulmonary tuberculosis
Lymphoma
Kaposi’s sarcoma (KS)
HIV encephalopathy, as defined by CDC
And/or Performance scale 4: bed-ridden, > 50% of the day during the last month
2.8 Epidemiology
There are currently approximately 33.2 million persons living with HIV\AIDS. Among them adult prevalence is 0.8%. As per 2007 WHO report, adult and children deaths due to AIDS are 2.1% million, and adult and children newly infected with HIV is 2.5 million.
In India, the adult prevalence % is 0.36; total prevalence is 0.9%.Total population of HIV in India is 2.5 million at 2007
Adult prevalence % in different states of India is19,
Table:3
State Prevalence %
Andrapradesh, Nagaland, Manipur
1-2%
Karnataka, Maharashtra, West Bengal, Mizoram
0.5-1%
Tamil Nadu 0.2-0.5%
Rest 0-0.2%
Fig:5 HIV population of India in millions
India accounts for 10% of global HIV burden and 65% of that in South and
South East Asia.
2.9 Treatment
Currently, all FDA-approved antiretroviral medications work by inhibiting 1 of 3 steps in the life cycle of HIV:
1. Blocking the reverse transcriptase (RT) enzyme. The RT enzyme is used by the virus to convert its RNA into DNA after the virus enters the cell but before it enters the nucleus. All nucleoside and nucleotide analogues as well as NNRTIs function by interfering with the activity of this enzyme.
0 0.2 1.75 3.5 3.7 3.86 3.97 4.58 5.1 2.5
0 1 2 3 4 5 6
1986 1990 1994 1998 1999 2000 2001 2002 2003 2007 Y e ar s
2. Blocking the protease enzyme. Protease inhibitors, as their name indicates, inhibit the action of the HIV protease, namely, cleaving protein products of the viral structural genes into the functional subunits needed to create new infectious virions.
3. Inhibiting fusion of the viral and host membranes. By attaching itself to the HIV envelope glycoprotein gp41, fusion inhibitors prevent formation of the "hairpin" structure required for fusion of the HIV and host cell membranes, and thus prevent viral entry into the host cell.
These drugs are classified as21,
a – NRTI, b - NNRTI, c – PI, d – FI 2.9.1 Selection of ART
2.9.1.1 Possible HAART combinations
Table:4
No of possibilities Choice of
combinations
1 A
2 2a+b
3 2a+c
4 3a
5 2a+2b
6 A+b+c
7 B+c
8 A+b+c+d
9 c\r alone
10 4a
11 3a+b
Among these,
Current recommendation 2, 3, 4
Not possible category (already trailed) but some cases recommends e.g. failure in 2a+c
5, 6,and 11
Under investigation 7, 8 9, 10
2.9.1.2 Current recommended HAART regimens
Table:5
2.9.2 Initiation of HAART22, 23
Optimal timing of ART initiation for persons with HIV infection is of great clinical and public health importance. There is strong evidence supporting the use of the CD4 T cell count as the major determinant in initiating therapy. The plasma HIV RNA level remains an independent predictor of clinical outcome in patients who do not receive ART and is the best available guide for monitoring the effectiveness of ART.
2.9.2.1 Current guidelines24,25, 26
Current guidelines from the international AIDS society-USA (IAS-USA), DHHS, BHIVA all recommends ART for individuals with symptomatic HIV infection. These established guidelines uniformly recommend initiating ART before the CD4 count is < 200 cells\mm3.
they have clinical AIDS, regardless of CD4 count, When TLC can be assessed, in addition people with WHO stage 2 or stage 3 HIV diseases should be offered treatment when CD4 counts are available, all HIV infected people with less than 200 CD4 cells\mm3 should be offered treatment.
2.9.3 Acute HIV treatment27
Most individuals with acute HIV infection are symptomatic and could be targeted for early therapy. Information on long-term outcomes of treatment for acute HIV infection is limited. Possible benefits of early therapy include: less severe acute disease, lower initial viral "set point" with potential slower disease progression, preservation of immune function, and possible reduction in viral transmission. On the other hand, potential risks include drug toxicities and, if virus is not fully suppressed, drug resistance that limits further treatment options. Based on limited available data, some researches found that, treating HIV during the acute HIV infection stage may boost the immune system and slow the progression of HIV disease.
2.9.4 Survival benefits of HAART30, 31
The time from first diagnosis of AIDS to death has been characterized separately from the incubation time from infection to AIDS as AIDS survival time. Improved median survival of AIDS patients was observed on HAART. In the Multicenter AIDS Cohort Study, the estimated median time from seroconversion to death for a person infected at age 30 was associated with use of combined therapy and increased nearly 2 years.
In another one study, found that median survival time increased from 19 to 30 months among all AIDS patients over age 35 years with a CD4 lymphocyte count less than 100 cells/µl and receiving antiretroviral therapy.
2.10 Laboratory monitoring of HIV
HIV infection is spreading rapidly in India. The infection can only be detected by laboratory tests, as there is a long asymptomatic period when the individual is infectious and can spread disease but has no specific symptoms or signs of disease. The role of the laboratory is very important and it is essential that the highest standards are not only maintained in each laboratory but are also regularly monitored.
parameters also reflect damage to the host caused by HIV infection and indicate pathogenic mechanisms of disease.
2.10.1 Classification of surrogate markers based on disease pathogenesis
In clinical context “surrogate” implies some responsibility e.g. an ability to contribute substantial information about clinical prognosis. A separate system for classifying the stages of surrogate marker evaluation has been proposed by Mildvan et al ,this involves progress in staging from detecting of HIV infection, to relation to prognosis and finally to relevance to therapeutic benefit.
Table:6
I. VIRAL FEATURES
P24 AG ASSAY
HIV-1 RNA LEVEL BY PCR, BDNA, NABA
II immunological
features
Cd7 lymphocyte count
CD4:CD8
CD4%
IL-2R
INF-γ
IL-4
MHC-1R III Immune system
activation
Ig G
Ig A elavation
CD38 expression
2.10.2 Parameters measured in HIV progression and their significance32, 33, 34, 35
Table:7
Parameters Normal
condition
HIV-AIDS Other disease
1.CD4 count in cells\mm3
CD4 marker is exclusively specific
marker in T-cells for HIV particle
Immunological detoriation
-2.CD4:CD8 "
3.CD4% "
4.VL in
copies\pl(positiv e)
- HIV-factors
-5. P24Ag
(positive)
Measures the viral capsid (core) P24 protein,
directly
reflects the amount of antigen
body.
6. C-reactive protein
(negative)
Reflects activation/ production of IL-4
Immunological alteration
Atherosclerosis, cancer, end stage renal disease
7.β2Microglobuli
n in
mg\dl(positive)
Reflects
activation of MHC I K
Cancer, renal
impairment, all immuno deficiency status
8.S neopterin in ng\ml(positive)
Reflects more production of
IFN -γ
TB, Kindney graft rejection, viral, fungal, bacterial infections, aseptic meningoencephalit
is, collegen
vascular disease, malignancies
9.s IL -2R in (positive) u/ml
Reflects more production of IL-2
Cancer
10. S-TNFα2RI in ng/ml(positive)
Reflects moreproducti
on of TNF-α
Cancer
11. S-albumin %g/l(negative)
Decrease their level where
Severe liver
dysfunction on
ARC cocci
impaired liver function
dioidomycosis hepatitis- co-infection
12. ALT,AST (negative)
Reflects liver function
13.Hb(negative)
Reflects anemic condition
Bone marrow depression,
severe anemic condition Neutropenia, malnutrition, malabsorption, myelodysplasia Cytomegaloviral infection, mycobacterium avium complex, crytocococcus,
Histoplasmosis, drug induced toxicity and HIV factor,
Malaria, folate
deficiency, iron deficiency, hook
worm infection, α
thalassaemia, TB 14. Platelet count(negative) Reflects thromobolytic function Thrombocytopen ia purpurae Common for physical destruction
(negative) red blood cell volume and their status
complication
16.
TLC(negative)
Reflects lymphocyte% multiplied with WBC
leucopenia,
lymphopenia
17. BMI (low)
Reflects
alteration in growth factor
Severe weight loss (>10%)
TB, Typhoid,
cholera(chronic) and other amoebic conditions
2.11 Impact of anemia in HIV progression36,37
Anemia is frequently experienced by HIV positive individuals especially women. Prevalence of anemia in asymptomatic period is 30%, and in clinical AIDS is 80-90%. HIV related anemia can involve multiple casual mechanisms, and often several of these are operative in the same patient at the same time. These causal mechanisms include HIV itself, which can induce chronic inflammation, and slow red blood cell production. In addition, drug toxicities, OI, malabsorption, syndromes leading to folate or vitamin B12 deficiency, blood loss, iron deficiency, lymphoma and other AIDS-related malignancies can all cause or contribute to anemia
Fig:6
Anemia has been associated with decreased quality of life and decreased survival, has been shown to be a strong independent predictor of disease progression and death. Even modest (1g\dL) changes in HGB may associate with a significant increased risk of death.
OBJECTIVE OF STUDY
1. To integrate the different ways of HIV classification and to develop a classification model which will be more relevant for resource limited settings.
2. To study the interrelationship between the cheaply available markers, (Hb & TLC) with CD4 and to develop a model for “CD4 decline in HIV” for therapeutic decision making.
3. To derive an algorithm based on HGB and TLC measurement for
guide to initiation Of ART
4. To review the molecular strategies against target in HIV replication cycle
3. MATERIALS AND METHODS
3.1 Instruments Required
(1) Sysmex Kx-21 – Automatic Blood Content
Analyzer.
(2)Flow Cytometer- Becton Dickinson _ CD4 Counter
3.2. Protocol for Complete blood Count
a)Sample:
HIV patients Blood (iv source)
b)Diluation:
20µl blood diluted with 300µl cell pack which contains, HGB/WBC lyse reagent – Stromolyser, cell clean- detergent and diluent by machine itself.
c)Detection:
HGB Detected by photo electric method using 540nm Principle behind it is Cyanomethaemoglobin method.
d)Determination of HGB:
Direct reading from report.
e)Determination of TLC:
Multiply the WBC with lymphocyte % obtained from reading.
3.3. Protocol for CD4 count
a)sample :
Peripheral blood of HIV patients .collect into EDTA coated tubes (367856,Becton and Dickinson).Mix thoroughly with the anti coagulant by gently inverting the tube .about 8-10 mts
b) Cell staining :
Add 20µl of antibody (stand)to 50µl of blood sample gently mix it by vortexer
Incubate the sample in the dark for 15mts
c)Fixation and rbc analysis:
450µl of IX lysis buffer to each sample.vortex it and incubate for 15mts.
Add 25 µl of fluorescent beads to each sample.
d)Calibration of the flow cytometer
e)Detection: - FACS method
f)Determination of CD4 = Gated cell count × Bead
count per test
Gated bead count Test volume
3.4. Limitation and precaution of study
Handling of HIV patients blood is risk for unskilled persons those who are not practiced with laboratory equipments
Modes of exposure to HIV in the laboratory
LAB PROCEDURE METHODS OF TRANSMISSION
Collection of blood
Transfer of specimen
cleaning/washing
Needle stick injury ,Broken specimen container, Blood contamination of hand with skin lesions or breach
Contaminated exterior of the container
Punctural contamination of skin from,
contaminated glass ware
sharps
contaminated work surface
Transport of specimen to distant laboratory
Broken or leaking container
Similiarly all instruments and other equipments that have come into contact with blood are assumed to be potentially contaminated with blood borne pathogens and must be properly handled,cleaned or safely disposed off.
METHODOLOGY
3.5. Data collection
Collection of data from out sources
Data of demographic, general, clinical characteristics and laboratory profile of HIV positive patients in all stages, collected and reviewed from net sources to find out the changes of the marker trend in all stages of HIV and analyzed their symptoms persist in different stages of disease.
Collection of Existing data
Comparison of results obtained from analysis of net sources with experimental work or existing work is essential for conclude the research work. Due to limitation and precaution of handling of HIV patient’s blood, existing work collected for further analysis. Data of 50 HIV +ve patients include general characteristics, clinical profile and lab parameters collected from their records in all departments in 500 bedded multi speciality private tertiary care teaching hospital.
3.6. Data analysis
B. Data analysis
• The data mainly laboratory profile, symptoms of HIV, and other co morbidities, and immunopathology from different sources compared and derived the trend for CD4, VL changes in acute phase, chronic phase and AIDS phase. Also derived the trend for HGB and TLC decline in HIV progression.
• Subgrouped the 3 stages of AIDS into further based upon
changes in marker trend, and symptom. Classified the HIV progression into a new model which represents the integrated form of changes in marker trend, symptoms, CDC classification and WHO classification system.
• Correlation between the all surrogate markers which are recognized as predictors of HIV progression is studied and compared their significance in prediction of HIV in resource poor settings.
• Trend for changes of markers level (CD4 count, VL, HGB and TLC) in HIV infection were derived by regression analysis.
• Analysed the characteristics (Age, group, sex, co morbidity prevalence), clinical profile (frequently observed symptoms) and laboratory profile (HGB, TLC, CD4) of study population
from existing data and classified them into different category based upon their symptoms.
C. Prediction
• Predicted the CD4 for study population by,
Correlation of TLC with CD4 count and HGB level with CD4 count, and found out the significance of combination of these 2 models
• Compared the predicted CD4 with actual CD4 of study population
and find out the significance and outcomes of symptom based
Prediction, HGB based prediction, and TLC based prediction.
RESULTS
4.1 Literature data analysis
A. Natural History of HIV progression
FIG:7
Natural History of HIV infection 0 1 2 3 4 5 6 7 8
1 2 3 4 6 12 24 36 48 60 72 84 96 108 114 120 126 132 138 144
progression in months
V L i n l o g c o p ie s\ m l 0 100 200 300 400 500 600 700 800 C D 4 ce ll s\ m m 3
Viremia level CD4 counts
B. Categories in Natural History of HIV Progression
MONTHS
CATEGORY
CDC
WHO
2 3
0 36 60 72 108 144
I II III IV V VI VII
I II III
CD4
VL
HGB
M/F
TLC
I II III IV
0 5.6 3.3 3.77 3.95 4 4.84 6.8
17/14 15/12 14/11 12/10 10/9 9/8 7/6
1200 550 650 510 430 380 200 101
BMI
CD4%
S neo
β2M
2200 1800 1600 1500 1400 1200 800
22 21 19.5 18 16
30 14 10
6.25 11.6 13.9 16 20 0.2
IL-2R
TNFα
ALBUMIN
C-Rn
0.6 3.5
100 350 900 1200
1.65 2.87 4
42 40 37 35
HGT
C. Changes in Markers trend in Entire progression of HIV
1. Trend of VL level in HIV progression
FIG:8
Viremia level in Natural progression of HIV
3.33.443.47
3.6 3.69 3.77 3.9 3.95 4
4.7 4.74 4.84 4.95 5.4
6.3
6.6 6.7 6.8
y = 0.0223x + 3.0335
R2 = 0.8679
0 0.5 1 1.5 2 2.5 3 3.5 4 4.5 5 5.5 6 6.5 7 7.5 8
0 10 20 30 40 50 60 70 80 90 100 110 120 130 140 150
Prog in m onths
V L i n l o g c o p ie s \m l
3. Trend of changes in CD4 count in HIV Progression
FIG:9
12 0.6 0.35
42 38 35
CD4 decline in progression of HIV 650 625 590 575 550 510 490 430 380 320 270 200 150 100 80 50 25 10 y = -4.446x + 661.38
R2 = 0.985
-50 50 150 250 350 450 550 650
3 9 15 21 27 33 39 45 51 57 63 69 75 81 87 93 99 105 111 117 123 129 135 141 147
Progression in months
C D 4 c e ll s \m m 3
3. Correlation of CD4 and VL in HIV infection
FIG:10. 3.3 3.44 3.47 3.6 3.69 3.77 3.9 3.95 4 4.7 4.74 4.84 4.95 5.4 6.3 6.6 6.7 6.8
y = -0.0051x + 6.3757 R2 = 0.913
0 1 2 3 4 5 6 7
4. HGB decline in HIV progression in MALE
Fig:11
Natural History of HGB decline in male
-1 1 3 5 7 9 11 13 15 17
0 20 40 60 80 100 120 140
Prog in months
H G B g \d l
5. HGB decline in HIV progression in FEMALE
FIG:12
Natural History of HGB decline in female
0 2 4 6 8 10 12 14 16
0 20 40 60 80 100 120 140
Prog in months
D. Changes of markers trend in different categories
1. Category I&II
CD4 decline in category I&II
FIG:13
CD4 changes in Acute phase HIV progression
1200 1050 950 900 700 500 550 620 650 0 200 400 600 800 1000 1200 1400
0 1 2 3 4 5 6 7 8 9 10 11 12
progression in w eeks
C D 4 ce lls \m m 3
VL changes in Category I&II
FIG:14.
VL level in HIV progression at acute phase
0 2.6 3.3 4 5.3 5.7 5.6 3.3 3.3 0 1 2 3 4 5 6 7
0 1 2 3 4 5 6 7 8 9 10 11 12
prog in weeks
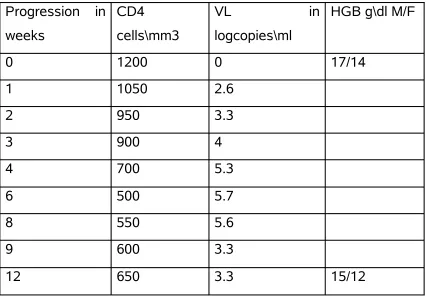
Data for Category I&II
Table :8
Progression in weeks
CD4 cells\mm3
VL in
logcopies\ml
HGB g\dl M/F
0 1200 0 17/14
1 1050 2.6
2 950 3.3
3 900 4
4 700 5.3
6 500 5.7
8 550 5.6
9 600 3.3
12 650 3.3 15/12
I. Change in CD4 count at 0-2 months
FIG:15.
CD4 decline at 0-8 weeks 1200 1050 950 900 700 600 500 550
y = -90.852x + 1135.6 R2 = 0.9004
0 200 400 600 800 1000 1200
0 1 2 3 4 5 6 7 8
prog in weeks
C D 4 c e ll s \m m 3
I. Change in VL level at 0-2 months
FIG:16.
HIV prog upto 8 th week
0 2.6 3.3 4 5.3 5.7 5.6
y = 0.6401x + 1.591
R2 = 0.7737
0 1 2 3 4 5 6 7 8
0 1 2 3 4 5 6 7 8
Prog in weeks
V L i n l o g c o p ie s \m l
II. Change in CD4 count at 2-3 months
FIG: 17.
CD4 changes in 8-12 weeks of acute infection
550
600
620
640
650
y = 24x + 372
R2 = 0.9172
540 560 580 600 620 640 660 680
8 9 10 11 12
prog in weeks
C
D
4
ce
ll
s\
m
m
3
II. Change in VL level at 2-3 months
FIG:18.
VL changes in 8-12 weeks of acutue infection 5.6
3.3 3.3 3.3 3.3
0 1 2 3 4 5 6
8 9 10 11 12
Prog in weeks
V L i n l o g c o p ie s \m l
2. Category III-VI
Data for category III-VI
TABLE:9
Progression in months
CD4 cells\mm3 VL log
copies\ml
HGB g\dl
3 650 3.3 15\12
4 625 3.44 14\11
6 590 3.47
12 575 3.60
24 550 3.69
36 510 3.77 12\10
48 490 3.90
60 430 3.95
72 380 4 10\9
CD4 decline in category III-VI
FIG: 19.
CD4 Decline in Cat.B.Natural progression
650 625 590 575 550 510 490 430 380
y = -3.3947x + 633.29
R2 = 0.9678
0 100 200 300 400 500 600 700
3 6 9 12 15 18 21 24 27 30 33 36 39 42 45 48 51 54 57 60 63 66 69 72
Prog in months
C D 4 c e ll s \m m 3
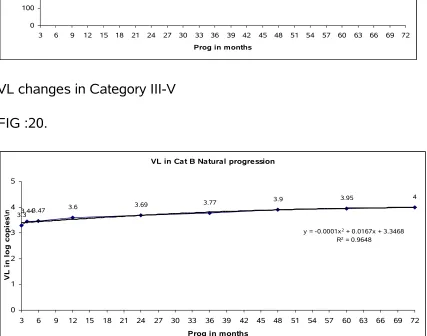
VL changes in Category III-V
FIG :20.
VL in Cat B Natural progression
3.33.443.47
3.6 3.69 3.77
3.9 3.95 4
y = -0.0001x2 + 0.0167x + 3.3468
R2 = 0.9648
0 1 2 3 4 5
3 6 9 12 15 18 21 24 27 30 33 36 39 42 45 48 51 54 57 60 63 66 69 72
Prog in months
[image:73.612.93.520.336.672.2]3. Category VI-VII
Data for Category VI-VII
TABLE: 10.
Progression in months
CD4 cells\mm3 VL log
copies\ml
HGB g\dl
72 380 4 10\9
84 320 4.7
96 270 4.74
108 200 4.84 9\8
114 150 4.95
120 100 5.4 7\6
126 80 6.3
132 50 6.6
138 25 6.7
144 10 6.8
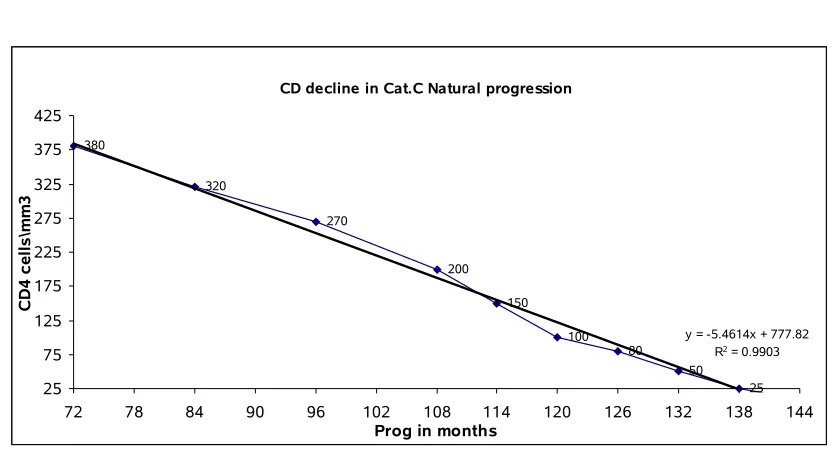
CD4 decline in Category VI-VII
FIG :21
CD decline in Cat.C Natural progression
380 320 270 200 150 100 80 50 25 y = -5.4614x + 777.82
R2 = 0.9903
25 75 125 175 225 275 325 375 425
72 78 84 90 96 102 108 114 120 126 132 138 144
Prog in months
C D 4 c e ll s \m m 3
VL changes in VI-VII
FIG : 22.
VL in Cat.C Natural progression
4
4.7 4.74 4.84 4.95
5.4
6.3 6.6 6.7
6.8
y = 0.0402x + 0.9388 R2 = 0.8809
0 1 2 3 4 5 6 7 8
72 78 84 90 96 102 108 114 120 126 132 138 144
Prog in months
[image:75.612.92.511.315.686.2]TABLE:11. F. Classification of HIV infection based on symptoms and changes in markers trend
Categ ory
Month s
Symptoms(HIV, OI,
Drugs)
CD4 cells\ mm3
VL
log copies\ ml
HGB g\dl
F\M
I 2 • Fever
• Mouth ulcer
• Malaise
• Arthralgia
• Head ache
• Loss of appetite
• Rash
• Pharyngitis
• Anal ulcer
• Genital ulcer
• Weight loss
550 5.6 14\1
7
• Diarrhoea
• Thrush
• Voimiting
• Swollen lymph
glands
Drugs
• GI distrubance
II 3 • Aseptic meningitis
• Peripheral neuropathy
• Facial palsy
• Guillian Barre
synndrome
• Branchial neuritis
• Cognitive impairment
650 3.38
III 36 • Mild fatigue
• Low grade fever
510 3.77 11\1
4
• Night sweats
IV 60 • Cervical dysplasia
patches
• Persistant lymph
adenopathy
• Sore throat
• Joint pain
• Muscle pain
• Cervical epithelial neoplasia
OI
• Severe diarrhea
• Severe Weight loss
o Drugs
• GI intolerance
• Colitis symptoms
430 3.95 10\1
2
V 72 • Recuurent
respiratory tract infection
OI
• Purplish skin
• Severe cough and weight loss
• Sputum contain
blood
• Drugs
• Skin eruption
• Optic neuritis
• Hematological
symptoms
• Anemia
• Lymphophenia
• Leucopenia
• Bone marrow
depression
380 4 9\10
• Cardic complaints
• Tingling, numbness
Noticeable changes in the way of walk
VI 108 • Dysplasia patches
• Erythymatous
Maculopapoular
with lesions
includind palms and soles
OI
• Fluffy white patch
• Red inflamed skin
• Severe irritation
• Leisons on genitals
• Patches on armbits
• Bleeding from
mucous membrane
• Shingles (painful blister in a band of
200 4.84 8\9
red skin)
• Thrush (thick white coating)
• Tingling,numbness
• Neurological dysfunction
• Pure RBC aplasia
• Neutropenia
• Anemia
• Thrombocytopenia
• More than I month chronic ulcer
• Bronchitis
• Fungal nail
infection
• Dermatitis
Drugs
• GI intolerance
VII 144 • HIV
• Primary CNS
syndrome
• Severe watery
diarrhea
• Severe Weight loss
• Gastro enteritis
OI
• Pseudo
membraneous plaques
• Pain on swallowing
• 2-3 weeks head
ache
• Phtophobia
• Neurological dysfunction
• Pure RBC aplasia
10 6.7 6\7
• Anemia
• 2-3 week dry cough
• fever more than 1 months
• Disproportionate breathlessness
• Sore throat
• Sneezing
• Oesophagal
symptoms
• Reduced
visualactivity hemorrohogic
exudates along retinal vessels
• Loss of memory
and depression
• Paralysis
• Leisons in
cerebraum
• Unconsiousness
• More than 1 month
chronic GI problem
• Chronic blood loss
• Anemia
• DRUGS
• Liver function
impaired
• Hypo kalemia
• Bone marrow
depression
• Weight loss
• GI intolerance
• Lactic acidosis
• Abdominal pain
• Glycosuria
• Proteinmia
• Leucopenia
• Blister formation
• Skin rash
• Allergy
• Skin eruption
• Anorexia
• Thrombocytopenia
• Anemia(drug d)
• Hyperglycemia
• Hyper lipidemia
• Poly urea
• Poly pagia
4.2. Existing Data Analysis
Clinical and laboratory profile of study group
Cas e No
Clas
s 1 2 3 4 5 6 7 8 9 10 11 12 13 14 15 16 17 18 19 20 21 22 23
2 4 25 2 6 ag e se
x Hb TLC CD 4 cell s
9 I y1
0 y10 y 41 m
12. 7
224 4
8 I y y 28 m 17.
1 217 0
22 I y y5 Y y 46 m 15.
3 210 0
2 I y y y y 25 m 10.
6 200 0
25 I y1
0 y10 y y 59 m 9.1
185 4
36 I y y y y 30 f 12.
4 180 0
30 I y y Y y y y 61 m 13 173
4
32 III y y y y y y y 49 m 10.
7 172 2
49 III y1 5
y15 y y y y 38 m 9.6 170
0
380
18 III y5 y5 y15 y 47 m 14 168 3
12 III y5 Y y 29 m 13 164
0
26 IV Y y y y 49 m 11.
7 162 0
23 IV y y y y y y 63 m 11 156
4
43 IV y y y 42 m 11.
5 154 0
19 IV y1
0 Y y30 y y y 33 m 11
153 6
14 IV y1
5 y y15 y y
y1
0 y 33 m
10. 1
151 8
15 IV y3
0 y30 y 42 m 12
150 0
48 IV y Y y y y y y y 75 m 10 150
0
24 V y1
0 y y y y 29 f 9.4
148
2 410
38 V y y y y 50 m 10.
7 148 0
44 V y5 y y y y 38 m 10.
1 147 4
41 V y1
5 y15 y y30 y y y 47 m 9.3
145 8
35 V Y y y y y y y 32 m 10.
1 145
6 310
31 V y1
0 Y y10 y 38 m
14. 2
145 2
33 V y Y y5 y y y 28 m 11.
4 145
0 440
40 V y3
0
y1
5 y y30 y5 33 m
11. 1
145 0
20 V y1
5
y1
5 y15 y y y
y1
0 y 27 m
11. 3
140 7
16 V y1
5 y10 y15 y5 39 m
11. 6
140 0
27 V y1
5 y y y y y 48 f 9
140
0 324
34 VI y y y y Y 38 m 12. 138
8 6
1 VI y y1
0 y Y y30 y y y y y 39 m 8
137 5
50 VI y y10 y y y y 33 m 12 136
5
10 VI y1 0
y1
5 y y y y 35 m
10. 8
132 0
28 VI y10 y15 y y1
0 34 m
12. 8
127 6
17 VI Y y15 y y y 48 m 9 125
0
47 VI y10 y y 57 f 10.
6 112 5
46 VI y3
0
y3
0 y
y1
5 31 f 8.2
109
2 205
45 VI y y30 y y y15 y15 y y1
5 24 m 8
109
0 190
5 VI y y30 y10 y10 y 39 m 10.
5 108 0
4 VI y15 y15 y 47 m 12 102
4
42 VII y3
0 y y y30 y
y1
5 y
y3
0 44 m 7.6 950 84
29 VII y Y y10 y 36 m 8.4 935 225
3 VII y y y y 26 m 10.
6 900
37 VII y1
0 y
y1 5
y1
5 y30 y y y y y y
y1
5 y 52 m 7.2 896 185
7 VII y y y y y 30 m 9 880
13 VII y3 0
y1
5 y15 y y y15 y y y 32 m 8.4 810 78
11 VII y1
5 y y y y10 y10 y 25 m 9.3 793 102
39 VII y30 y y y 25 m 8.2 792 178
6 VII y10 y y y y y 46 m 7.2 510
21 VII y y Y y30 y y 40 m 7.6 390 108
I 7 1 0 1 1 2 2 1 5 1 1 2 3 0 0 0 1 2 0 0 2 1 1 0 0 0 0 0
III 4 3 0 0 1 0 0 0 3 0 0 0 1 1 1 0 1 1 1 1 2 1 0 0 2 0 1 1
IV 7 1 0 0 2 0 4 1 3 0 2 0 2 2 2 1 0 2 1 1 5 3 3 1 0 0 1 0
V 11 4 0 0 6 1 4 2 7 3 1 0 2 6 5 0 0 2 1 0 6 4 0 1 2 3 1 4
VI 11 1 1 2 4 1 3 2 7 0 3 2 4 4 4 1 2 4 0 1 7 1 1 2 0 2 0 2
VII 10 4 1 4 6 1 3 0 10 3 1 0 0 5 6 0 0 4 1 1 5 1 1 1 2 4 2 7
Sy 50 14 2 7 20 5 16 6 35 7 8 4 12 18 18 2 4 15 4 4 27 11 6 5 6 9 5 14
m
A. Characteristics of subjects (N=50)
1. Age group in study population
FIG:23.
20-30 24%
30-40 38% 40-50
28% >50 10%
2. Percentage of male and female participants
FIG: 24.
Male 90% Female
10%
3. Comorbidity in study population
FIG:25.
comorbidity
Anemia 47%
OI 27% TB 7% Cancer
1% others
18%
B. I. Clinical symptoms frequently observed in total study population
1. Abdominal pain*
2. Acute pancreatitis
3. Anemia*
4. Cough with expectoration
5. Diabetes melitis
6. Difficulty in breathing
7. Enlarge lymph node*
8. Fever*
9. Gastritis*
10. Guiddiness*
11. Head ache*
12. Joint pain*
13. Loss of appetite*
14. Loss of weight *
15. Multiple Liver abscess
16. Night sweating*
17. OI symptoms
18. Oral candidiasis
19. Oral ulcer*
20. Others
21. Respiratory tract infection *
22. Slurring of speech*
23. TB
24. Vomiting *
25. Watery diarrhoea*
26. White mucoid sputum
Note : * indicates the HIV symptoms observed in study group
Others
1. Acute Coronary syndrome
2. Bronchitis
3. Chest pain
4. Chronic ulcer
5. Decrease in urine output
6. Edema
7. Focal fitness
8. General weakness
9. Hemorrhoids
10. Ischemic Heart Disease
11. Numbness
12. Pain on swallowing
13. Pleural effusion
14. Sneezing
15. Spasm
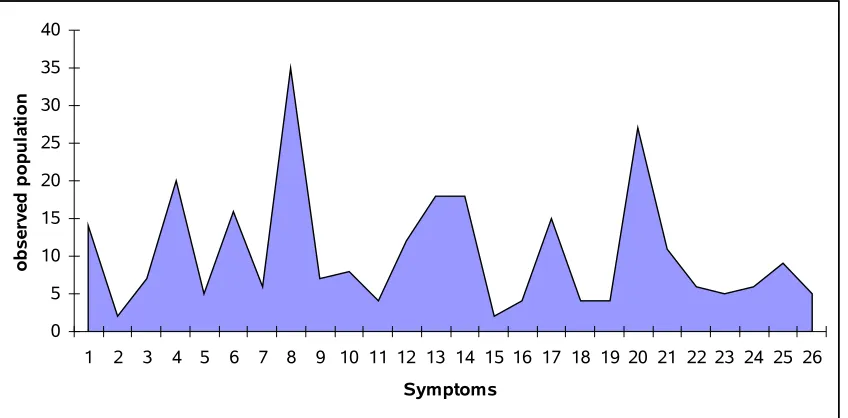
Symptoms observed in study group
FIG:26.
0 5 10 15 20 25 30 35 40
1 2 3 4 5 6 7 8 9 10 11 12 13 14 15 16 17 18 19 20 21 22 23 24 25 26
Symptoms
o
b
se
rv
ed
p
o
p
u
la
ti
o
n
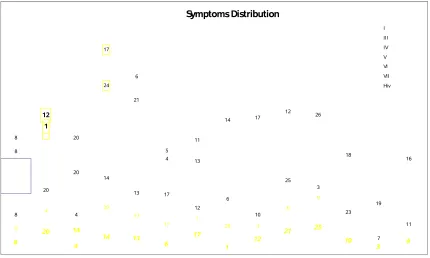
Fig 27 Symptoms distribution
Symptoms Distribution 8 20 4 14 13 6 17 1 12 21 25 10 3 9 8 4 20 13
17 1 25 3
[image:97.612.102.532.87.345.2]6 9 8 20 4 14 13 17 12 6 10 25 3 23 7 11 8 20 4 13 14 6 1 21 25 9 17 12 7 24 20 8 21 22 4 13 14 17 12 10 8 20 21 4 13 14 17 12 26 18 19 16 8 20 6 5 11 14 6 1 24 12 17 I III IV V VI VII Hiv
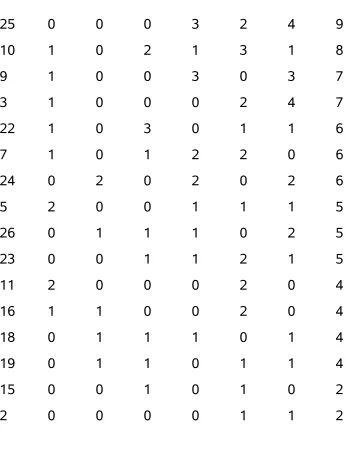
Table 12 frequently distributed symptoms
Sym
ID I III IV V VI VII Sym
8 5 3 3 7 7 10 35
20 2 2 5 6 7 5 27
4 1 1 2 6 4 6 20
13 0 1 2 6 4 5 18
14 0 1 2 5 4 6 18
6 2 0 4 4 3 3 16
17 2 1 2 2 4 4 15
1 1 3 1 4 1 4 14
12 3 1 2 2 4 0 12
21 1 1 3 4 1 1 11
25 0 0 0 3 2 4 9
10 1 0 2 1 3 1 8
9 1 0 0 3 0 3 7
3 1 0 0 0 2 4 7
22 1 0 3 0 1 1 6
7 1 0 1 2 2 0 6
24 0 2 0 2 0 2 6
5 2 0 0 1 1 1 5
26 0 1 1 1 0 2 5
23 0 0 1 1 2 1 5
11 2 0 0 0 2 0 4
16 1 1 0 0 2 0 4
18 0 1 1 1 0 1 4
19 0 1 1 0 1 1 4
15 0 0 1 0 1 0 2
2 0 0 0 0 1 1 2
Fig 28
[image:98.612.106.452.97.562.2]Symptom ID Vs Frequency <Hiv>
0 5 10 15 20 25 30 35 40
8 20 4 13 14 6 17 1 12 21 25 10 9 3 22 7 24 5 26 23 11 16 18 19 15 2
HIV symptoms in total study group
FIG:29 0 5 10 15 20 25 30 35 O b se rv ed in s tu d y g ro u p
1 2 3 4 5 6 7 8 9 10 11 12 13 14 15 16
HIV symptoms
HIV symptos in total 50
B. II.HIV symptoms in different study group
TABLE: 13
Category Total symptoms
Frequently observed
HIV symptoms
I 15 11
II 0 0
III 7 3
IV 14 12
V 20 11
VI 16 10
VII 21 12
Table 14
Unique symptom of HIV in entire population
Hiv VII VI V IV III I
8 8 8 8 20 8 8
20 4 20 20 6 1 12
4 14 4 4 8 20 20
14 20 14 13 21 24 17
13 13 13 14 22 21 6
6 17 17 6 4 4 5
17 1 12 1 13 13 11
1 25 6 21 14 14
12 3 10 25 17 17
21 6 25 9 12 12
25 9 3 17 10 26
10 23 12 18
3 7 7 19
9 11 24 16
C. Laboratory parameter analysis
Mid month
Mid CD4
Mid TLC
Mid HGB
1 2.5 18.5 38 66 90 126
0 2 3 36 60 72 108 144
875 600 580 470 405 290 105
2200 1800 1700 1650 1300 1100 1000
17/14 15/12 14.5/11.5 13/10.5 11/9.5 9.5/8.5 8/7
TLC Median (from study)
HGB Median (from study)
CD4 Median (from study)
2000 1691 1536 1452 1250 850
10.6 11.8 11 14.2 9 8.7
380 375 197 98
D. Predicted category of Study group
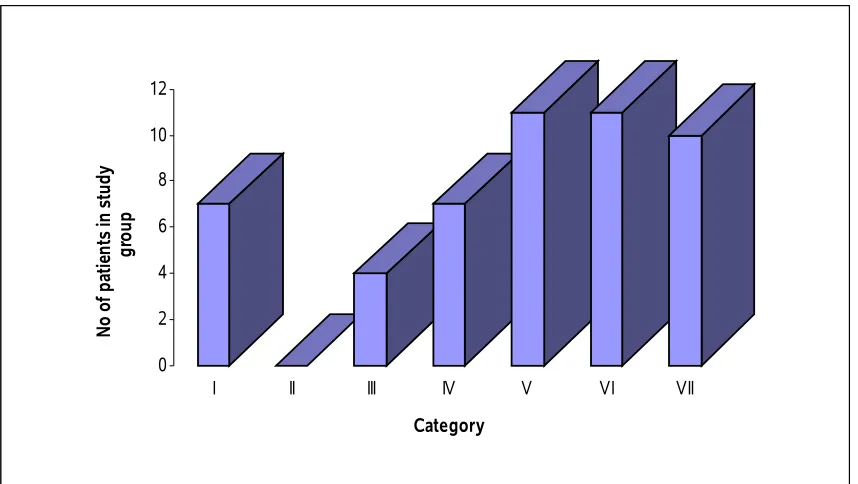
I. Population of HIV in different Category
TABLE:15
Category Study no
I 7
II 0
III 4
IV 7
V 11
VI 11
VII 10
FIG:30
0 2 4 6 8 10 12
N
o
of
p
at
ie
nt
s
in
s
tu
dy
gr
ou
p
I II III IV V VI VII
Category
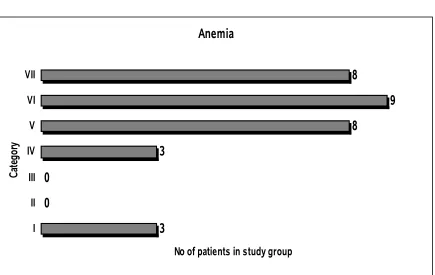
[image:105.612.104.533.88.330.2]Anemia condition in Study group
TABLE : 16
Category Study no
I 2
II 0
III 2
IV 4
V 6
VI 7
VII 10
FIG:31.
Anemia
3 0
0
3
8
9 8
I II III IV V VI VII
Ca
te
go
ry
No of patients in study group
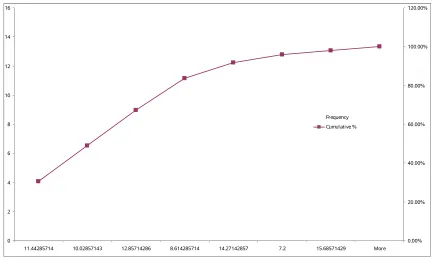
Fig 32
0 2 4 6 8 10 12 14 16
11.44285714 10.02857143 12.85714286 8.614285714 14.27142857 7.2 15.68571429 More
0.00% 20.00% 40.00% 60.00% 80.00% 100.00% 120.00% Frequency Cumulative % Fig 33
TLC count in Study group
0 2 4 6 8 10 12 14 16 18
1661.428571 1407.142857 1152.857143 1915.714286 898.5714286 More 390 644.2857143
[image:107.612.99.532.85.351.2]Fig 34
Age group in study population
0 2 4 6 8 10 12 14
38.57142857 31.28571429 53.14285714 45.85714286 60.42857143 67.71428571 24 More
0.00% 20.00% 40.00% 60.00% 80.00% 100.00% 120.00%
[image:108.612.101.532.184.444.2]Frequency Cumulative %
TABLE: 17.II. Predicted category of CD4 count measured patients
Category Study no
I 0
II 0
III 1
IV 0
[image:108.612.110.532.565.698.2]V 4 VI 2 VII 7 FIG:35 0 1 2 3 4 5 6 7 8
I II III IV V VI VII
Category p o p u la ti o n in s tu d y g ro u p
D. Prediction of CD4
[image:109.612.108.535.86.166.2]TLC,HGB,AGE of 14 CD4 category
Table 18
Case
No Class age sex HB TLC
CD4 cells
33 V 28 m 11.4 1450 440
35 V 32 m 10.1 1456 310
[image:109.612.105.533.220.476.2]49 III 38 m 9.6 1700 380
24 V 29 f 9.4 1482 410
11 VII 25 m 9.3 793 102
27 V 48 f 9.0 1400 324
29 VII 36 m 8.4 935 225
13 VII 32 m 8.4 810 78
46 VI 31 f 8.2 1092 205
39 VII 25 m 8.2 792 178
45 VI 24 m 8.0 1090 190
21 VII 40 m 7.6 390 108
42 VII 44 m 7.6 950 84
37 VII 52 m 7.2 896 185
Observed CD4 counts in Study population
Fig 36
[image:110.612.100.440.83.435.2]TLC counts in CD4 count measured patients
Fig 37
[image:111.612.108.520.99.344.2]HGB level in CD4 count measured patient
Fig 38
[image:112.612.102.515.94.264.2]Regression analysis of 3 predictors of HIV infection
[image:113.612.103.563.222.707.2]Predicded values of entire study population
Table 19
446 337 426 0.9580 1470 1.0569
283 346 336 0.9612 1215 0.9731
300 411 419 0.9830 1240 0.9823
251 322 293 0.9530 1164 0.9542
340 338 364 0.9586 1304 1.0043
202 184 166 0.9065 1087 0.9243
186 231 197 0.9222 1061 0.9138
170 230 194 0.9220 1036 0.9031
105 173 163 0.9026 934 0.8573
186 142 139 0.8922 1061 0.9138
137 23 93 0.8520 985 0.8808
275 142 123 0.8923 1202 0.9685
137 189 169 0.9080 985 0.8808
202 147 140 0.8940 1087 0.9243
552 572 996 1.0374 1637 1.1038
910 550 1480 1.0300 2199 1.2330
763 529 1200 1.0230 1969 1.1847
381 499 623 1.0130 1368 1.0253
259 456 426 0.9984 1176 0.9590
527 440 688 0.9930 1598 1.0934
576 421 695 0.9864 1675 1.1139
389 417 511 0.9852 1381 1.0294
657 406 734 0.9813 1803 1.1461
576 393 633 0.9770 1675 1.1139
470 387 533 0.9750 1509 1.0682
414 370 460 0.9694 1419 1.0414
454 363 478 0.9670 1483 1.0607
414 362 447 0.9666 1419 1.0414
340 357 387 0.9648 1304 1.0043
495 351 485 0.9630 1547 1.0792
332 351 375 0.9630 1291 1.0000
389 345 404 0.9610 1381 1.0294
340 344 370 0.9604 1304 1.0043
275 339 324 0.9588 1202 0.9685
674 337 568 0.9582 1828 1.1523
422 337 411 0.9580 1432 1.0453
438 324 400 0.9537 1458 1.0531
462 322 410 0.9530 1496 1.0645
560 318 455 0.9516 1649 1.1072
170 314 243 0.9505 1036 0.9031
495 311 408 0.9495 1547 1.0792
397 298 338 0.9450 1394 1.0334
560 285 384 0.9406 1649 1.1072
251 277 252 0.9380 1164 0.9542
381 240 247 0.9255 1368 1.0253
373 227 226 0.9210 1355 1.0212
495 210 214 0.9154 1547 1.0792
381 174 150 0.9030 1368 1.0253
251 168 151 0.9010 1164 0.9542
[image:115.612.107.529.404.597.2]105 58 126 0.8640 934 0.8573
Fig 39 Observed TLC Vs TLC from HGB
0 500 1000 1500 2000 2500
33 24 49 27 35 29 46 45 37 39 21 11 42 13 9 8 22 2 25 36 30 32 18 12 26 23 43 19 14 15 48 38 44 41 31 40 20 16 34 1 50 10 28 17 47 5 4 3 7 6 Obsd TLC
p TLC from Hb
Fig 40 Observed HGB VS HGB From TLC