SCIENTIFIC ANALYSIS OF
ROAD TRAFFIC ACCIDENTS
DISSERTATION SUBMITTED FOR
M.S. DEGREE (BRANCH II) ORTHOPAEDIC SURGERY
MARCH 2007
The Tamilnadu Dr.M.G.R. Medical University
Chennai
Department of orthopaedics and Traumatology
Government Rajaji Hospital
BONAFIDE CERTIFICATE
This is to certify that the dissertation entitled “SCIENTIFIC
ANALYSIS OF ROAD TRAFFIC ACCIDENTS” is a bonafide
record work done by Dr.M.CHANDRASEKARAN, under the
guidance of Prof.Dr.M.Chidambaram in the department of
Orthopaedics and traumatology Government Rajaji Hospital and
Madurai Medical College, Madurai.
DECLARATION
I,
Dr.M.CHANDRASEKARAN
,
solemnly declare that the dissertationtitled
“
SCIENTIFIC ANALYSIS OF ROAD TRAFFIC
ACCIDENTS
”
has been prepared by me.
This is submitted to The Tamil Nadu Dr.M.G.R.Medical University, Chennai.
In partial fulfillment of the requirements for the award of M.S.Degree
Examination (Branch II) Orthopaedics to be held in March 2007.
Place: Madurai
Date :
ACKNOWLEDGEMENT
I express my sincere and heart full gratitude towards Professor
Dr.T.Prabhakaran, Professor and head of the department of Orthopaedics
and Traumatology Government Rajaji Hospital, Madurai Medical College,
under whose guidance and supervision the present work has been carried
out.
My profound and heart full thanks to Professor Dr.M.Chidambaram for
his valuable help and guidance in preparing this dissertation throughout.
I am immensely thankful to Professor Dr.V.Pandiarajan and to Professor
Dr.P.S.Shanmugam for their help during this study.
I am extremely thankful to Prof. Dr.A.Rajamani, Prof.Dr.V.Raviraman,
for their advice and guidance during this study.
I am extremely thankful to Dr.T.Chandraprakasam, Dr.V.Ramar who
I also thank all the assistant professors in the department of
orthopaedics and traumatology for their assistance and guidance during this
study.
My profound thanks to THE DEAN, Madurai Medical College, Madurai
for permitting me to utilize the clinical materials of this hospital in this study.
Last, but not the least, I sincerely thank all the patients who have
s.No
TABLE OF CONTENTS
1. 2. 3. 4. 5. 6. 7. 8. Introduction• Road deaths, disability and injury
• The social and economic costs of road
traffic injuries
• The public health approach
• The need for good data and scientific
approach
• Global impact
• Regional distribution
• Road traffic trends
• Indian scenario
Aim
Material and methods
INTRODUCTION
Road traffic injuries are a major but neglected global public health
problem, requiring concerted efforts for effective and sustainable
prevention. Of all the systems that people have to deal with on a daily
basis, road transport is the most complex and the most dangerous.
Worldwide, the number of people killed in road traffic crashes each
year is estimated at almost 1.2 million, while the number injured could be
as high as 50 million – the combined population of five of the world’s large
cities. The tragedy behind these figures regularly attracts less media
attention than other, less frequent but more unusual types of tragedy.
What is worse, without increased efforts and new initiatives, the total
number of road traffic deaths worldwide and injuries is forecast to rise by
about 65% between 2000 and 2020 (1, 2), and in low income and
80%. The majority of such deaths are currently among “vulnerable road
users– pedestrians, pedal cyclists and motorcyclists”. In high-income
countries, deaths among car occupants continue to be predominant, but
the risks per capita that vulnerable road users face are high.
Road deaths, disability and injury:
Every day around the world, almost 16,000 people die from all types of
injuries. Injuries represent 12% of the global burden of disease, the third
most important cause of overall mortality and the main cause of death
among 1–40- year-olds ( 3). The category of injuries worldwide is
dominated by those incurred in road crashes. According to WHO data,
deaths from road traffic injuries account for around 25% of all deaths from
injury ( 4). Estimates of the annual number of road deaths vary, as a result
underreporting and differences in interpretation. The figure ranges from
around 750,000 ( 5) (probably an underestimate, since it is made on the
basis of 1998 data) to 1,183,492 annually – representing over 3000 lives
lost daily .
Around 85% of all global road deaths, 90% of the disability-adjusted life
years lost due to crashes, and 96% of all children killed worldwide as a
result of road traffic injuries occur in low-income and middle-income
countries. Over 50% of deaths are among young adults in the age range of
15–44 years ( 6). Among both children aged 5–14 years, and young
people aged 15–29 years, road traffic injuries are the second-leading
cause of death worldwide (see Table 1).
The road traffic death toll represents only the “tip of the iceberg” of the total
waste of human and societal resources from road injuries. WHO
injured or disabled each year in road traffic crashes (the reason for the
wide range of this estimate being the considerable, known underreporting
of casualties) (10). Using epidemiological evidence from national studies, a
conservative estimate can be obtained of the ratios between road deaths,
injuries requiring hospital treatment, and minor injuries, as being 1:15:70 in
most countries (11–18). In many low-income and middle-income countries,
the burden of traffic-related injuries is such that they represent between
30% and 86% of all trauma admissions (19, 20).While a decrease in
deaths due to road traffic crashes of some 30% is forecast in high-income
countries, current and projected trends in low income and middle-
income countries foreshadow a huge escalation in global road crash
mortality between 2000 and 2020. Furthermore, on current trends, by
2020, road crash injury is likely to be the third leading cause of disability-
ESTIMATED GLOBAL RESEARCH AND DEVELOPMENT FUNDING FOR
SELESCTED TOPICS:
Disease or injury
US$ millions 1990 DALYs ranking 2020 DALYs ranking
HIV/AIDS 919 -985 2 10
MALARIA 60 8
DIARRHOEAL DISEASES
32 4 9
ROAD TRAFFIC CRASHES
24 -33 9 3
TUBERCULOSIS 19 -37 - 7
DALYs: disability-adjusted life years. Source: reference 24
The social and economic costs of road traffic injuries:
In economic terms, the cost of road crash injuries is estimated at roughly
1% of Gross National Product (GNP) in low-income countries, 1.5% in
[image:12.612.90.569.130.481.2]middle income countries and 2% in high-income countries ( 5) The direct
economic costs of global road crashes have been estimated at
US$ 518 billion, with the costs in low-income countries – estimated at
US$ 65 Billion – exceeding the total annual amount received in
development assistance ( 5). Furthermore, the costs estimated for low-
income and middle-income countries are probably significant
underestimates. Using more comprehensive data and measurement
techniques, the estimated annual costs (both direct and indirect) of road
crash injury in European Union (EU) countries alone, which contribute 5%
to the global death toll, exceed €180 billion(US$ 207 billion) ( 9, 21). For
the United States of America, the human capital costs of road traffic
crashes in 2000 were estimated at US$ 230 billion ( 22). If comparable
estimates were made of the direct and indirect economic costs of road
crashes in low-income and middle-income countries, the total economic
cost globally of road crashes would be likely to exceed the current estimate
been estimated at US$ 518 billion, with the costs in low-income countries –
estimated at US$ 65 billion – exceeding the total annual amount received
in development assistance ( 5). Furthermore, the costs estimated for low-
income and middle-income countries are probably significant
underestimates. Using more comprehensive data and measurement
techniques, the estimated annual costs (both direct and indirect) of
road crash injury in European Union (EU) countries alone, which contribute
5% to the global death toll, exceed €180 billion (US$ 207 billion) ( 9, 21).
For the United States of America, the human capital costs of road traffic
crashes in 2000 were estimated at US$ 230 billion ( 22). If comparable
estimates were made of the direct and indirect economic costs of road
crashes in low-income and middle-income countries, the total economic
cost globally of road crashes would be likely to exceed the current estimate
The efforts required include ( 25, 34):
— A scientific approach to the topic;
— The provision, careful analysis and interpretation of good data;
— The setting-up of targets and plans;
— The creation of national and regional research capacity;
— Institutional cooperation across sectors.
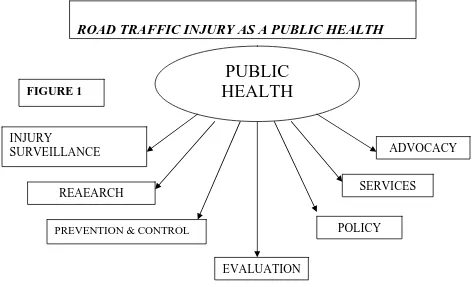
The public health approach:
The public health approach to road traffic injury prevention is based on
science. The approach draws on knowledge from medicine, biomechanics,
epidemiology, sociology, behavioural science, criminology, education,
economics, engineering and other disciplines. While the health sector is
only one of many bodies involved in road safety – and usually not even the
These include:
• discovering, through injury surveillance and surveys, as much as possible
about all aspects of road crash injury – by systematically collecting data on
the magnitude, scope, characteristics and consequences of road traffic
crashes;
• researching the causes of traffic crashes and injuries, and in doing so
trying to determine:
— Causes and correlates of road crash injury,
PUBLIC
HEALTH
POLICY INJURY
SURVEILLANCE
PREVENTION & CONTROL
REAEARCH
ADVOCACY
EVALUATION
SERVICES
[image:16.612.70.543.73.360.2]ROAD TRAFFIC INJURY AS A PUBLIC HEALTH
— Factors that increase or decrease risk,
— Factors that might be modifiable through interventions;
• exploring ways to prevent and reduce the severity of injuries in road
crashes – by designing, implementing, monitoring and evaluating
appropriate interventions;
• helping to implement, across a range of settings, interventions that
appear promising, especially in the area of human behaviour,
disseminating information on the outcomes, and evaluating the cost-
effectiveness of these programmes;
• Working to persuade policy-makers and decision-makers of the necessity
to address injuries in general as a major issue, and of the importance of
adopting improved approaches to road traffic safety;
practices that protect pedestrians, cyclists and the occupants of vehicles;
• Promoting capacity building in all these areas, particularly in the
gathering of information and in research.
PREVENTION AND CONTROL
THE NEED FOR GOOD DATA AND SCIENTIFIC APPROACH:
Road traffic injury prevention is a highly politicized issue. Most people have
their own opinions on what could make the roads safer. Anecdotal
information and its reporting by the media all too often allow issues to be
understood as major traffic safety problems requiring priority action, which
in turn puts pressure on policy-makers to respond. Policy decisions for
effective road injury prevention need to be based on data and objective
information, not on anecdotal evidence. First, data on the incidence and
types of crashes are needed. After that, a detailed understanding of the
circumstances that lead to crashes is required to guide safety policy.
are is a valuable instrument for identifying interventions and for monitoring
the effectiveness of interventions. In many low-income and middle-income
countries, systematic efforts to collect road traffic data are not well
developed and underreporting of deaths and serious injuries is common.
GLOBAL IMPACT:
The road traffic injury problem began before the introduction of the car.
However, it was with the car – and subsequently buses, trucks and other
vehicles – that the problem escalated rapidly. By various accounts, the first
injury crash was supposedly suffered by a cyclist in New York City on 30
May 1896, followed a few months later by the first fatality, a pedestrian in
London (3). Despite the early concerns expressed over serious injury and
loss of life, road traffic crashes have continued to this day to exact their
toll. Though the exact number will never be known, the number of fatalities
million by 1997 (4). WHO data show that in 2002 nearly 1.2 million people
worldwide died as a result of road traffic injuries . This represents an
average of 3242 persons dying each day around the world from road traffic
injuries. In addition to these deaths, between 20 million and 50 million
people globally are estimated to be injured or disabled each year (2, 5, 6).
In the same year, the overall global road traffic injury mortality rate was
19.0 per 100 000 population (see Table 3 ). Low-income and middle-
income countries had a rate slightly greater than the global average, while
that for high-income countries was considerably lower. The vast majority –
90% – of road traffic deaths were in low-income and middle-income
countries. Only 10% of road traffic deaths occurred in high-income
TABLE: 3
In 2002, road traffic injuries were the ninth leading cause of disability-
adjusted life years lost, accounting for over 38 million disability-adjusted
life years (DALYs) lost, or 2.6% of the global burden of disease. Low-
income and middle-income countries account for 91.8% of the DALYs lost
to road traffic injuries worldwide. These observations illustrate the fact that
low-income and middle-income countries carry most of the burden of the
world’s road traffic injuries.
REGIONAL DISTRIBUTION:
There is considerable regional variation, both in the absolute number of
Region recorded the highest absolute number of deaths in 2002, with just
over 300,000, followed by the WHO South-East Asia Region with just
under 300,000. These two regions together account for more than half of
all road traffic deaths in the world. As regards death rates, the WHO
African Region had the highest mortality rate in 2002, at 28.3 per 100 000
population, followed closely by the low-income and middle-income
countries of the WHO Eastern Mediterranean Region, at 26.4 per 100 000
population (see Figure 3 and Table 3). The high-income countries in
Europe have the lowest road traffic fatality rate (11.0 per 100 000
population) followed by those of the WHO Western
Pacific Region (12.0 per 100 000 population). In general, the regional
averages for low-income and middle-income are much higher than
Road traffic trends
:According to WHO data, road traffic deaths have risen from approximately
999,000 in 1990 (8) to just over 1.1 million in 2002 – an increase of around
10%. Low-income and middle-income countries account for the majority of
this increase. Although the number of road traffic injuries has continued to rise
in the world as a whole, time series analysis reveals that road traffic fatalities
and mortality rates show clear differences in the pattern of growth between
high-income countries, on the one hand, and low-income and middle-income
countries on the other (2, 9–11). In general, since the 1960s and 1970s, there
has been a decrease in the numbers and rates of fatalities in high-income
countries such as Australia, Canada, Germany, the Netherlands, Sweden, the
United Kingdom and the United States of America. At the same time, there
has been a pronounced rise in numbers and rates in many low-income and
The reductions in road traffic fatalities in high-income countries are attributed
largely to the implementation of a wide range of road safety measures,
including seat-belt use, vehicle crash protection, traffic-calming interventions
and traffic law enforcement (2, 12). However, the reduction in the reported
statistics for road traffic injury does not necessarily mean an improvement in
road safety for everyone. According to the International Road Traffic and
Accident Database (IRTAD), pedestrian and bicyclist fatalities have
decreased more rapidly than have fatalities among vehicle occupants. In fact,
between 1970 and 1999, the proportion of pedestrian and bicyclist fatalities
fell from 37% to 25% of all traffic fatalities, when averaged across 28
countries that report their data to IRTAD (13). These reductions could,
however, be due, at least in part, to a decrease in exposure rather than an
The GBD model predicts the following scenario for 2020 compared with 1990:
1. Road traffic injuries will rise in rank to sixth place as a major cause of
death worldwide.
2. Road traffic injuries will rise to become the third leading cause of
DALYs lost.
3. Road traffic injuries will become the second leading cause of DALYs
lost for low-income and middle-income countries.
4. Road traffic deaths will increase worldwide, from 0.99 million to 2.34
million (representing 3.4% of all deaths).
5. Road traffic deaths will increase on average by over 80% in low-income
and middle-income countries and decline by almost 30% in high-income
countries.
DALYs lost will increase worldwide from 34.3 million to 71.2 million
model predictions , between 2000 and 2020, South Asia will record the largest
growth in road traffic deaths, with a dramatic increase of 144%. If the
low-income and middle-low-income countries follow the general trend of the
high-income countries, their fatality rates will begin to decline in the future, but not
before costing many lives.
Road traffic trends have dramatically changed from the rising trend to the
declining trend in high income countries in the phase of increase in the
vehicles and transportation. On the other hand the trend in the low income
and developing and under developed countries is on the increasing trend.
This can be seen in the following figures 4,5,6.
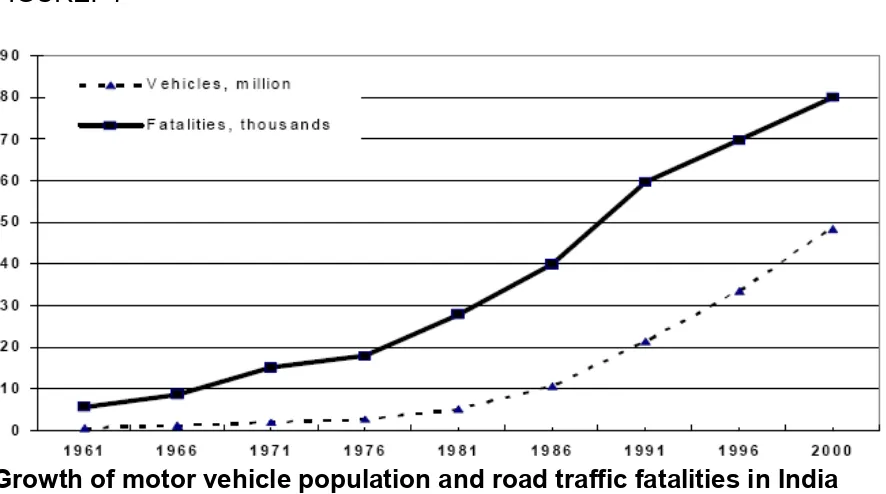
ROAD TRAFFIC ACCIDENTS – INDIAN SCENARIO:
According to official statistics 80,118 persons were killed and 342,200
injured in road traffic crashes in India in the year 2000 (2). However, this is
numbers are likely to have been in the region of 1,200,000 persons with
injuries requiring hospital treatment and 5,600,000 persons sustaining
minor injuries. The situation in India is worsening and RTI have been
increasing over the past twenty years (Figure 1).This is partly due to the
increase in the number of vehicles on the road and partly due to the
absence of a coordinated official policy to control the problem. These data
show that the number of fatalities have continued to increase at
approximately the same rate of about five percent a year over the past
two decades. The fatality rate per million vehicles has remained around 2
for the past few years, whereas, the rate per million population continues to
FIGURE: 7
Growth of motor vehicle population and road traffic fatalities in India
India is experiencing a new phenomenon in road traffic patterns and
crashes for which there is little precedence in the highly motorised
countries (HMC). Here the same road space gets used by modern cars
and buses, along with locally developed vehicles for public transport
(three-wheeled scooter taxis), scooters and motorcycles, bicycles,
rickshas, and animal and human drawn carts. The infrastructure design
based on homogeneous traffic models, has failed to fulfill the mobility and
[image:28.612.94.537.100.347.2]Figure:8
Non-motorized transport (NMT) constitutes a significant share of the total
traffic in Indian cities and almost all of them experience a relatively high
proportion of bicycle traffic (Figure 2). The share of NMT at peak hour
varies from 30-70% depending on the city and the road. The proportion of
trips undertaken by bicycles range between 15 and 35 per cent, the share
tending to be higher in medium and small size cities (3). The patterns of
NMT use change with growth in city size. In most NMT dependent cities,
motorized public transport trip involves access trips by NMT at each end.
Thus, NMT including walking continues to play a very important role in
meeting the travel demand in Indian cities.
INJURIES AND FATALITIES: NUMBERS AND PATTERNS
Estimate of injuries and fatalities
According to official statistics 80,118 persons were killed and 342,200
persons injured in road traffic crashes in India in 2000 (2). However, a
study done in Bangalore shows that while the number of traffic crash
deaths recorded by the police is reasonably reliable, the total number of
injuries is grossly underestimated (4). According to this study, deaths were
underestimated by 5% and the number injured who needed treatment in
hospitals by more than a factor of two. In this study, the ratio of injured
people reporting to hospitals to that killed was 18:1. It is important to note
many others would have taken treatment athome or from private medical
practitioners.
Another detailed study done in Haryana (India) recorded all traffic-related
injuries and deaths through bi-weekly home visits to all households in 9
villages for a year (5). This study showed that the ratio between critical,
serious and minor injuries was 1:29:69. In 1998 in U.S.A. 41,471 persons
were reported killed and 3,192,000 injured, giving a ratio of 1:77 for
recorded fatalities: injuries. Other studies from HMCs for ratios between
deaths:serious-injuries:minor-injuries give statistics of 1:13:102 (6) and
1:14:80 (7)
• According to recent data, Indian roads carry about 1% of the world's
vehicles; but still it accounts for 10% of RTAs, which is highest for
• The major reasons implicated are (46): Wrong roads and curves
Road encroachments
Poor lightings
Poorly maintained vehicles and roads
Lack of reliable public transport
Lack of road education for both the motorist & pedestrian.
One reason is that health and technical professionals in India have not
taken a scientific approach to this problem. In Australia, Europe and north
America, many of the pioneers in road safety research came from the
health profession. In India we do not have many surgeons or physicians
who have taken up the cause of road safety in a scientific and consistent
manner.
With these back ground our study aims at analyzing the road traffic
AIM
To analyze the selected SCIENTIFIC PROFILES of ROAD TRAFFIC
ACCIDENTS.
MATERIALS AND METHOD:
Study place – Government Rajaji Hospital, Madurai Medical college,
in the Department of Orthopaedics & Traumatology
Study Period - July 2004 to June 2005
INCLUSION CRITERIA:
All the patients attended GRH Madurai with an history of RTAs.
EXCLUSION CRITERIA: Injuries other than RTAs.
For the purpose of the study, good definition was sought and World
Definition: An accident which take place on the road between two or
more objects one of which must be any kind of moving vehicle٭. [WHO]
Ethical clearance was obtained from the institution
Persons interviewed were the – victims of RTA, their relatives /
attendees All patients who attended the department of orthopaedics
with the history of road traffic accidents were interviewed using a
pretested proforma and the data were collected and registered in the
registry. In patients with normal conscious state data were directly
collected from them once they were stabilized clinically. In cases where the
patients general condition did not permit the data collection we collected
the data from the attendees and later the same data were confirmed with
the patients as their general condition permitted us to do so. All the
collected data were fed into a computer which had a special software
to collect the data from the patients and the results were analyzed as
Sex distribution,
Age distribution,
Different road occupants,
Different vehicles in road traffic accidents
Nature of road traffic accidents
Time distribution,
Injury pattern,
Day distribution,
Mode of road traffic accidents,
Seat belt wearing,
Helmet wearing,
Alcohol consumption,
Driving license.
TOTAL NUMBER OF VICTIMS ANALYZED WERE: 2641
RESULTS:
SEX DISTRIBUTION
Total number of Male victims of road traffic accidents were 1910
constituting 72% of the victms.
Total number of Female victims of road traffic accidents were 491
constituting 28% of the victims.
AGE DISTRIBUTION:
In our study we grouped the patients according to their age group into
eight groups as <15 years, 15 -20 yrs, 21 -30 yrs, 31- 40 yrs, 41 – 50
TABLE :4
S.NO AGE GROUP VICTIMS IN NO. PERCENTAGE
1. <15 240 9.2%
2. 15 -20 183 6.5%
3. 21-30 718 27%
4. 31-40 595 22.5%
5. 41-50 396 15.4%
6. 51-60 321 12%
7. 61-70 161 6%
8. >7O 27 1%
About 65% of RTA victims were between 20 & 50 years of age.
Road occupants:
Pedestrians formed 46 % (1215) of the victims of RTAs. Among these,
26% were injured by four wheelers,
14% by the two wheelers,
6% by the three wheelers.
Remaining 54% were the victims of bicycles, two wheelers, and three
VEHICLES IN RTA:
Total number of vehicles involved in our study was found to be 3030 .
[table 5, figure 9]
TABLE : 5 VEHICLES PATTERN IN RTA
VEHICLES NUMBER PERCENTAGE
NON MOTORISED TWO WHEELERS: MOTORISED 287 855 9% 28.2% NON MOTORISED THREE WHEELERS: MOTORISED 12 233 <0.5% 7.5%
FOUR WHEELERS 1613 53%
BULLOCK CART 30 <1%
NATURE OF RTAs
Accidents between two wheeler and four wheeler accounted 31.6% which
was followed by accidents between four wheeler and pedestrian.
[image:39.612.69.566.293.605.2][table 6, figure 10]
TABLE: 6
S.NO Nature of RTA Percentage
1. Pedestrian V 2 wheeler 20%
2. Pedestrian V 4 wheeler 26%
3. 2 wheeler V 2 wheeler 9%
4. 2 wheeler V 4 wheeler 31%
TIME OF OCCURRENCE
Peak hours of RTAs were between 12pm – 3pm hours which
[image:40.612.128.503.266.636.2]accounted for about 20% of road traffic accidents.[table 7, figure 11]
TABLE: 7
S.NO. HOURS PERCENTAGE
1. 00 – 03 am 6%
2. 03 – 06 am 4%
3. 06 – 09 am 13%
4. 09 – 12 pm 16%
5. 12 – 03 pm 20%
6. 03 – 06 pm 17%
7. 06 – 09 pm 14%
Days distribution:
[image:41.612.92.521.182.605.2]Highest number of RTAs was on SUNDAYS 21% [table 8, figure 12]
TABLE : 8
S.NO. DAYS PERCENTAGE
1. SUNDAYS 21%
2. MONDAYS 16.7%
3. TUESDAYS 11.4%
4. WEDNESDAYS 10.3%
5. THURSDAYS 13.9%
6. FRIDAYS 11.1%
7. SATURDAYS 15.3%
FIGURE : 12
DAYS DISTRIBUTION OF RTA
[image:41.612.113.514.492.716.2]MODE OF INJURY
Common mode of sustaining injury in our study was knocked down by a
Vehicle which accounted for about 80% of road traffic accidents. Other
modes of sustaining injury in road traffic accidents were head on collision,
[image:42.612.107.527.385.563.2]fall of a vehicle with resultant accident of another vehicle.[table9, figure 13]
TABLE:9
S.NO. MODE OF INJURY PERCENTAGE
1. KNOCKED DOWN 80%
2. RTA FROM FALL 4%
PATTERN OF INJURIES:
Multiple injuries dominated our study accounting for more than 50% of
victims in road traffic accidents. Among the individual injuries long bone
injuries predominated accounting for more than 30% of victims.[table 10]
S.NO INJURY PATTERN NO. PERCENTAGE
1. HEAD INJURY 137 5.2%
2. LONG BONES 923 35%
3. THORACIC INJURY 337 12.8%
4. SMALL BONES 655 24.8%
5. PELVIC BONE 83 10.7%
6. ABDOMEN 86 3.3%
[image:43.612.83.516.260.657.2]7. MULTIPLE INJURIES 1465 55.5%
DRIVING LICENSE
Among two wheelers about 10% were found not having driving
license.
Among four wheelers about <1% were found not having driving
license.
CELL PHONE USERS
Among two wheelers 9% were using cell phones at the time of RTAs
Among four wheelers 1% were using cell phones at the time of RTAs
ALCOHOL CONSUMPTION
About 3% of the victims of the two wheeler and 9% of the victims of the
HELMET WEARING:
Among the two wheelers only 6% of the victims had helmet at the time of
road traffic accidents.
SEATBELT WEARING:
None of our victims of four wheelers had seat belt on at the time of road
DISCUSSION :
Our study has showed that the major victims of road traffic accidents were
men accounting for about 72% which indicates that our community set up
which predominantly depends on male population.
Our study has showed highest number of victims of road traffic accidents
in the age group between 20 – 30 years accounting for about 27% that is
more than one fourth of the total victims of our study. This is followed by
the age group between 31- 40 years accounting for 22.5%. These two age
groups constitute almost 50% of road traffic accidents which is very
high. These are the age group in which most family’s bread winner will be.
This is the most active and productive age group of the community. Injury
involving this age group would seriously affect the economic status of the
family, community and the country. Accidents below the age group of 15
also less indicating that these are the less mobile population of the
community and both these group of population will be taken care by the
parents in case of children and the sons and daughter for those above the
age of 60.
The similar findings were also reported from Delhi and Nepal also (35,36)
However in few studies 16 – 30 years and 15 – 35 years age groups were
more involved in RTA (37,38 ). Another study from Delhi, reported that
people of the third decade of age were most commonly involved in
RTAs(39) .
ROAD OCCUPANTS:
Our study has shown that pedestrians were the major number of victims
accounting for about 46% of RTA victims. This reflects both the quality of
vehicle drivers and the pedestrians. Pedestrians do not use the
occasions in our study pedestrian walk was found to be absent. Even if it
was found to be present, it was occupied by the road side shops, etc. our
study has also found that pedestrian had inadequate pedestrian crossing
and not using the pedestrian crossing in many occasions. Pedestrians
were directly exposed to the force of the vehicle;
Similar results were also observed at other places(35,37,40,41).
VEHICLES IN RTA:
In our study we found total number of vehicles involved were 3030 in
which four wheelers were found to be involved in more than 50% of cases.
This indicates four wheelers were dominating in the roads and the road
infrastructure in and around Madurai has not changed much in the past 50
years and the same old road infrastructure is still in use without giving
much attention to the ever-increasing road vehicles and road traffic
NATURE OF THE ROAD TRAFFIC ACCIDENTS:
Accidents between the four wheelers and two wheelers constituted 31% of
the road traffic accidents in our series and this was followed by the
accidents between the four wheelers and the pedestrian constituting
about 26% of the road traffic accidents in our series and this was followed
by the accidents between the pedestrian and the two wheelers which
accounted for about 20% of the accidents. This can be explained as same
as mentioned in the above columns of pedestrians and different vehicles in
RTA.
TIME OF OCCURRENCE:
Our study has shown the peak hours of road traffic accidents between 12 –
3 pm accounting for about 20% that is one fifth of road traffic accidents.
was closely followed by 9am – 12 pm which accounted for about 16%. This
can be explained as follows:
During the lunch time everyone tend to have a small period of drowsiness
in the post lunch period and if this happens to the drivers then they are
prone to meet with an accident. This is what is known as failure of “BIO –
ADAPTATION”. The noon time is the time period where the four
wheelers movement will be high. 3 – 6 pm and 9 am – 12 pm were the
busiest schedules for the community people to move to their schools,
offices and for other purposes and the same group of people will be
returning back to their homes in the evening time period. Hence these two
time periods that is between 3 – 6 pm and 9 am – 12 pm has to be
considered the busiest time periods of the community as far as our study is
concerned and resulted in more number of accidents. Though people will
be more brisk in the morning time, they will be in a hurry and this makes
will be more tired from their office and school work and tend to have less
attention making themselves vulnerable to the road accidents.
More than 65% of road traffic accidents took place in the day time (6am to
6 pm). Similar results were also observed in Delhi and Pondicherry (35,42)
DAYS DISTRIBUTION:
Our study has showed maximum number accidents on Sundays
accounting for about 21%. This was followed by accidents on Mondays
and Saturdays constituting next major days for accidents. These three
days almost constituted more than 50% of the road traffic accidents. This
could be explained as follows:
Many people working outside the district, state may return to their homes
and return back to work places at the week ends resulting in increased
population migration in and around the district.
This pattern of involvement of RTA is different from other studies such as
from Delhi, California(35,43). The similar finding has been observed from
a study from Pondicherry (42).
MODE OF INJURY:
In this study the common mode of sustaining injury was found to be
knocked down by a vehicle which constituted the major number of traffic
accidents accounting for about 80%. This is followed by traffic accidents
head on collision.
Similar findings were also observed in the studies from Delhi and
Pondicherry(35,42)
This can be explained as follows:
As far as Madurai and the surrounding areas are concerned the traffic
system itself has not fulfilled the requirement of the population, having
small roads, inadequate side walks for the pedestrians, inadequate
pedestrian crossings, etc.
PATTERN OF INJURIES:
In this study multiple injuries has dominated accounting for more
long bones and small bones accounting 35%, 24.8% respectively. When
considering the individual injury pattern injury to the long bones of the body
were found to be at highest risk accounting for more than one third of
cases in our series. Amongst these long bones injuries, bones of the lower
limbs accounted more than 50% of injuries accounting 24%. This was
followed by the injuries to the long bones of the upper limbs accounting for
about 11%. Among the injuries to the small bones, the small bones of the
foot accounted for maximum number of cases – 16% and this was followed
by the injuries to the small bones of upper limb.
Among the long bone injuries which accounted for about 35% of the cases
injuries predominated in the lower limb than in upper limbs in a ratio of
about 2.5 : 1. Tibia was the long bone which sustained maximum number
of open fractures. More than 90% of Tibial fractures were open fractures.
This was followed by the open fractures of the forearm (5%), humerus(3%)
femur(2%) .
Among the small bone injuries, foot injuries accounted for maximum
number of open injuries followed by the hand injuries.
This pattern of analysis of injuries in road traffic accidents is a new concept
that has been adopted by us in this study.
DRIVING LICENSE:
having driving license and about 1% of the drivers of the four wheeler were
found not having driving license.
This study found 11% of drivers of different vehicles were without driving
license, which is higher compared to 7.4% found in Delhi(35).
CELL PHONE USERS:
Among two wheelers 9% were using cell phones at the time of RTAs
Among four wheelers 1% were using cell phones at the time of RTAs
ALCOHOL CONSUMPTION
About 3% of the victims of the two wheeler and 9% of the victims of the
four wheelers were found to have consumed alcohol during the accident.
In the present study 12% of the drivers involved in RTA had consumed
alcohol. This is a higher proportion compared to 4.6% and 8% reported
HELMET WEARING
Among the two wheelers only 6% of the victims had helmet at the time of
road traffic accidents.
No protective gear was used by many of the victims in this study, because
there is no such law in Tamil Nadu or Pondicherry regarding the helmet
use.
SEATBELT WEARING:
None of our victims of four wheelers had seat belt at the time of road
traffic accidents.
All these above parameters indicates that the traffic rules and their
CONCLUSION:
Men are the major victims of road traffic accidents in the age group between 20 – 40
years accounting nearly 50% of the victims in our study. Among the road occupants
pedestrians are the most commonly injured victims in our study accounting 46%.
Our study has identified the people at major risk for road traffic accidents that is the
vulnerable group. These are the target groups who needs active intervention to
create awareness among them to prevent road traffic accidents and to promote
health consciousness while driving a vehicle.
Among the vehicles involved in road traffic accidents four wheeler Vs two wheeler
accidents accounted more than one third in our study. The peak hours of accidents
in our study were between 12 pm – 3 pm. This can be used to create awareness
among the vehicle drivers to be cautious during these hours apart from overall
awareness. Among the days Sundays accounted more than one fifth of road traffic
accidents in our study and this indicates that the general trend of population
migration during the weekends. This can be used to create awareness among the
people and the vehicle drivers informing them about the current trend of road traffic
accidents in and around Madurai. The common mode of injury in our study is being
knocked down by a vehicle which accounted for 80% of the road traffic accidents. In
our study victims sustained multiple injuries accounted 55% which is quite a high
percentage when compared with the older studies and this can used to asses the
medical facilities that are needed to treat all these victims and the mortality and
morbidity that can result from these accidents. Cell phone usage during driving has
accidents in our study were found to have consumed alcohol at the time of road
traffic accidents. These indicates lack of overall awareness about the road traffic
accidents and insufficiency of traffic regulatory system.
Thus our study has brought out some of the trends in the road traffic accidents in
and around the Madurai city that can help the traffic regularization systems in the
following ways:
1. To create awareness among the more vulnerable populations as found in
our study – men, people between 20 – 40 years, pedestrians.
2. To have a target oriented approach to create awareness in the short term
3. To create awareness among the community people in all age groups in
order to reduce and to prevent the road traffic accidents in the long run.
4. Traffic rules are not strictly followed by the people. Hence strict
enforcement of traffic rules.
5. There is no traffic rule to have compulsory wearing of helmet, seat belt,
avoidance of cell phone usage during driving; hence these aspects of
road traffic accidents has to be approached in a systematic manner to
create awareness among the vulnerable population.
6. The future generation must get full awareness about the road rules, their
violations and hazards so that road traffic accidents can be prevented in
the long run. To achieve this road safety education has to be included in
the curriculum.
Road traffic safety is an outcome of interactions in integrated system of
sub-systems is disturbed the chances of accident occurrence would
increase. Any efforts to enhance the safety of road traffic operations
should be based on an integrated approach to preserve and promote the
harmony of these three subsystems. In comparison to developed
countries the traffic accident characteristics and nature of accidents are
considerably different in India. To enhance the road safety condition a
large number of strategies can be employed but they need to be
analyzed in terms of Indian conditions in order to acquire optimum
benefits. Our study is such a kind of one and this can be used in
planning the road safety measures like
1. Improvements in the road infrastructure such as adequate
pedestrian walks, removal of road encroachments etc.
2. Proper enforcement of traffic rules
3. Making new traffic rules as needed on today
4. Improving the driving skills of the drivers
5. improving the standards of the driving vehicles and their
maintenance
6. Proper efforts to create awareness among the most vulnerable
population in the short term and among the all age group people
of the community so that road traffic accidents can be prevented
Bibliography:
1. Kopits E, Cropper M. Traffi c fatalities and economic growth. Washington, DC,
The World Bank, 2003 (Policy Research Working Paper No. 3035).
2. Murray CJL, Lopez AD, eds. The global burden of disease: a comprehensive
assessment of mortality and disability from diseases, injuries, and risk factors in
1990 and projected to 2020. Boston, MA, Harvard School of Public Health, 1996.
3. The world health report 2001. Mental health: new understanding,
new hope. Geneva, World Health Organization, 2001.
4. Peden M, McGee K, Sharma G. The injury chart book: a graphical overview of the
global burden of injuries. Geneva, World Health Organization, 2002
(http://www.who.int/violence_injury_ prevention/injury/chartbook/chartb/en/,
accessed 30 October 2003).
5. Jacobs G, Aeron-Thomas A, Astrop A. Estimating global road fatalities.
Crowthorne, Transport Research Laboratory, 2000 (TRL Report, No.445).
6. Peden M, McGee K, Krug E, eds. Injury: a leading cause of the global burden of
disease, 2000. Geneva, World Health Organization, 2002 (http:
7. Nantulya VM, Reich MR. The neglected epidemic: road traffi c injuries in
developing countries. British Medical Journal, 2002, 324: 1139–1141.
8. Nantulya VM et al. The global challenge of road traffi c injuries: can we achieve
equity in safety? Injury Control and Safety Promotion, 2003, 10:3–7.
9. Transport safety performance in the EU: a statistical overview. Brussels,
European Transport Safety Council, 2003.
10. Murray CJL et al. The Global Burden of Disease 2000 project: aims, methods
and data sources [revised]. Geneva, World Health Organization, 2001
(GPE Discussion Paper No. 36).
11. Gururaj G, Thomas AA, Reddi MN. Underreporting road traffi c injuries in
Bangalore: implications for road safety policies and programmes. In: Proceedings of
the 5th World Conference on Injury Prevention and Control. New Delhi, Macmillan
India, 2000:54 (Paper 1-3-I-04).
12. Varghese M, Mohan D. Transportation injuries in rural Haryana, North India. In:
Proceedings of the International Conference on Traffi c Safety. New
13. Mohan D. Traffi c safety and health in Indian cities. Journal of Transport and
Infrastructure, 2002, 9: 79–92.
14. Martinez R. Traffic safety as a health issue. In: von Holst H, Nygren A, Thord R,
eds. Traffic safety, communication and health. Stockholm, Temaplan AB, 1996.
15. Evans L. Traffi c safety and the driver. New York, NY, Van Nostrand Reinhold,
1991.
16. Mock CN et al. Incidence and outcome of injury in Ghana: a community-based
survey. Bulletin of the World Health Organization, 1999, 77: 955–964.
17. London J et al. Using mortuary statistics in the development of an injury
surveillance system in Ghana. Bulletin of the World Health Organization,
2002, 80:357–362.
18. Mock CN et al. Long-term injury-related disability in Ghana. Disability and
Rehabilitation, 2003, 25:732–741.
19. Odero W, Garner P, Zwi A. Road traffic injuries in developing countries: a
comprehensive review of epidemiological studies. Tropical Medicine and
20. Barss P et al. Injury prevention: an international perspective.
New York, NY, Oxford University Press, 1998.
21. Transport accident costs and the value of safety. Brussels,
European Transport Safety Council, 1997.
22. Blincoe LJ et al. The economic impact of motor vehicle crashes 2000.
Washington, DC, National Highway Traffi c Safety Administration, 2002
(Report No. DOT HS-809-446).
23. Odero W, Khayesi M, Heda PM. Road traffic injuries in Kenya: magnitude, cause
and status of intervention. Injury Control and Safety Promotion,
2003, 10:53–61.
24. Ad Hoc Committee on Health Research Relating to Future Intervention Options.
Investing in health research and development. Geneva, World
Health Organization, 1996 (TDR/Gen/96.2).
25. Koornstra M et al. Sunfl ower: a comparative study of the development of road
safety in Sweden, the United Kingdom and the Netherlands. Leidschendam, Institute
26. Roberts I, Mohan D, Abbasi K. War on the roads [Editorial]. British Medical
Journal, 2002, 324:1107–1108.
27. Allsop R. Road safety: Britain in Europe. London, Parliamentary Advisory
Council for Transport Safety, 2001 (http://www.pacts.org.uk/ richardslecture.htm,
accessed 30 October 2003).
28. Waters H, Hyder AA, Phillips T. Economic evaluation of interventions to reduce
road traffi c injuries: with applications to low and middleincome countries. Asia Pacifi
c Journal of Public Health, in press.
29. Road traffi c accidents: epidemiology, control and prevention.
Geneva, World Health Organization, 1962.
30. Loimer H, Guarnieri M. Accidents and acts of God: a history of terms. American
Journal of Public Health, 1996, 86:101–107.
31. Nader R. Unsafe at any speed, 2nd ed. New York, NY, Grossman Publishers,
1972.
32. Haddon Jr W. The changing approach to the epidemiology, prevention, and
descriptively. American Journal of Public Health, 1968, 58:1431–1438. 33.
Henderson M. Science and society. Recovery, 1996, 7:28–29.
34. Trinca GW et al. Reducing traffic injury: the global challenge. Melbourne, Royal
Australasian College of Surgeons, 1988.
35. Indian Express Aug. 2005.
36.journal of Indian medical association vehicular accidents,1992; 90(12);
309-12
37.Chunil C, Huichun W, Xiaohong S. the investigation and analysis of
thousand cases of traffic injury emergencies. Proceedings of international
conference of traffic safety 27-30 January 1991; New Delhi, India.
38.Balogan JA, Abreoje OK. Pattern of road traffic accidents in a Nigerian
university. Trop Med Hyg 1992; 95; 23-9.
39.Ranganathan N, Guptha S, Raju MP. Spatial and temporal characteristics
of accidents in a metropolitan city 1991. Proceedings of international
40.Sood S. Survey of seven factors influencing injury among riders involved in
motorized two wheeler accidents in India; a prospective study of 302 cases.
Journal of Trauma 1998 ;28(4) : 530- 4
41.WHO. Road Traffic Accidents in developing countries. Technical report
series No. 73. WHO Geneva 1984, 2004.
42. Indian journal of community medicine Vol. xxix, no. 1, January – March
2004. Epidemiological study of Road Traffic accident cases: A Study From
PROFORMA:
Name: Age: Sex:
IP.NO: Date of Admission: Date of Discharge:
Mode of travel:
Nature of RTA:
Time of RTA:
Injury surveillance
S.No Injured part yes No
1. Head injury
2. Chest injury
3. Abdominal injury
4. Pelvic injury
5. Small bone injury
6. Driving license
7. Long bone injury
8. Alcohol consumption
9. Helmet wearing