Investigation of the Ultrafast Dynamics Occurring During
Unsensitized Photocatalytic H
2
Evolution by an
[FeFe]-Hydrogenase Sub-site Analogue
Pim W. J. M. Frederix,
1,2Katrin Adamczyk,
1Joseph A. Wright,
3Tell Tuttle,
2Rein V. Ulijn,
2Chris-topher J. Pickett
3* and Neil T. Hunt
1*
1
Department of Physics, University of Strathclyde, SUPA, Glasgow G4 0NG, United Kingdom
2WestCHEM, Department of Pure and Applied Chemistry, University of Strathclyde, Glasgow G1 1XL, United
King-dom
3
Energy Materials Laboratory, School of Chemistry, University of East Anglia, Norwich Research Park, Norwich
NR4 7TJ, United Kingdom
Supporting Information Placeholder
ABSTRACT: Biomimetic compounds based upon the active sub-site of the [FeFe]-hydrogenase enzyme system have been the focus of much attention as catalysts for hydrogen pro-duction; a clean energy vector. Until recently, use of hydrogenase sub-site systems for light-driven hydrogen pro-duction has typically required the involvement of a photo-sensitizer, but the molecule [(μ-pdt)(μ-H)Fe2(CO)4(dppv)]+,
(dppv = cis-1,2-C2H2(PPh2)2; pdt = 1,3-propanedithiolate), 1,
has been reported to catalyze the evolution of hydrogen gas under sensitizer-free conditions. Establishing the molecular mechanism that leads to photohydrogen production by 1 is thus an important step that may enable further development of this family of molecules as solar fuel platforms. Here, we report ultrafast UVpump-IRprobe spectroscopy of 1 at three
dif-ferent excitation wavelengths and in a range of solvents, in-cluding under the conditions required for H2 production.
Combining spectroscopic measurements of the photochemis-try and vibrational relaxation dynamics of 1 with ground-state Density Functional Theory (DFT) calculations shows that, irrespective of experimental conditions, near instanta-neous carbonyl ligand loss is the main photochemical chan-nel. No evidence for a long-lived excited electronic state was found. These results provide the first time-resolved data for the photochemistry of 1 and offer an alternative interpreta-tion of the underlying mechanism of light-driven hydrogen generation.
The need to move away from fossil fuels towards renewable energy sources has generated significant interest in the use of solar radiation to drive novel methods of hydrogen produc-tion. One possible route that has been identified employs photocatalysis using structural analogues of active sites of the hydrogenase enzymes. The enzymes themselves are ex-tremely effective catalysts of the reduction of protons to dihydrogen in vivo but are not technologically viable for sev-eral reasons, not least their sensitivity to oxygen.1 In recent years, it has been shown that many synthetic compounds based loosely on the active site structure of these enzymes
also have the ability to produce hydrogen.2-9 These iron- or nickel-based mimics are particularly attractive as they offer the possibility of replacing the platinum-based systems cur-rently in technological use with more economically-viable materials.
Of particular relevance here, a series of compounds based around the (dithiolate)Fe2(CO)6-xLx architecture, where L
represents a non-carbonyl ligand, have been shown to yield H2 with varying degrees of success.6-8, 10 In each case
howev-er, light-driven hydrogen production required the use of a photosensitizer, such as a ruthenium tris(bipyridyl) deriva-tive, either covalently bound to the sub-site analogue11 or as a secondary component in solution,10 as well as a source of electrons. In contrast, it has recently been reported that an asymmetrically substituted, protonated analogue (μ-pdt)(μ-H)Fe2(CO)4(dppv)(PF6) (1, dppv = cis-1,2-C2H2(PPh2)2) can
catalyze the hydrogen evolution reaction (HER) in the ab-sence of a photosensitizer when irradiated with a light source at a wavelength (λ) > 400 nm.12 The 1-catalyzed HER achieved 4 turnovers during continuous irradiation.
A mechanism for H2 evolution by 1 under these conditions
was proposed (see Scheme 1) whereby protonation by triflic acid (HOTf) upon irradiation produced a dicationic species. This subsequently generated H2 by reductive elimination,
after which the 32e- complex could be reduced by octa-methylferrocene (Fc#) and protonated to complete the cata-lytic cycle. In the absence of Fc#, the 32e- complex was pre-dicted to degrade quickly by CO loss in solution at room temperature.12, 13 Crucially, this mechanism requires the pres-ence of an electronically excited state of 1 in which the bound proton becomes more hydridic than in the ground state, fa-cilitating attack by a proton and evolution of dihydrogen. The 1-catalyzed HER mechanism was further investigated theoretically using time-dependent density functional theory (TD-DFT). 14 The results suggested that excitation of 1 at 400 nm was likely to access the required type of excited state; leading either to photolysis or elongation of one Fe-S bond in the Fe2S2 cluster. The predicted result of this was asymmetry
char-acter into the bridging hydride and facilitated its release in the presence of a strong acid. It was stated however that the specific pathway was highly dependent upon the excited state lifetime of the complex, which has hitherto not been measured.
This photocatalytic system is an attractive prototype in that it does not involve precious-metal-containing photosensitiz-ers. A detailed understanding of its excited states and their photochemistry is however central to future development as a photohydrogen production platform. An important ques-tion relates to the tendency of 1 toward CO photodissociation, a process that has been found to be ubiq-uitous in the photochemistry of metal carbonyls.15-19 Studies of the photochemistry of hydrogenase-based biomimetic compounds are limited and tend toward excitation at wave-lengths shorter than 400 nm but, in all of these cases, car-bonyl ligand photolysis has been a predominant outcome and it has also been a feature of longer wavelength studies.
20-25
It is therefore imperative that experimental verification of predictions suggesting that CO photolysis is expected only to be a minor product of 1 excitation is obtained.
+
CO CO Fe Fe
S S CO
H OC
P PPh2
Ph2
CO CO Fe Fe
S S CO OC
P PPh2
Ph2
CO CO Fe Fe
S S CO OC
P PPh2
Ph2
+
2
2 Fc#+ 2 Fc#
H+
h H2
H+
1
eq eq
ap dppv
Scheme 1. Structure of 1 and previously proposed mechanism of H2 evolution.12 Top: (μ-pdt)(μ-H)Fe2(CO)4(dppv)(PF6), 1, PF6 counterion not depicted. Apical (ap), equatorial (eq) and dppv-side (dppv) carbonyl ligands are identified as per use in text.
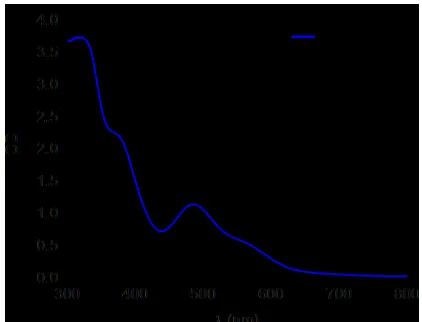
In order to understand the intimate processes underpin-ning the photochemistry of this system, we report time-resolved infrared (TRIR) spectroscopy of 1 following photoexcitation at three different pump wavelengths λpump =
335, 490 and 572 nm, resonant with three absorption bands in the UV/Vis spectrum (Fig. 1). These experiments were performed in three solvents, dichloromethane (DCM), ace-tonitrile (MeCN) and methanol (MeOH) to determine the influence of the environment and finally under the condi-tions reported for the HER12 in order to compare the basic solution-phase photochemistry of 1 with that occurring dur-ing hydrogen evolution. The measurements were supported by ground state DFT calculations and infrared pump-probe data to fully characterize the processes occurring immediate-ly after absorption of a UV-visible wavelength photon.
Materials and methods
Compound 1was prepared with the PF6- counterion
accord-ing to literature methods.26 DCM, MeCN and MeOH were purchased from Sigma-Aldrich (>99%) and deoxygenated by
purging with N2 for >10 minutes prior to use. All sample
ma-nipulations were performed under a N2 atmosphere in a
glove box.
Fig 1. UV/Vis absorption of 1(concentration: 0.5 mM, path length 1 cm) in DCM. Black Gaussian lineshapes indicate the excitation profiles used in TRIR experiments.
Fourier Transform infrared (FTIR) spectroscopy
1 was dissolved to a concentration of ~10 mM, except in MeOH where the solubility was found to be significantly lower than in DCM and MeCN and so the supernatant of a saturated solution was used instead (estimated concentration 4-5 mM by optical density (OD)). Samples were contained in a standard IR transmission cell featuring two 2 mm CaF2
windows, separated by a polytetrafluoroethylene (PFTE) spacer of 50 µm thickness. Spectra were recorded on a Bruker Vertex 70 spectrometer; averaging 25 scans at a spectral reso-lution of 1 cm-1.
UV/Vis absorbance spectroscopy
Samples for UV/Vis spectroscopy were prepared at ~0.5 mM concentration in the three solvents. Samples were measured in a quartz cuvette with a path length of 1 cm, to reflect the OD used in TRIR measurements below. Spectra were recorded on a Jasco V-660 spectrophotometer at a scan rate of 100 nm/min with an excitation bandwidth of 3 nm.
Time-resolved infrared (TRIR) spectroscopy
All samples for TRIR spectroscopy measurements were prepared as for the FTIR measurements. Details of the TRIR experiments have been described elsewhere.27 Briefly, ultrashort laser pulses (800 nm, 35 fs, 1 kHz) were produced via a regeneratively-amplified Ti:Sapphire laser system and used to pump two white light-seeded optical parametric am-plifiers (OPA).
[image:2.612.332.543.78.239.2]OPA. These pulses had a centre frequency near 2000 cm-1 and a bandwidth of around 350 cm-1 FWHM.
The time delay between the pump and probe pulses was controlled using an optical delay line and the respective po-larization directions of the pump and probe beams were set to the magic angle (54.7°) throughout to eliminate the effects of molecular rotation. After overlapping the pump and probe beams in the sample, the probe was spectrally dispersed in a spectrometer and imaged onto a 64-channel HgCdTe array detector. Chopping the pump pulse train at half the laser repetition rate facilitated collection of pump on – pump off difference TRIR spectra. The signals were found to be linearly proportional to the pump pulse energy under all conditions studied.
The cell holder was continuously rastered in both horizon-tal and vertical directions during the measurements to con-tinuously refresh the sample. Monitoring of the sample qual-ity via FTIR was performed periodically throughout the ex-periment.
For IRpump-IRprobe experiments, a similar setup was used but
the IR OPA provided both pump and probe radiation.In this case, the mid-IR output of the OPA was split using a wedged CaF2 beamsplitter to produce high intensity pump (~90%)
and low intensity probe beams (~5%). The probe beam was fed through an optical delay line to control the inter-pulse timing. Once again the pump beam was chopped at 500Hz and the respective polarizations of pump and probe pulses were set to magic angle conditions.
Density Functional Theory (DFT) calculations
Ground-state structure optimisations and frequency calcu-lations were performed using Gaussian 0928 employing the M06L functional, which is generally suitable for transition metal complexes.29 The triple zeta 6-311+G(d,p) basis set was used on all atoms except Fe, for which the LANL2DZ effec-tive core potential30 was used. Calculations were performed in the C1 point group on a close analogue of 1 without
coun-terion, where phenyl rings were replaced by methyl groups in vacuum, which was found to have only a minor effect on the CO stretching frequencies. CO dissociation energies were calculated by subtracting the optimised photoproduct ener-gies from the parent molecule energy. Photoproduct fre-quency calculations were performed using the reoptimised structures of both the CO-loss products and CH3CN adducts
(N pointing towards Fe). An empirically determined scaling factor of 0.975 was used to correct the calculated frequencies for the anharmonicity of the potential energy well and basis set truncation.
Results and discussion
FTIR spectroscopy and DFT calculations
Fig. 2(a) displays the recorded FTIR spectrum of 1 in DCM solution. In the region of the spectrum where absorptions due to stretching vibrational modes of the metal carbonyl ligands are expected, four peaks were observed, located at 1979, 2038, 2052 and 2099 cm-1 and labeled I-IV respectively. These are entirely consistent with previous studies of 1.12, 26 FTIR spectra of the corresponding solutions in MeCN and MeOH can be found in the Supporting Information (SI), Fig. S1. Little substantive variation of the IR spectrum with sol-vent was noted although absorptions II and III were found to appear closer together in MeCN (2042 and 2049 cm-1) than in the other two solvents.
The absorption maxima in all FTIR spectra agree very well with the scaled frequencies predicted by DFT calculations, as shown in Fig 2(a). Using the DFT output, the four observed bands can be assigned as follows: mode (I) is attributed to the isolated COdppv stretching mode (see Fig.1 for CO ligand
identification). Modes II and III are the two asymmetric stretching modes of the Fe(CO)3 unit while mode IV is the
symmetric stretching mode of this moiety. It is interesting that modes II and III are predicted to be near-degenerate by DFT (in vacuum or implicit solvent) so the reason for the observed solvent-dependent splitting remains unclear.
Fig 2. (a) FTIR spectrum of a 10 mM solution of 1 in DCM. Red squares and droplines represent the DFT-calculated absorp-tion frequencies of 1. (b) TRIR (λpump = 572 nm) difference spec-tra of 1 in DCM at a range of pump-probe delay times (ps).
TRIR spectroscopy
Fig. 2(b) contains representative TRIR difference spectra for 1 in DCM at a range of pump-probe delay times following excitation at a wavelength (λpump) of 572 nm. These results
will be discussed in detail and will then form a basis for dis-cussions of solvent- and wavelength-dependent effects in a subsequent section. A comprehensive set of corresponding spectra for all combinations of pump wavelength and solvent can be found in the SI (Fig S2).
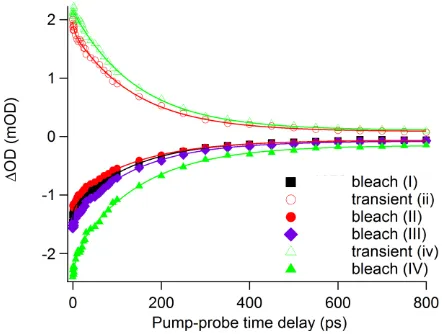
[image:3.612.320.555.155.438.2]functions. The time-dependences of the amplitudes of all of the observed peaks were then fit to exponential functions with a vertical offset to account for the fact that recovery of the peaks is incomplete (<10%) at pump-probe delay times approaching 1 ns. The results of this process are presented in Fig 3 and Table 1.
The observed bleaches exhibit recovery on two timescales in the ranges 2-13 ps and 139-151 ps, arising from regeneration of the parent molecule ground state population. Such biexponential kinetics have been observed previously in simi-lar studies of hydrogenase model compounds.21, 22, 24, 31 The faster timescale was widely attributed to electronic relaxation or cooling of vibrationally ‘hot’ species,22, 32 while the longer timescale was attributed to the geminate recombination of species that have undergone CO photolysis upon photoexcitation.20-25 This model is broadly consistent with the data observed here.
In the case of the transient absorptions, peaks i, ii and iv all show exponential decay kinetics with a timescale of 128-145 ps. In the case of peaks i and iv the dynamics were found to be mono-exponential while for mode ii they were better rep-resented by a biexponential function with a fast component of 3.7 ps. It should be noted that the decay time of i was somewhat difficult to extract due to its low intensity and overlap with bleach I. Indeed, it was observed that the peak i
was best-represented by the wing of a broad Gaussian feature centered at 1988 cm-1, somewhat to the higher frequency side of bleach I but which shifted slightly to the red with a time constant of 9 ps in addition to the reduction in amplitude. This behavior will be discussed further below. Overall, these timescales are in close agreement with the dynamics ob-served for the bleaches suggesting that the longer timescale process is involved in the recovery of both the positive and negative peaks. It is noticeable that the fast dynamics ob-served in the parent mode recovery is absent for the majority of the photoproduct bands.
Figure 3. Temporal dependences of the amplitudes of peaks observed in TRIR spectroscopy measurements of 1 in DCM with an excitation wavelength of λpump = 572 nm. Open and closed symbols indicate transient absorption and bleach peaks, re-spectively. Solid lines display the results of fitting an exponen-tial function to the data.
In general, transient absorption peaks in a TRIR spectrum originate from two sources, which can be hard to separate: (1) peaks due to vibrationally hot parent molecules, which
generally appear redshifted relative to the parent bleaches because of the effects of vibrational anharmonicity and (2) peaks due to photoproducts or from electronically-excited states that form on the fs-ps timescale. The assignment of these bands is, however, crucial to obtaining insight into the mechanism of the HER catalyzed by 1. In order to shed some light on the relative contributions in this case, a broadband IRpump-IRprobe experiment (λpump = λprobe = 1850-2150 cm-1) was
[image:4.612.311.566.220.390.2]performed on 1 in DCM to determine the signature of vibrationally-excited ground state species, both in terms of anharmonicities and the relaxation dynamics of the transi-tions.
Table 1. Exponential decay parameters (in ps) for selected peaks.
Data extracted from TRIR spectroscopy of 1 in DCM with an exci-tation wavelength of λpump = 572 nm. Standard error of fit is shown
in brackets.
Freq. (cm-1)
Assignment τ1
(ps) τ2 (ps)
% offset > 1ns
1954a Photoproducts (i) - 128
(5.4)
0.3
1979 Bleach (I) 2.0
(0.4) 139 (4.5)
4.5
2024 Photoproducts (ii) 3.7
(1.5) 143 (4.8)
4.5
2038 Bleach (II, overlap photo-products)
13 (3.1)
147 (6.5)
5.1
2052 Bleach (III) 9.4
(3.6) 141 (6.1)
5.0
2078 Photoproducts (iv) - 145
(4.0)
5.1
2099 Bleach (IV) 12
(4.0) 151 (9.2)
6.4
a
: Low intensity maximum observed at 1954, but likely situated around 1988 cm-1 due to overlap with bleach I, see text.
IRpump-IRprobe spectroscopy
The IRpump-IRprobe spectra recovered for 1 in DCM are
[image:4.612.62.283.448.615.2]re-spectively, with the associated transient absorption peaks ( i’-iv’) displaying similar timescales (the fitting results are shown in detail in Table S1). These values are broadly con-sistent with those observed for similar systems25, 33 though it is unusual that the COdppv ligand shows a significantly
short-er vibrational relaxation time and largshort-er anharmonic shift between the v=0-1 and v=1-2 peaks than the other modes. This could indicate a strong influence on the vibrational re-laxation mechanism of this ligand by the electron-donating phosphorus groups. For example, stronger coupling could occur between the mode I and dppv-derived modes, or the lower frequency of mode I could increase interactions with overtone or combination band modes featuring lower fre-quency vibrational modes of the molecule.
Overall, the IR pump-probe spectroscopy results show that the red-shifted peaks observed in the TRIR data following UV-visible excitation do not originate solely from vibrationally-excited parent (1) species. This conclusion de-rives from differences in the peak positions, the observed bleach-to-transient peak intensity ratios (most notably peaks
i/I compared to i’/I) and the dynamics between the two ex-periments. In particular, although some coincidences of the peak positions arise in the two experiments, the vibrational lifetime measurements indicate that the >100 ps timescales observed in TRIR experiments are too slow to be due to vi-brational relaxation alone.
Figure 4. (a) IRpump-IRprobe difference spectrum of a 10 mM
solu-tion of 1 in DCM. Horizontal bars indicate the anharmonicity of the v=1-2 transitions. (b) Temporal dependences of the peaks shown in (a). Open and closed symbols indicate excited vibration-al state transient absorption and bleach peak heights, respectively.
Solid lines display the best mono-exponential fit to the data. Note the different horizontal axis compared to Fig. 3.
DFT calculations of Photoproduct Species
To determine possible contributions to the TRIR spectrum (Fig. 2(b)) from photoproducts generated by UV-visible exci-tation, DFT geometry optimizations and frequency calcula-tions were performed on several candidate photoproducts. These included species arising from CO-loss, which would be expected to be present based on previous studies of the pho-tochemistry of hydrogenase sub-site analogues and is further indicated by the similar dynamics for the TRIR peak recovery reported above to previous work on similar systems.20-25 Ground state carbonyl ligand dissociation energies were calculated to be 40, 47 and 57 kcal/mol for the COap, COeq
and COdppv ligands respectively, in reasonably good
agree-ment with the TD-DFT results reported previously (45, 51 and 58 kcal/mol, respectively). 14 It is noteworthy that the available photon energies at 335, 490 and 572 nm are 85, 58 and 50 kcal/mol, respectively, suggesting that, even at the longest wavelength studied, CO dissociation is by no means prohibited, though it may be approaching the limit at which it is possible for the COdppv ligand at longer wavelengths.
Fig. 5(a) shows the results of the DFT frequency calcula-tions of each of the possible tricarbonyl species arising from CO photolysis, alongside that of the ground state molecule. It can be seen that, upon photolysis of a COeq or COap ligand,
the absorptions related to peaks II-IV are predicted to shift towards lower frequencies by 25-36 cm-1. These are in good agreement with the two most intense transient absorptions (ii, iv) observed in Fig 2(b) and offered the closest agreement with the experimental data of the candidates studied. It is noteworthy that the lowest frequency absorption (i) demonstrates a predicted 5-10 cm-1 blueshift relative to the parent mode (I) in contrast to the redshift predicted for peaks ii-iv. This would be consistent with the TRIR results obtained when fitting peak i to Gaussian profiles, mentioned above, which indicated a blue-shifted position for this mode relative to the parent molecule absorption. The larger linewidth and unusual dynamics of this feature, which is assigned to the COdppv ligand stretching vibration of the
COap,eq-depleted photoproduct, are also consistent with the
different vibrational relaxation dynamics observed for same vibrational mode of the parent from the IRpump-IRprobe
exper-iments. This suggests stronger anharmonic coupling to lower frequency modes is present, giving rise to the more complex lineshape and temporal behavior observed. While the posi-tion of peak i is also consistent with vibrationally-excited parent molecules, the timescale for the relaxation of this peak, which is similar to that of the main photoproduct bands, suggests that it has its major origins elsewhere. When the COdppv ligand is dissociated, little or no shift in the
frequencies of the remaining Fe(CO)3 unit was predicted,
which will make transient absorptions due to this species difficult to discern due to overlap with the bleaches. The effects of loss of this ligand will however affect the relative bleach intensities observed.
[image:5.612.54.279.316.671.2]repopulation of the ground vibrational state of the parent species. The timescales for vibrational relaxation of the par-ent v=1 level were observed to be longer than the ~10 ps time-scales derived from TRIR data suggesting that any contribu-tion from cooling is mainly occurring in elevated, short-lived, electronic states.
To test this hypothesis, the TRIR spectrum at a pump-probe time delay of ~ 3 ps was simulated by summing the various contributions from the relative intensities and fre-quencies from the DFT calculations of the photoproduct spectra along with the experimental IRpump-IRprobe results and
the FTIR spectrum. The result is displayed in Fig. 5(b) (blue trace). The best agreement with the TRIR data (pink) was found when assuming that CO dissociation occurs equally across all 4 carbonyl ligands and that vibrationally excited parent molecules account for ~10% of the signal. The line widths of the bleaches and transients were assumed to be equal to those of absorptions in the FTIR spectrum (FWHM 19, 14, 12 and 7.7 cm-1 for I-IV respectively), although the fit to peak i required a broader line width (FWHM 40 cm-1) as dis-cussed above, which was included. To aid interpretation, a comparison of predicted photoproduct peaks and the spec-trum corrected for bleaches and vibrationally excited contri-butions is added in the Supplementary Information (Fig. S3). Overall, the level of agreement between with the experi-mental spectrum is compelling in support of assignment of the transient absorptions to CO loss photoproducts.
Photoproducts other than those arising from CO loss were considered though none produced as good an agreement with the experimental data. We did not manage to find a DFT-optimized stable structure with an elongated Fe-S bond, as previously predicted, 14 and so were unable to calculate a spectrum for such a species. However, as thiolates are an electron-donating ligand similar to phosphines, the S-dissociated photoproduct would be expected to have a blue-shifted IR absorption profile, not matching the redshift that we have observed.22 Some presence of an electronic excited state following excitation is indicated by the ~10 ps decay observed in most of the bleaches (see Tables 1 and S2), alt-hough this is not sufficiently long-lived as to undergo chem-istry, even at a diffusion-limited rate. The presence of a long-lived Fe-S dissociated species, as proposed,1 seems unlikely; the dithiolate ligand would still be mono-dentate bound to the iron center and so cannot escape, while recombination is practically barrierless at room temperature as indicated by excited state calculations. It is thus more likely this Fe-S dis-sociated species has a sub-ps lifetime and was therefore not observed in our experiments. It is, however, possible, given the predicted large number of excited states available follow-ing excitation, 14 that a fast relaxation process is available whereby a large number of excited states relax very rapidly into the dissociative MLCT state and we hope these results will provoke further study of these systems.
Comparison of different UV/Vis wavelengths and solvents
UV/Vis excitation TRIR experiments were carried out at three different wavelengths (λpump = 335, 490 and 572 nm)
and in three solvents: apolar DCM, polar MeCN and protic MeOH. While the results in DCM at 572 nm have been dis-cussed in detail above, all other TRIR spectra can be found in the Supporting Information (Fig. S2). The spectra were found to be largely independent of wavelength and solvent envi-ronment, indicating that the CO loss pathway observed for 1
[image:6.612.317.559.234.511.2]excited at 572 nm in DCM solutions is the major photochem-ical pathway detected for all combinations of wavelength and solvent. Some small changes in dynamic timescales were noted as the solvent or excitation wavelength was varied. The CO recombination rate was slightly faster in DCM when av-eraged over all pump wavelengths (132 ps vs. 142 ps for MeCN and 153 ps for MeOH), and slightly faster at shorter wave-lengths when averaged over all solvents (134 ps at 335 nm vs. 147 and 148 ps for 490 and 572 nm, respectively). The details of the fitting results are shown in Table S2 Additionally, at short pump-probe time delays, the transient absorptions were found to be broader at the shorter pump wavelengths (Fig. S2(a, d, g)). This effect is assigned to the more pro-nounced generation of vibrationally hot photoproduct when greater photon energies are employed, as they exhibit nar-rowing and slight blueshifting on a fast (< 30 ps) timescale as the vibrational energy in the photoproducts dissipates.
Figure 5. (a). DFT-predicted frequencies for 1 (negative peaks) and
the three carbonyl loss products. Note that loss of either of the two apical carbonyl ligands gives the same spectrum. (b) Compar-ison of DFT-predicted TRIR spectrum with (scaled) experimental results at λpump = 572 nm and a pump-probe time delay of 3 ps.
Predicted frequencies were convoluted with a Gaussian function with the predicted intensity (see (a)) and experimental line widths to match the FTIR results for bleaches (FWHM 19, 14, 12 and 7.7 cm-1), although for peak i a FWHM of 40 cm-1 was used (see text).
The lack of a strong wavelength dependence of the TRIR data is not without precedent as experiments on various metal carbonyls including hydrogenase sub-site analogues have indicated CO loss to be a major pathway at most UV-vis excitation wavelengths studied.15-19, 21-25, 27, 31 Moreover, DFT calculations have indicated that most of the electronic transi-tions of 1 with λ > 400 nm show a significant quantity of FeCO character.12
Despite the overall similarity of the TRIR datasets, it was however also noted that irradiation of 1 at shorter
lengths led to indications of additional photochemistry channels being activated, albeit in small proportion; repre-senting ~5% of the total TRIR signal. As a result of this small proportion, the spectral contributions were more clearly vis-ible when the TRIR data were normalized to the largest bleach at all pump-probe delays, as shown in Fig. S4. After photo-excitation, positive peaks were observed to grow into the spectrum at 2088,2005 and 1954 cm-1, showing a slight red-shift from the parent absorptions. This effect was only clearly observed when exciting at 335 nm and 490 nm in DCM and 335 nm in MeCN (Fig. S4 (a, b, d)). As the growth of these bands takes place on the time scale of 1-10 ns, a time-scale that is poorly-defined given the temporal range of the spectrometer used, these are assigned to the result of diffu-sive processes, presumably affecting the small amount of photoproducts that have not reverted to the parent molecule by these times. In support of this, it can be seen that the quantity of the TRIR signals not recovering on ~1 ns time-scales increases as the excitation wavelength decreases (see Table S3).
One possible explanation of these new peaks is the for-mation of a solvent adduct after a CO ligand has been lost.16,
17, 19, 22-25, 27
Indeed, all the CO ligand vibrational mode fre-quencies were predicted by DFT calculations to redshift by an average of 6 cm-1 relative to those of 1 when simulations were performed on a MeCN molecule coordinating via its nitrogen atom lone pair as a solvent adduct to the vacant site on the Fe after CO loss (see SI, Fig. S5). However, previous observations of solvent adducts have suggested that they form from the first solvation sphere of the CO-depleted spe-cies and so occur from relatively early pump-probe delay times, in contrast to these observations.
An alternative explanation is available from reports that isomerization of 1 is possible on the dppv side by the COdppv
ligand moving from the axial to an equatorial position (see Fig. S6).26 This process would be facilitated by dissociation of COdppv, which would explain why it is only observed at
short-er wavelengths, when the excitation enshort-ergy clearly exceeds the predicted dissociation energy of this carbonyl ligand. The DFT-predicted absorption frequencies of this isomer agree well with the rise of a peak around 2005 cm-1, however, in general, a slight blue shift of the parent bands is predicted upon isomerization, though this shift is small and by no means enough as to be outside the error margins of the DFT predictions. The energy difference between these two iso-mers was calculated to be 6.9 kcal/mol, so it is not unlikely the molecule can form the axial-equatorial isomer upon re-combination. That the effect is only observed on diffusive timescales can be explained by geminate recombination re-producing the parent isomer only, with no time for isomeri-zation.
A final explanation for these minor photochemical chan-nels is the formation of deprotonated version of 1. Fig. S7 displays the evolution of the TRIR spectrum for samples irra-diated constantly at 490 nm for ~160 mins, as opposed to normal datasets where the sample was replaced after around 15 mins. The spectrum shows new negative peaks appearing at 1952 cm-1 (with associated transient at 1933 cm-1) and ~2017 cm-1 (on top of an initial transient). These new negative peaks arise from the pumping of progressively and slowly, generated species in solution, leading to the appearance over time of new ‘parent bleaches.’ The frequencies of these new peaks match very well with the frequencies of the
deproto-nated form of 1, (μ-pdt)Fe2(CO)4(dppv),12 suggesting that
MeOH can act as a base under conditions including tion. No deprotonated product was observed without irradia-tion on the same timescale (Fig. S8), showing that the effect requires optical excitation. This assignment is not conclusive however, a weak IR absorption observed in the spectrum of the deprotonated species at 1912 cm-1 could not be resolved in either the ultrafast or the long-irradiation dataset; likely due to its low intensity or overlap with the broad, positive peak at 1933 cm-1. Furthermore, the additional peaks observed in the TRIR data on ns timescales were most clearly observed in the DCM and MeCN samples, which are less basic solvents than MeOH. The lower concentration and somewhat broader spectral linewidths observed for MeOH solutions will make observation in this solvent more challenging however. Overall, the small size of the new peaks and the fact that the regions of the spectrum in which they occur is congested means that a definitive assignment is difficult. The most like-ly explanation is given by recombination isomerization and formation of deprotonated parent molecule. The former ex-plains the peaks at 2005 and 2088 cm-1 based on DFT calcula-tions while the 1954 cm-1 peak is best explained by the deprotonation pathway detected most clearly when the sam-ple was allowed to degrade. Thus, two very minor photo-chemical pathways would seem to exist in which the CO-depleted photoproduct of 1 undergoes isomerization or deprotonation upon diffusive (not geminate) CO recombina-tion.
The deprotonation pathway could perhaps be driven by a slightly more acidic proton being caused by asymmetry in the bridging hydride during CO recombination, similar to that proposed by simulations though the fact that it does not occur in concert with geminate recombination suggests that an alternative geometry to the parent molecule is required, perhaps involving loose association of a solvent molecule.14
Mechanistic considerations for HER
It has been suggested by TD-DFT calculations that Fe-CO dissociation is only a minor pathway relative to Fe-S dissocia-tion in an excited state, which would hold the key to the unsensitized hydrogen evolution from 1 by continuous irradi-ation. 14 In our pump-probe study, however, we have found no evidence for a long-lived excited state and demonstrated that the main photochemical channel is CO loss at all stud-ied wavelengths.
This suggests that the observation of the HER under condi-tions of continuous irradiation arises via an alternative mechanism to that proposed.12 One possibility is that excita-tion of the catalyst into a short-lived excited state occurred when it was, by statistical chance, in proximity to a proton donor. In this way the HER would interrupt the repeated cycle of excitation, loss and recovery of the CO that is ob-served to be the main photochemical process in operation. This need for reactants to diffuse together and be close by at excitation would explain the relatively slow H2 evolution rate
be confirmed using an analog of 1 featuring an aminodithiolate bridge rather than propanedithiolate which might be expected to lead to an increased H2 evolution rate.
An alternative explanation for the observation of HER der continuous irradiation is that the small amount of un-saturated, CO-depleted photoproducts remaining on the ns timescale that were observed in our experiments are respon-sible for HER rather than a long-lived electronically excited state. We have however shown that the presence of such species leads ultimately to deprotonation of 1 following diffu-sive recombination with CO and it is not clear that such a reaction mechanism provides a platform for renewal of the catalyst allowing repeated HER.
To confirm that the reported HER was not the result of an ultrafast process, additional TRIR experiments were carried out in the presence of triflic acid (HOTf) and octa-methylferrocene, (at the same 1:1:2 stoichiometric ratio and wavelength range as in the H2 evolution experiments12) for 1
in DCM at 572 nm and 490 nm. No discernible change was
observed in the TRIR spectra relative to the solution phase data reported above (Fig. S9).
Scheme 2 thus summarizes the observed and proposed mechanisms discussed. The main photochemical pathway observed following excitation (>95%) is CO loss and gemi-nate recombination of the dissociated ligand. In addition, minor channels exist, one of which involves a solvent mole-cule enabling deprotonation in concert with diffusive recom-bination of CO on a slow time scale. Although this was not universally observed in our data we believe that this was simply a matter of the duration of the experiment. Finally, excitation of 1 while in proximity to either H+ or Fc# allows the activation of pathways that lead to HER and cycling of the catalyst, though this was not observed during the ultra-fast, single-excitation experiments reported here.
One other possible scenario for HER is that of photo-induced electron transfer into the S-protonated hydride. The popula-tion of such a S-protonated dicapopula-tionic species is likely to be very small, but may provide an enhancement for the minor pathway in Scheme 2 over that of a vicinal proton.
CO
+
+ CO - solv-H+
deprotonation with diffusive recombination
< 5%, slow > 1 ns h
ps
> 95 % geminate recombination,
130-150 ps
+ +
+ CO
CO Fe Fe
S S CO
H OC P
PPh2 Ph2
CO CO Fe Fe
S S
H P
PPh2 Ph2
CO
CO CO Fe Fe
S S
solv
H OC P
PPh2 Ph2
CO CO Fe Fe
S S CO OC
P PPh2 Ph2
Close proximity of H+
or Fc# when irradiated
HER
+
CO CO Fe Fe
S S
H PPh2
PPh2
OC
CO
isomerisation, followed by diffusive recombination
< 5%, slow > 1 ns
Scheme 2. Proposed mechanism of photochemistry observed by TRIR spectroscopy.
Conclusions
The ultrafast photoinduced dynamics of [(μ-pdt)(μ-H)Fe2(CO)4(dppv)]+, which has been shown to evolve H2
under continuous visible light irradiation, have been studied. The results presented suggest that CO ligand loss is the main picosecond timescale photochemical pathway following irra-diation. A fast (~10 ps) component was observed in the re-covery dynamics following excitation that was assigned to relaxation of the initial electronically excited state. Refor-mation of the ground state parent molecule takes place sub-sequently for > 95% of the molecules on ~140 ps timescales. These results are supported by spectral predictions based on DFT calculations and IRpump-IRprobe spectroscopy.
These processes were found to be largely independent of excitation wavelength and solvent (DCM, MeCN and MeOH), although evidence was observed for the buildup of deprotonated product in MeOH with prolonged irradiation and as a minor photochemical pathway on diffusive time scales (~ 1 ns) following short wavelength excitation in DCM and MeCN solutions. No signature of the proposed S-dissociated product predicted previously14 was observed, suggesting that this species has a sub-ps lifetime.
Together, this data provides more insight into the mecha-nism by which 1 catalyzes H2 evolution. It is suggested that
the fact that this process occurs even without photosensitiz-er, which is required for similar hydrogenase mimics, origi-nates mainly from chance encounters between 1 and proton donors or octamethylferrocene at the time of irradiation and takes advantage of the favorable redox potentials and elec-tronic environment of the di-iron centre, rather than the generation of unusual photoproducts, as CO ligand loss is commonly observed for this type of catalyst. These results indicate that anchoring proton and/or electron donors in the vicinity of the catalyst may be a route to improvements in the efficiency and stability of the H2-ase active site analogue.
ASSOCIATED CONTENT Supporting Information
9
AUTHOR INFORMATIONCorresponding Author
*neil.hunt@strath.ac.uk, c.pickett@uea.ac.uk
ACKNOWLEDGMENT
NTH, CJP, RVU and PWJMF would like to acknowledge the support of the European Research Council (334949). The authors would like to thank a Referee for a helpful comment regarding the plausibility of an S-protonated dicationic spe-cies.
REFERENCES
1. Stripp, S. T., Goldet, G., Brandmayr, C., Sanganas, O., Vincent, K. A., Haumann, M., Armstrong, F. A. and Happe, T., Proc Natl Acad Sci, 2009, 106, 17331-17336.
2. Gloaguen, F. and Rauchfuss, T. B., Chem Soc Rev, 2009,
38, 100-108.
3. Helm, M. L., Stewart, M. P., Bullock, R. M., DuBois, M. R. and DuBois, D. L., Science, 2011, 333, 863-866.
4. Kubas, G. J., Chem Rev, 2007, 107, 4152-4205.
5. Rakowski DuBois, M. and DuBois, D. L., Chem Soc Rev,
2009, 38, 62-72.
6. Tard, C. and Pickett, C. J., Chem Rev, 2009, 109, 2245-2274.
7. Tschierlei, S., Ott, S. and Lomoth, R., Energ Environ Sci,
2011, 4, 2340-2352.
8. Wang, M., Chen, L., Li, X. and Sun, L., Dalton Trans, 2011,
40, 12793-12800.
9. Zipoli, F., Car, R., Cohen, M. H. and Selloni, A., Catal Today, 2011, 165, 160-170.
10. Na, Y., Wang, M., Pan, J., Zhang, P., Akermark, B. and Sun, L., Inorg Chem, 2008, 47, 2805-2810.
11. Wolpher, H., Borgstrom, M., Hammarstrom, L., Bergquist, J., Sundstrom, V., Stenbjorn, S., Sun, L. C. and Akermark, B., Inorg Chem Comm, 2003, 6, 989-991.
12. Wang, W., Rauchfuss, T. B., Bertini, L. and Zampella, G., J Am Chem Soc, 2012, 134, 4525-4528.
13. Justice, A. K., Rauchfuss, T. B. and Wilson, S. R., Angew Chem Int Edn, 2007, 46, 6152-6154.
14. Bertini, L., Fantucci, P., De Gioia, L. and Zampella, G.,
Inorg Chem, 2013, 52, 9826-9841.
15. Bertini, L., Greco, C., De Gioia, L. and Fantucci, P., J Phys Chem A, 2006, 110, 12900-12907.
16. Dougherty, T. P. and Heilweil, E. J., Chem Phys Lett, 1994,
227, 19-25.
17. George, M. W., Dougherty, T. P. and Heilweil, E. J., J Phys Chem, 1996, 100, 201-206.
18. Nayak, S. K. and Burkey, T. J., J Am Chem Soc, 1993, 115, 6391-6397.
19. Snee, P. T., Payne, C. K., Mebane, S. D., Kotz, K. T. and Harris, C. B., J Am Chem Soc, 2001, 123, 6909-6915.
20. Bingaman, J. L., Kohnhorst, C. L., Van Meter, G. A., McElroy, B. A., Rakowski, E. A., Caplins, B. W., Gutowski, T. A., Stromberg, C. J., Webster, C. E. and Heilweil, E. J., J Phys Chem A, 2012, 116, 7261-7271.
21. Johnson, M., Thuman, J., Letterman, R. G., Stromberg, C. J., Webster, C. E. and Heilweil, E. J., J Phys Chem B, 2013,
117, 15792-15803.
22. Kania, R., Frederix, P. W. J. M., Wright, J. A., Ulijn, R. V., Pickett, C. J. and Hunt, N. T., J Chem Phys, 2012, 136.
23. Muhammad, S., Moncho, S., Brothers, E. N., Darensbourg, M. Y., Darensbourg, D. J. and Bengali, A. A., Inorg Chem, 2012, 51, 7362-7369.
24. Ridley, A. R., Stewart, A. I., Adamczyk, K., Ghosh, H. N., Kerkeni, B., Guo, Z. X., Nibbering, E. T. J., Pickett, C. J. and Hunt, N. T., Inorg Chem, 2008, 47, 7453-7455.
25. Stewart, A. I., Wright, J. A., Greetham, G. M., Kaziannis, S., Santabarbara, S., Towrie, M., Parker, A. W., Pickett, C. J. and Hunt, N. T., Inorg Chem, 2010, 49, 9563-9573.
26. Barton, B. E., Zampella, G., Justice, A. K., De Gioia, L., Rauchfuss, T. B. and Wilson, S. R., Dalton Trans, 2010, 39, 3011-3019.
27. Kaziannis, S., Santabarbara, S., Wright, J. A., Greetham, G. M., Towrie, M., Parker, A. W., Pickett, C. J. and Hunt, N. T., J Phys Chem B, 2010, 114, 15370-15379.
10
29. Zhao, Y. and Truhlar, D. G., J Chem Phys, 2006, 125.
30. Hay, P. J. and Wadt, W. R., J Chem Phys, 1985, 82, 299-310.
31. Frederix, P. W. J. M., Kania, R., Wright, J. A., Lamprou, D. A., Ulijn, R. V., Pickett, C. J. and Hunt, N. T., Dalton Trans, 2012, 41, 13112-13119.
32. Zhang, Y., Chen, J. and Kohler, B., J Phys Chem A, 2013,
117, 6771-6780.