A I I n P o w e r S y S t e m S & e n e r g y m A r k e t S
Embedded Intelligence
for Electrical Network
Operation and Control
Victoria M. Catterson, Euan M. Davidson, and Stephen D.J. McArthur,University of Strathclyde
Integrating multiple
types of intelligent,
mulitagent data
analysis within
a smart grid can
pave the way for
flexible, extensible,
and robust solutions
to power network
management.
method is to focus on changing consumer behavior using metering and smart appli-ances,1 another considers the network itself
and favors a new approach to controlling and operating the existing grid infrastruc-ture (see http://www.smartgrids.eu).
Smarter operation of the existing network naturally suggests the use of intelligent sys-tems techniques to perform or enhance many of the activities currently performed by engineers. Traditionally, engineers view electrical networks as either transmission or distribution networks. Although both types are managed from a centralized con-trol room with the aim of balancing supply and demand, certain features differentiate the two. Namely, transmission networks are characterized by
• high-voltage, meshed networks used for bulk transfer of power;
• large-scale generators (such as coal-fired, gas, and nuclear stations), where the net-work control engineers are responsible for the dispatch of generation;
• supervisory control and data acquisi-tion (SCADA) systems that give engineers
visibility of voltages and currents around the network and provide remote control of devices such as circuit breakers and telecontrolled switches; and
• engineers reconfiguring the network as needed to handle various contingencies.
In contrast, distribution networks tradi-tionally are characterized by
• lower-voltage, radial networks designed to deliver energy from the transmission network to customers (in homes, busi-nesses, and industry);
• little or no generation connected, making dispatch of generation impossible;
• SCADA systems that offer only visibility of the network, as many devices are manually operated; and
• engineers rarely reconfiguring the net-work to handle emergency situations.
Various smart-grid visions presuppose a fu-ture in which these passive, radial distribution networks with unidirectional power flows evolve into networks with increasing levels of embedded generation, demand response,
W
ithin North America, Europe, and other territories, there is
politi-cal will to adapt and augment existing electripoliti-cal networks to meet
our future energy needs. Such
smart grids
involve changes broadly aimed to
sponse to system events while offering more data for automated analysis of network and asset health.
In this article, we present indus-trial examples of intelligent systems providing the smart functionality for these tasks. Specifically, we discuss autonomous control at the distri-bution level, automated analysis of data from highly observable power systems, and the use of multiagent sys-tems technology for distributing and integrating smart functionality. We show how using intelligent systems is key to addressing these problems in ways that are flexible, robust, and un-derstandable to engineers, supporting the delivery of a more efficient grid.
Autonomous Control of a Distribution Network
Connecting small-scale generation to distribution networks leads to a raft of problems collectively termed
congestion. This includes rises in voltage (caused by the reverse power flow back to transmission), current overloads at network bottlenecks (due to the generators producing currents the network is not rated to handle), or increased load associated with new customers or electric vehicles.
Traditionally, engineers designed or adapted networks to avoid congestion by building extra lines or replacing transformers. However, such network reinforcements can be expensive. An alternative is using an active net-work management (ANM) strategy to provide automated control to deal with overload conditions. An ANM scheme can include the following con-trol tasks: automatic network recon-figuration to keep as many customers as possible on supply, control of gen-erators to keep power flows within
For all these functions, network operators require solutions with the following properties:
• Flexibility. Engineers desire solu-tions that can be deployed in vari-ous situations—that is, in different network topologies with different control measures.
• Extensibility. Networks change; new generators can be added and old ones removed. Regulations also change, opening up new ser-vices and possibilities for network control. ANM systems can be ex-tended without replacing the entire control system.
• Graceful degradation. Measurement error and failure of the communi-cation systems underpinning ANM schemes are inevitable. Thus, per-formance must degrade gracefully when a scheme is presented with bad data or communications fail-ures occur.
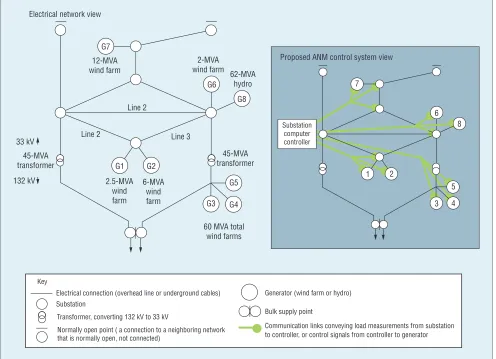
Figure 1 illustrates an example util-ity that desired an ANM solution to manage power flows in the electri-cal network. The figure shows two 132-kV lines feeding a distribution network through two transformers, rated at 45 megavolt ampere (MVA). The distribution network is at 33 kV, with almost 85 MW of installed gen-eration (generators 1, 2, 6, 7, and 8). The minimum local load in this net-work is 10 MW, meaning that certain conditions see an export of 75 MW from the 33-kV network through the transformers (85 MW of generation, 10-MW load).
In this scenario, if one of the two 45-MVA transformers is removed from service, the remaining trans-former will be overloaded. To handle
transformer to mitigate such a sce-nario. If a transformer is lost, the current on lines 1 and 3 is moni-tored, and too high a current results in a trip signal being sent to the hydro generator. Removing the hydro plant from the network reduces the power being exported through the remaining transformer, and thus power flow is kept within limits.
Due to the incremental building of wind farms in this area, the number of bespoke systems in place has in-creased over time. There are now nine special control schemes in place, each monitoring for a different scenario requiring different control. It is hard for engineers to manage this area of network because the complexity of the automated systems leads to con-trol actions being taken that are not straightforward and understandable.
Engineers wanted a solution that could automatically handle power-flow management in an explainable way and offer the option of manual power-flow management, when de-sired.2 It should be possible to apply
this technique to multiple distribu-tion networks—reasoning generically on a model of the network, rather than being tuned to suit only the par-ticular installation topology.
Constraint programming tech-nology can help meet these needs.3
Power-flow management was formu-lated as a finite discrete domain con-straint satisfaction problem (CSP),2
where controllable generators consti-tute the problem variables, with dis-crete domains for the control signals that limit their output. For our ex-ample network, we chose the domain of all wind farms, D = {1, 0.75, 0.5, 0.25, 0}, and the hydrogenerator is
A I I n P o w e r S y S t e m S & e n e r g y m A r k e t S
Three distinct types of constraints apply to power-flow management. First, the flow of power around the network must not exceed the thermal limits of any equipment. This tech-nical constraint can be checked using a network model and a load-flow en-gine, which engineers use to manu-ally check thermal constraints.
Second, contractual constraints de-termine which generators have prior-ity access to connect. Under current contracts, generators either have a firm connection agreement, which lets them generate whenever and however much they like, or they have a nonfirm agreement, in which they are removed from the network in a last-in-first-off (LIFO) order. To connect more wind
farms to the network while avoiding the cost of network reinforcement, many of the generators were offered nonfirm connections. For the network in Figure 1, if an overload occurs, the most recently-built wind farm 5 is al-ways first to be removed.
The LIFO regime was introduced in the interest of fairness, so the gen-erators connecting earlier would not see their access rights reduced if ad-ditional generators were to connect in the future. However, because of different limits on items of equip-ment, in some situations generator 6 could reduce its output by 5 MW to alleviate the congestion, whereas the contractually obligated reduction of generator 5 must be 10 MW. In this
situation, it would be in generator 5’s best interest to negotiate a bilateral contract with generator 6, paying it to reduce by 5 MW in order to con-tinue outputting (and selling) an extra 10 MW. Such bilateral contracts are not yet allowed, but the increase in wind penetration and subsequent net-work congestion issues mean regu-lation is under scrutiny and might change in the coming years. With the constraint programming approach to power-flow management, the con-tractual constraints can be updated easily with changes in regulation.
[image:3.639.67.563.114.473.2]The final type of constraint is the preference for maximizing access to the network for distributed generators. Thermal overloads can be removed
Figure 1. Example distribution network. This network automatically handles power-flow management in an explainable way and offers the option of manual power-flow management. In this case, the off-the-shelf constraint satisfaction problem (CSP) solver running on a substation computer could generate timely solutions for all normal network conditions.
12-MVA wind farm
G7
G1 G2
G3 G4 G5
G6 7
6 8
3 4 5
1 2
G8 Electrical network view
Proposed ANM control system view
2.5-MVA wind farm
6-MVA wind farm
60 MVA total wind farms 2-MVA
wind farm 62-MVA hydro
45-MVA transformer Line 3
Line 2
Line 2 33 kV
132 kV 45-MVA transformer
Substation computer controller
Key
Electrical connection (overhead line or underground cables) Substation
Generator (wind farm or hydro)
Bulk supply point
Communication links conveying load measurements from substation to controller, or control signals from controller to generator Transformer, converting 132 kV to 33 kV
lem, an off-the-shelf CSP solver running on a substation computer (see Figure 1) could generate solutions in a worst-case time of 9.7 seconds and under 2 seconds for most normal net-work conditions. This is well within the timescales required for a control system to remove a thermal overload and is therefore a suitable approach to power-flow management. It is also extensible, by updating constraints if there is a change in regime, and generic to all networks, by chang-ing the network model for the load flow. Crucially, engineers can under-stand the control actions this system proposes because the load flows be-fore and after action is taken show the thermal overload being removed. Graceful degradation comes from the CSP solver offering a ranked set of so-lutions. Should the preferred solution fail due to model error, measurement error, or failure of communications, the controller can try implementing the next solution.
This system is currently in the pre-liminary stages of field trials with a UK utility. Software is being de-ployed on a substation computer in a 33-kV/11-kV primary substation for power-flow management of an 11-kV feeder with 2 MW of embed-ded generation. Initially, an open-loop system will generate and record control actions for removing thermal overloads. After successful trials, closed-loop operation should follow, in which control actions are au-tomatically taken when an overload is detected.
Another facet of ANM is automat-ically restoring supply after a fault. In contrast to power-flow manage-ment, this has been the subject of much research4 and has become a
Post-Fault Analysis
The protection system is responsible for detecting faults (such as short cir-cuits) and disconnecting faulty or faulted equipment from the network by opening the appropriate circuit breakers. This must happen within milliseconds up to tens of seconds to limit equipment damage and ensure that the power system remains stable. After a fault has occurred on the network, engineers are interested in its type and location, how much of the network was affected, whether any areas are still without supply, and whether the protection system oper-ated correctly to clear the fault. These questions must be answered by ana-lyzing the data generated by the fault, but there are different sets of data available. One utility, which argu-ably operates one of the most heavily monitored networks in Europe, per-forms post-fault analysis on four data sets:6
• SCADA alarms that record auto-matic actions (such as high cur-rents detected, main protection operating, and circuit-breakers triggering);
• digital fault recorder (DFR) data, which records high-resolution cur-rent and voltage traces from a cir-cuit when triggered by an incident; • traveling-wave fault locator data,
which indicates how far along a line the fault is; and
• circuit-breaker trip-coil current traces, indicating when the breaker was triggered and how long it took to operate.
Frequently, engineers manually analyze these data sets. In a typical
occur simultaneously, these figures can reach 20,000 SCADA alarms and 2,000 fault records in a 24-hour pe-riod. This rate is overwhelming for timely analysis.
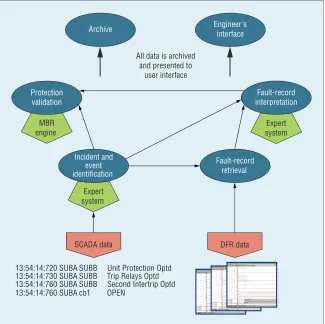
Engineers take a holistic ap-proach, using analysis of one data set to inform the analysis of another. In particular, a first-pass analysis of SCADA alarms can prioritize DFR data for inspection by highlighting the likely faulted line. This approach was the basis for protection engineer-ing diagnostic agents (PEDA), which integrated multiple intelligent systems for different aspects of data analysis.
First, a rule-based expert system groups SCADA alarms into events and then groups events into incidents. Assessment of the protection events within an incident indicates whether it needs further investigation. If so, the fault’s location and timing is com-pared against the capture times of fault records to partition them into those directly related to an incident, those related to the incident, those indirectly related, and miscellaneous records with no associated incident. The directly related records are prior-itized for further processing.
The type of fault and fault clear-ance time are extracted from the prioritized records using a second rule-based expert system. At the same time, fault records are passed through a model-based reasoning en-gine to identify incorrect operation of components, such as a missing inter-trip signal or failure of a inter-trip relay.
A I I n P o w e r S y S t e m S & e n e r g y m A r k e t S
of new incidents when they occur. Fault-record-retrieval agents use in-cident information to prioritize the collection of DFR data, which is for-warded to a fault-record-interpretation agent for classification and the protec-tion validaprotec-tion and diagnosis agent for model-based analysis. In addition, agents for long-term information stor-age and an engineer’s interface give a complete system for automated post-fault analysis.
From November 2004, many of the PEDA agents were deployed at SP Energy Networks, running online to interpret SCADA and DFR data. After nearly two years of operation, a new SCADA system altered the for-mat and reliability of SCADA data received, requiring nontrivial work to bring it back online. During a
six-month snapshot of its time online, PEDA processed more than 2 million SCADA alarms and 583 fault re-cords, which were correctly reduced to 402 incidents.
Condition Monitoring
Protection systems act to remove im-mediate threats to equipment integ-rity, but even when operated within limits, assets experience aging and shocks that degrade their health. Online monitoring can highlight the current condition and aging trend of important assets, letting network op-erators target maintenance where it will be most beneficial.
Transformers are the most expen-sive single asset in a transmission net-work, and within the UK and US, many are coming to the end of their
design life. To prolong their opera-tional lives while minimizing risk of failure in service, online monitoring helps detect behavior changes and diagnose faults.
To this end, we created a condition-monitoring multiagent system
(COMMAS) that integrates three types of transformer health monitor-ing.2 The first is conventional
trans-former fault diagnosis, which in-volves three techniques for dissolved gas analysis (DGA) that use ratios of gases in transformer oil to iden-tify problems. Second, COMMAS includes a suite of agents for assess-ing the severity of an insulation dete-rioration phenomenon called partial discharge (PD), where charge travels but only partially bridges the insula-tion. Earlier work trained three clas-sifiers to diagnose the defect causing PD and used hidden Markov models to detect changes in PD behavior. The third approach is conditional anom-aly detection (CAD), a technique that meets specific requirements of end- of-life transformer monitoring.
Over a transformer’s 40-year life, it develops a particular signature of normal behavior due to low-level de-fects and shocks that degrade per-formance while not posing risk of immediate failure or accelerated de-terioration. This can be problem-atic when monitoring health at the end of a transformer’s life because automated fault-detection and clas-sification techniques will label its degraded behavior as faulty and needing attention.
[image:5.639.68.393.111.435.2]Instead of fault diagnosis, engi-neers are more interested in changes to transformer behavior, either due to fault progression or the develop-ment of new problems. At the same time, engineers are sensitive to false positives. The erroneous detection of anomalous behavior on even a few occasions is likely to prejudice
Figure 2. Integrated multiagent systems technology. Protection engineering diagnostic agents (PEDA) incorporate SCADA and DFR data analysis to identify fault type, location, and affected areas of the network and to determine whether the protection system operated correctly.
All data is archived and presented to
user interface
SCADA data
Expert system
Fault-record interpretation
MBR engine
Protection validation
Fault-record retrieval
Archive Engineer'sinterface
Expert system
Incident and event identification
DFR data
To address these challenges, CAD limits false positives by modeling op-erating conditions and transformer condition.7 A training set of data is
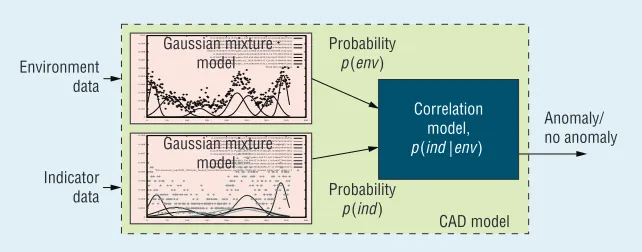
split into environmental and indica-tor parameters, based on whether they affect the transformer (such as ambient temperature and load cur-rent) or indicate its condition (such as oil temperature and oil moisture). Each parameter set is modeled as a mixture of Gaussian distributions, which capture the probability of pa-rameters taking certain values. A third probabilistic model correlates the environment and indicators, map-ping Gaussian components of one model to components of the other (see Figure 3).
Anomaly detection consists of in-terrogating this model with new data and calculating the probability of the transformer condition given the environmental condition. If it ex-ceeds a threshold of unlikeliness, it is deemed a true anomaly and reported to engineers.
The real benefit of this approach is that it will not raise anomalies when the environmental conditions are sig-nificantly different from the training examples. If the transformer is oper-ating in a heat wave, its oil tempera-ture could be expected to be anoma-lously high, but engineering judgment would ascribe the temperature rise to the environmental conditions rather than a transformer problem. Assum-ing the environmental model does not capture heat-wave conditions, the correlated CAD model reflects its lack of knowledge of how the trans-former is expected to behave by re-turning a higher probability than that of the transformer model alone (p(ind) in Figure 3).
CAD was applied to an in-service 275-kV/132-kV, 180-MVA transmission
transformer in the UK.7 This
trans-former had low levels of fault indica-tor gasses from hisindica-torical problems, which made standard diagnostic tech-niques inaccurate. Thus, anomaly de-tection was required to model the imperfect normal transformer condi-tions and alert engineers to any health changes. The CAD model was used to analyze 12 months of online data from the transformer and site, and in that time, it detected 21 anomalies. Further investigation of these anom-alies revealed them to be temporary sensor or data-logging faults, where plausible but erroneous values were re-corded from the transformer while en-vironmental conditions were normal.
By including CAD within the wider COMMAS agent community, the ad-vantages of anomaly detection are supported by fault diagnosis from the DGA and PD analysis agents. If an anomaly is detected, fault diagno-sis can give engineers a familiar cat-egorization of the potential problem to help them plan corrective main-tenance. Equally, corroboration between fault diagnoses can help en-gineers draw conclusions about the transformer’s health. That is, if the DGA and PD agents all conclude that PD is occurring, there is a high confi-dence that this is indeed correct.
Furthermore, the robustness of the agent approach means that if one data source becomes inaccessible, or if an agent otherwise fails to perform its diagnosis, the others in the system
can autonomously continue their tasks and present a partial view of the transformer’s health. In this way, the combination of appropriate intelli-gent systems techniques within a mul-tiagent system provides a condition-monitoring approach that meets the requirements of flexibility, extensibil-ity, and graceful degradation.
Agent-Based Smart-Grid Architecture
The potential for intelligent systems in many areas of network manage-ment is clear, but these systems must not be left to operate in isolation. The interpretation of one data set can often benefit another, as in the case of post-fault analysis with SCADA and DFR data, but this requires com-munication between each system. As more systems for data interpretation become capable of interoperation, the scope for higher levels of corrobora-tion grows.
[image:6.639.250.571.112.238.2]One example is the possibility of making better asset condition assess-ments with knowledge of network events. Traditionally, incidents and events on the network are not eas-ily available to condition-monitoring engineers, and they assess the health of assets such as transformers purely from condition data. However, a fault can draw a large current that con-stitutes a shock to the transformer, temporarily increasing temperatures and taxing the insulation system. Without knowledge of network events,
Figure 3. Conditional anomaly detection. CAD compares the probabilities of transformer indicators and environmental measurements to identify anomalous transformer behavior.
model,
p(ind | env) no anomaly
CAD model Indicator
data Probability
p(ind) Gaussian mixture
A I I n P o w e r S y S t e m S & e n e r g y m A r k e t S
condition-monitoring engineers are speculating about whether these wor-rying trends are due to external forces or to true degradation of the trans-former’s condition.
Information about asset health can also benefit control decisions. If it is known that a transformer is experi-encing problems, power-flow man-agement can favor the load reduction on the transformer to, say, 50 per-cent of its rating until maintenance is possible. If a circuit breaker’s condi-tion suggests that it might fail, an al-ternate network configuration could help keep that connection in its cur-rent state. This sort of planning is hard to achieve with the manual pro-cedures currently in place, but the integration of multiple types of data analysis within a smart grid paves the way to its realization.
Such an integration of disparate systems requires a standard ap-proach to building and deploying in-dividual components of functionality. Researchers have recognized interop-erability as a key facet of smart grid functionality, and within the industry, there is much activity on standardizing data formats, such as from the US Na-tional Institute of Standards and Tech-nology8 and the IEEE P2030
Work-ing Group.9 However, data formatting
is only one component of flexible, open systems that must also adhere to expected levels of robustness, extensi-bility, and graceful degradation.
Multiagent systems technology is a way of developing loosely coupled autonomous systems, where each segment of the system can indepen-dently pursue its goals while using standards-conforming messaging to interact with others.10 This has
sev-eral advantages. If one agent fails in its task, it does not necessarily af-fect or degrade the others in the system. Considering the integra-tion of smart grid capabilities, if a
condition-monitoring agent were to stop responding, it need not adversely affect agents performing control roles. The loss of some functionality might lead to less optimal network management, but it will not prevent other agents from taking reasonable decisions based on less complete in-formation. Particular agent platform deployments can produce a more or less robust system,2 but in general an
agent approach allows for graceful degradation.
A multiagent architecture for the smart grid can build on the standards already developed for interoperability within the power industry. For exam-ple, data exchange between utilities is facilitated by the Common Infor-mation Model (CIM), and there is a growing use of the IEC 61850 stan-dard for intrasubstation messaging. These standards cover the main do-mains of communication required by agents performing smart grid roles and hence can form the basis of a smart-grid agent ontology. The IEEE Power and Energy Society Multiagent Systems Working Group aims to pro-mote the openness of agent architec-tures within the power domain and provide an upper ontology based on CIM on their website (http://ewh. ieee.org/mu/pes-mas).
In addition, we have identified five key agent roles within a smart-grid monitoring system, which offer tem-plates for agent behavior and interac-tions.2 By loosely standardizing the
roles and interactions, agents can be designed such that behaviors provid-ing social ability for each role can be reused with some parameterization. These roles are not exclusive, with specific provisions for interfacing to clusters of agents (such as PEDA) that do not implement the roles. For those that do, the reuse of social behavior code saves on development time and allows new data sources and services
to be automatically locatable by ex-isting system agents.
T
he changing nature of the elec-tricity network makes it a more complex, dynamic system to manage. Intelligent systems can provide au-tomation of many of the tasks cur-rently performed by engineers, but in ways that are generically applicable, extensible to changing regimes, and explainable.The deployment of automated in-telligence allows for information ex-change across the traditional bound-aries of engineering roles, improving decision-making. Realizing this de-pends on communication between each area of analysis, while robust-ness relies on the autonomy of each role. We believe the intelligent systems techniques and applications we discuss represent the building blocks of smart-grid architectures, while multiagent systems offer a platform technology for deployment of this functionality.
References
1. A. Vojdani, “Smart Integration,” IEEE
Power and Energy, vol. 6, no. 6, 2008, pp. 71–79.
2. V.M. Catterson, E.M. Davidson, and S.D.J. McArthur, “Agents for Active Network Management and Condition
Monitoring in the Smart Grid,” Proc.
Agent Technologies for Energy Systems Workshop, 9th Int. Conf. Autonomous Agents and Multiagent Systems, 2010; http://users.ecs.soton.ac.uk/acr/ates2010/ Paper_03.pdf.
3. P. Plener, M. Carlsson, and C. Schulte, “Constraint Programming in Sweden,”
IEEE Intelligent Systems, vol. 24, no. 2, 2009, pp. 87–89.
4. D. Lindenmeyer, H.W. Dommel, and M.M. Adibi, “Power System
Restora-tion: A Bibliographical Survey,” Int’l J.
Restoration in Power Distribution Sys-tems: A Benchmark for Planning Under
Uncertainty,” Proc. 6th European Conf.
Planning (ECP-01), IOS Press, 2001, pp. 85–95.
6. E.M. Davidson et al., “Applying Multi-agent System Technology in Practice: Automated Management and Analysis of SCADA and Digital Fault Recorder
Data,” IEEE Trans. Power Systems,
vol. 21, no. 2, 2006, pp. 559–567. 7. V.M. Catterson, S.D.J. McArthur, and
G. Moss, “On-Line Conditional Anom-aly Detection in Multivariate Data for
Transformer Monitoring,” IEEE Trans.
Power Delivery, vol. 25, no. 4, 2010, pp. 2556–2564.
8. US Nat’l Inst. Standards and Tech-nology, “NIST Framework and Road-map for Smart Grid Interoperability Standards Release 1.0,” 2010; http:// www.nist.gov/public_affairs/releases/ upload/smartgrid_interoperability_ final.pdf.
9. IEEE P2030, “Draft Guide for Smart Grid Interoperability of Energy Technol-ogy and Information TechnolTechnol-ogy Op-eration with the Electric Power System (EPS);” 2010; http://grouper.ieee.org/ groups/scc21/2030/2030_index.html. 10. M. Pechoucek et al., “Agents in
Indus-try: The Best from the AAMAS 2005
Industry Track,” IEEE Intelligent
Systems, vol. 21, no. 2, 2006, pp. 1541–1672.
Selected CS articles and columns are also available for free at http://ComputingNow.computer.org.
systems for condition monitoring within the power industry. Catterson has a PhD in transformer diagnostics from the University of Strathclyde. She is a member of IEEE and the power-industry association CIGRÉ. Contact her at [email protected].
Euan M. Davidson is a senior research fellow at the Institute for Energy and Environ-ment, University of Strathclyde, Glasgow. His research interests include multiagent sys-tems, model-based reasoning, and applying intelligent system techniques to diagnostic, power-system control, operation, and management problems. Davidson has an MEng in electrical and electronic engineering from the University of Strathclyde. He is a mem-ber of IEEE and the Institution of Engineering and Technology (IET). Contact him at [email protected].