Power savings in a wavelength-division-multiplexed
passive optical network for aircraft
Eoin Murphy,a,bCraig Michie,b,*Henry White,aWalter Johnstone,band Ivan Andonovicb
aBAE Systems Advanced Technology Centre, Sowerby Building, FPC 267, Filton, Bristol BS34 7QW, United Kingdom bUniversity of Strathclyde, Royal College Building, 204 George Street, Glasgow G1 1XW, United Kingdom
Abstract. Dense wavelength division multiplexing has been proposed as a means of implementing communi-cations on aircraft. In such applicommuni-cations, power consumption is a critical consideration. The impact of reducing the transmitter power and recovering losses using a shared amplifier has been investigated. By recovering the power loss using a shared amplifier transmitter, power savings can be made. This network has been modeled and savings of 20% are predicted in a realistic aircraft environment.©2014 Society of Photo-Optical Instrumentation Engineers (SPIE)[DOI:10.1117/1.OE.53.12.126109]
Keywords: wavelength-division-multiplexed networks; semiconductor optical amplifiers; optical fiber communication.
Paper 141356 received Aug. 29, 2014; accepted for publication Oct. 24, 2014; published online Dec. 16, 2014.
1 Introduction
The growth in demand for high bandwidth sensors and real-time video capture on aircraft has stimulated a need for high data capacity avionic communications networks.1 Implement-ing a communications network to accommodate such traffic using Commercial off the Shelf (COTS) components is highly desirable since this allows the avionics sector to benefit from the economies of scale associated with the telecommunica-tions marketplace. Fiber-optic based communicatelecommunica-tions are ideally positioned to address these needs and ensure that com-munication networks are protected against future demands for increasing bandwidth. The wavelength-division-multiplexed passive optical network (WDM-PON) is being considered as the next step toward a future proofed network.2,3 To date, extensive research has been undertaken on long reach WDM PON,4low-cost light sources,5fault localization,6and increasing data rates7 among many other topics. Although these problems do apply to aircraft networks, they are not con-sidered as pressing as the power consumption of the network. Recent analysis in Ref.8has analyzed the power consumption of critical network components within an optical transmission system. The analysis considered different data rates and many different transmitter/receiver designs. In general, it was estab-lished that while there are small savings that can be obtained by optimizing the receiver electronics design, a major consid-eration within the overall power budget of the network was identified as being the power required to drive the optical transmitters. The conclusion reached was that alternative laser technologies that are more power efficient are required. In this paper, we theoretically assess an alternative approach that uses optical amplification to minimize the overall power consumption of optical components in a WDM-PON in envi-ronments representative of those found on aircraft.
2 WDM-PON System
A possible schematic of layout of the proposed WDM-PON is shown in Fig.1. It comprises a bidirectional network with
1550-nm upstream and 1310-nm downstream. Generally, WDM-PONs consist of laser transmitters at each wavelength on a 100-GHz grid. These signals are multiplexed, usually by an arrayed waveguide grating (AWG), and carried on a common fiber to a demutiplexer at the receiving end. The proposed topology, shown in Fig.1, relies on the fact that the AWG wavelength response repeats itself over different wavelength bands defined by its free spectral range.9With the introduction of1300∕1550wavelength selective splitters, this transmission process can occur simultaneously in both up and downstream directions.
3 Problem Formulation
As previously discussed, Ref.8has analyzed the power con-sumption of network components and found that the greatest savings can be made at the optical transmitters. As data rates increase, distributed feedback (DFB) lasers become the only realistic transmitter option and require drive currents of 10 mA to20 mA∕mWof power. Network operation is nor-mally designed from the perspective of an optical power budget. Consequently, the energy power budget can be over-looked and this could be significantly reduced while main-taining the desired bit error rate (BER) performance.
In this paper, we have extended the analysis made in the literature8to include examples where optical amplifiers are used as power boosters within a network. The contention is that rather than designing the network for optimal signal to noise ratio (SNR), significant power savings can be made by reducing the optical power at the transmitter and recovering this power loss by adding an optical amplifier. This is because the energy required to power the amplifier is shared over a large number of users. Here, we address the calcula-tion of the power saving that this approach will have while maintaining an adequate system performance, in this case, for a WDM-PON.
Using established design processes, an optical system is considered from the perspective of optimizing the SNR. This drives the solution toward high transmit powers. By
*Address all correspondence to: Craig Michie, E-mail:[email protected]
changing the emphasis of the design toward optimizing energy consumption, transmitter power levels will, in gen-eral, be lower, even more so if midspan booster amplifiers are used to recover optical signal strength.
Here, we present an evaluation of the network from the perspective of power consumption as a function of channel count. The key parametric considerations within this respect are amplifier gain, maximum output power that the amplifier can support (PSAT), and noise figure (NF) of the amplifier,
along with the variation that these three parameters have with drive current, which in turn relates back to the consumption of the amplifier. In the present analysis, the NF of the ampli-fier has been set to 8 dB. This is significantly higher than that reported in the literature10but is representative of an operat-ing performance that is realistic.
4 Modeling
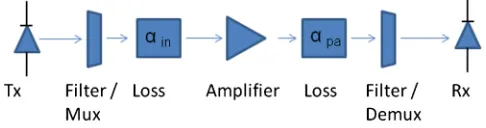
The elements in the schematic sketched in Fig.2and asso-ciated parameters are relevant to the analysis:
• the transmitter—power, extinction ratio (ER), and data rate;
• filter/multiplexer—channel count, filter width; • loss before the amplifier (insertion and trunk losses); • amplifier parameters
○ Gain,PSAT and NF;
• filtering/demultiplexing post amplification;
• loss post amplification (insertion and trunk losses); • receiver performance.
In order to accurately model the network operation, knowledge of the receiver parameters is required, for exam-ple, the thermal noise level within a receiver. These param-eters are generally not easy to source since manufacturers tend to quote performance figures that demonstrate conform-ity with the relevant standards. It is, therefore, necessary to make some approximations that can be related back to opera-tional specifications that are openly available.
WDM-PON does not yet have an official standard like other PON technologies such as GPON and XG-PON. This means that no official requirements for link loss are available; in this paper, the loss requirement has been set at 26 dB. This is a representative of what would be required in a PON and fits well with the scenario of a typical link in an aircraft. On air-craft, the link distances are short at around 100 m in length. Over the avionic temperature range, the fiber attenuation increases due to material effects in the cabling materials such as the jacket layer contracting. It has been found that for a 5-m length of fiber temperature cycled through the avi-onic temperature range, the fiber loss is 0.2 dB.11Using this value for fiber loss, 0.2 dB per 5 m over a link of 100 m, the total fiber loss will be 4 dB. Additionally, fiber routed through an avionics bay tends to be subjected to extreme bending, therefore, a 2 dB loss has been assumed to account for this bending. Insertion losses from each of the components add 11 dB, 4 dB per AWG, and 1 dB for each splitter. It may also be useful to use optical rotary joints on an aircraft, for use with a high bandwidth camera on a turret for example, and this has a 1 dB insertion loss. In a next generation avionic link, it is expected that 10 connectors will be needed in a sin-gle link. These will be a mixture of connector types from in line connectors, with a 0.1 to 0.2 dB insertion loss over the avionic temperature range to blind mate connectors with a 0.8 dB insertion loss. It is expected that blind mate connectors will be deployed more widely, therefore, a conservative esti-mate for total insertion loss for the connectors is 5 dB. It is also standard practice to allow a 3 dB overhead for component deg-radation in this harsh environment. The breakdown of network losses is
• 4 dB fiber loss over −55°C toþ125°C temperature range
• 2 dB bend loss
• 11 dB component insertion loss • 1 dB loss with optical rotary joint • 5 dB connector loss
• 3 dB overhead for degradation.
Typical transmitter power levels within COTS transceiver devices range between 0 to 5 dBm.12,13In the present analy-sis,þ3 dBmis assumed as an illustrative value and the data rate is 1.25 Gbps. To produce a link margin of 26 dB, this implies that the receiver must deliver a BER of10−12with a
maximum input power of−23 dBm. This sensitivity can be achieved with the use of a pin photodiode at the receiver. While the exact details of the receiver design will influence the detail of any analysis that is based upon the receiver, this is less important from the perspective of the present analysis since it is the relative performance of the amplified and unamplified networks that are of interest. Hence, modeling the system performance with a receiver that is slightly better than the minimum required by the standard is perfectly valid. We use this design throughout the remainder of the paper.
5 Amplified Link
The SNR at the output of a photodiode can be estimated as14
SNR¼signal power noise power ¼
I2 P
σ2 TOT
; (1)
Fig. 1 Schematic of the amplified wavelength-division multiplexed passive optical network (WDM-PON).
[image:2.630.63.304.60.153.2] [image:2.630.62.305.673.737.2]whereIPis the photocurrent generated at the photodiode and
σ2
TOTis the total noise for the transmission of both the bit“0”
and“1.”The SNR determines the system performance and is related to the BER by
BER¼0.5 erfc
Qffiffiffi 2 p
; (2)
where Q is the Q factor, which can be expressed as Q2¼SNRor
Q¼I1−I0
σ2 TOT
; (3)
whereI1 andI0 are the signal powers on bits“1”and“0,”
respectively. In addition to the above considerations, it is rea-sonable to assume that, by adjusting the drive conditions of the DFB transmitter such that less optical power is injected into the network, the ER of the transmitter may be degraded. In the present analysis, we have accommodated for this deg-radation as follows. Defining the ER,reas the ratio of the
powers in a“1”and a“0,”re¼P1∕P0, if the average power
in a transmission isPAVE¼ ðP1þP0Þ∕2, then we can
fur-ther define
P0¼2PAVE
1 1þre
; (4)
P0¼2PAVE
1 1þre
: (5)
As a consequence, the Qfactor at the receiver becomes
Q¼ PAVE
σ2 1þσ20
1−re 1þre
2
; (6)
and the power penalty associated with the imperfect ER can be quantified.
In order to estimate the potential power savings that might be obtained using optical amplifiers, the influence of the optical amplifier on the overall system margin must first be established. The basic model above describing system operation takes into account the optical gain and the ated noise terms. The additional noise components associ-ated with the amplification process and how they alter the SNR is discussed in detail in the literature15 and can be described as follows:
σ2
1 ¼σ2Tþσ2Sþσ2ASEþσ2S−ASEþσ2ASE−ASE; (7)
σ2
0 ¼σ2TþσASE2 þσ2ASE−ASE; (8)
where,σ2
1, the noise variance of a,“1,”is the summation of
σ2
T, the thermal noise,σ2S, the signal induced shot noise,σ2ASE,
the shot noise derived from the amplified spontaneous emis-sion (ASE) power,σ2
S−ASEthe noise resulting from the beat
between the signal and ASE power, andσ2
ðASE−ASEÞthe beat
noise derived from components of the ASE. Similarly,σ2 0, is
the noise variance of a “0” and includes σ2
T, σ2ASE, and
σ2 ASE−ASE.
In turn, each of these can be modeled as
σ2
S¼2eIpBe¼2eRPrecBe¼2eRGPSIGBe; (9)
whereeis the electron charge,Ris the diode responsivity, PSIGis the optical signal power, andBeis the receiver
band-width. The termGrelates to the amplifier gain andαis the post amplification loss (the loss between the amplifier and the receiver). In the present analysis, we have accounted for the fact that the gain is a function of the input signal strength in relation to the amplifier PSAT. Hence at high
input signal levels, the gain value becomes compressed. This will be discussed in more detail later.
The shot noise associated with the ASE power is
σ2
ASE¼2eIASEBe¼2eRαPASEBe; (10)
wherePASEis the ASE power at the receiver. The beat noise
component between the signal and the ASE is expressed as
σ2
ðS−ASEÞ¼4R 2Gα2P
0ρASEBe¼4R2Gα2PSIGPBASEe ; (11)
whereρASEis the ASE power spectral density andρASEBe¼
PBe
ASE is the ASE power falling within the electrical
band-width. The beat between ASE components is quantified by
σ2
ASE−ASE¼2R 2α2ρ
ASEBoBe¼2R2α2PBASEo PBASEe ; (12)
wherePBo
ASEis the ASE power which is contained within the
optical bandwidth. In the present case, Bo was set to
100 GHz to be compatible with a standard AWG and the operational wavelength was 1550 nm for upstream traffic.
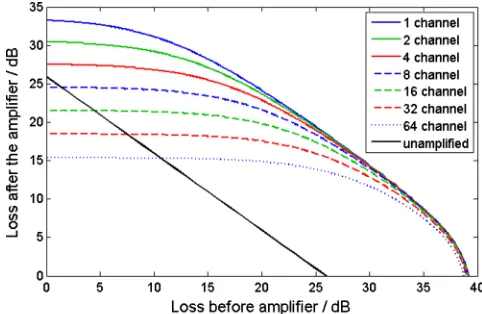
Using this methodology, a mathematical model has been made using MATLAB which will calculate the SNR at the receiver; from this, the performance of an amplified WDM network can be quantified for various channel counts. The analysis was extended to determine the dynamic range of a WDM-PON in relation to the losses that can be tolerated before and after amplification and the results are shown in Fig. 3. This model used an amplifier with a gain of 18 dB,PSATof 13 dBm, and an NF of 8 dB operating across
the C-band. These losses represent insertion losses of the various components throughout the network.
Figure3shows the influence of the amplifier on the net-work performance. If the amplifier is placed adjacent to the
[image:3.630.324.565.576.733.2]receiver, it will boost the signal power to a maximum value determined by thePSAT. In this case, thePSATvalue was set
at 13 dBm; therefore, the amplifier position after the multi-plexer could, in principle, generate an additional 13 dB of signal power and hence boost the system operating margin by 13 dB. However, in practice, this would not be true because the amplifier would be driven into saturation and, in the case of a semiconductor optical amplifier (SOA), nonlinear proc-esses could dominate the system performance. Neglecting the influence of nonlinear behavior for the time being, Fig. 3
clearly shows that placing an amplifier at the input to the net-work in this way would not offer any real advantage, and could as the channel count is increased, be deleterious to the system performance. For example, eight transmit wave-lengths with 3 dBm transmitter power and 5 dB multiplexer losses would present 7 dBm input power into the amplifier. This is only marginally less than the 13 dBm saturation output power from the amplifier, so each channel of the amplifier could deliver (in ideal circumstances) 6 dB of gain. At the higher channel counts, the combined power is higher than that of the amplifier’s saturation power; therefore, amplifica-tion is not feasible and at worst is detrimental, particularly in the case of semiconductor amplifiers where nonlinear proc-esses would dominate the performance.
However, if the amplifier is positioned some way into the network, the transmitter power will have been attenuated and the amplifier can be used to boost the signal to increase the network path loss capability. Eventually, if the signal is highly attenuated before being amplified, the SNR degrades to the extent that it cannot be recovered by amplification alone. The exact position where this drop off in performance occurs is determined mainly by the amplifier NF. Here, we will focus attention more closely in the area where the ampli-fier delivers the greatest benefit.
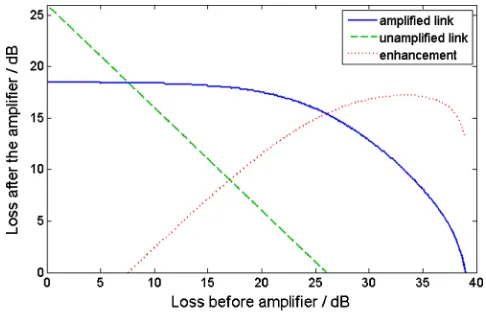
Figure 4 shows the benefit delivered by an amplifier throughout the link. If the amplifier is positioned at the trans-mitter directly after multiplexing, this is detrimental because of the effects of gain compression, as previously discussed. Other than compressing the amplifier gain in response to a strong input signal, the present model does not correct for gain-dependent nonlinearity in an semiconductor optical amplifier that may influence the system BER. However, this region of operation is not relevant to the present analysis. As the attenuation before the amplifier increases, the addi-tional reach becomes more beneficial. With significant losses
before the amplifier, e.g., around 30 dB, the enhancement in the path loss capability reaches its maximum, approximately equivalent to the gain of the amplifier, in this case 18 dB. This high loss before the amplifier to reduce signal power into the amplifier is analogous to reducing the transmitter power in a lower loss network. In the present context, this is significant because it means that the transmitter power may be decreased to minimize overall power consumption while still maintaining an adequate SNR. Reducing the trans-mitter power consumption can also reduce the power needed to maintain the operational wavelength stability required of a DWDM transmitter. Typically, the wavelength drift in a DFB laser is0.1 nm∕°C; transmitters must, therefore, be held at a constant temperature. Lowering the output power from the transmitter reduces the active thermal load placed on any cooling at the transmitters which will have the effect of reducing the power consumption of the thermoelectric cooler required to stabilize the temperature.
6 Power Savings
The analysis presented above demonstrated that the impact of reduced signal strength can be recovered using appropriate amplification. The scenario that was examined relates to the case where a relatively low specification amplifier (18 dB Gain,PSAT13 dBm, and NF 8 dB) is used to boost signals
midspan. In this case, once the signals become attenuated by a significant degree, e.g., 20 dB, then the benefit that the amplifier can deliver also becomes significant. In the present context, this is interesting because signal attenuation is equivalent to a reduction in signal launch power which means that reducing the launch power and compensating using an amplifier may potentially lead to an overall reduc-tion in power usage.
To evaluate the scale of such a potential enhancement, we need to estimate the overall power usage, including the trans-mitter drive current and also the power consumption related to temperature control. The focus concerns the use of WDM-PON on aircraft, which represents a particularly harsh envi-ronment with respect to temperature. The analysis will first be presented in relation to a room temperature environment before it is extended to cater for the temperature ranges char-acteristic of aircraft, which will give an idea of how cooling in extreme temperatures alters the power savings.
Typically, the threshold current of a DFB laser is in the region of 10 mA and the output power typically rises by 0.1 mW∕mA. Reducing the transmit power from 2 to 0.5 mW (6 dB) saves around 15 mA of current. In the case of a DFB transmitter, reducing the drive current in this manner will reduce the ER that can be achieved and this must be accounted for. In the following analysis, a power penalty corresponding to an ER of 7 dB is added for the low current transmitter in the amplified network. A 20 dB ER is assumed for the unamplified scenario; 20 dB represents a near ideal condition. In practice, it may be much lower, nearer 10 dB; however, the near ideal case is a useful benchmark. The reduced ER for the low power transmission case is more problematic. Here, we have assumed that 7 dB is attainable, which might not be the case. Nonetheless, the analysis is still important because alternative transmitters which have low power con-sumption with low output power but have high ER may be substituted for DFB lasers.
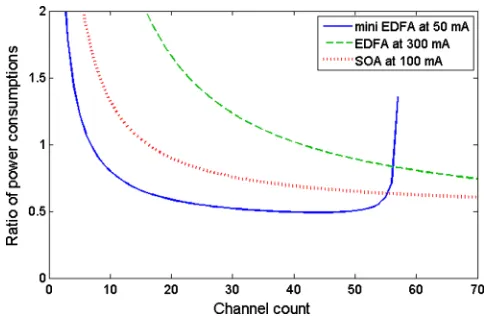
[image:4.630.61.304.578.734.2]Figure5presents the power consumption of an amplified network, relative to that of the unamplified network, for three different amplifiers of varying levels of power consumption in a preamplifier set up with all components at 25°C and each channel operating at 1.25 Gbps. The power consumption is calculated by solving the network link budget analysis to find the lowest transmit power to realize a BER of 10 to 12. At this point, the total network power consumption is calculated. Power requirements for a thermoelectric cooler (TEC) at each transmitter are included in the calculations. The three cases considered, their gain,PSAT, and pump
cur-rents are shown below in Table1. The first case, the minia-ture erbium-doped fiber amplifier (EDFA), is an amplifier delivering high gain but lowPSAT. It has low drive current
requirements and does not require cooling between 0°C and þ70°C. This amplifier should deliver enhancement in link performance when it has small input powers corresponding to low channel count links. Clearly, this amplifier can only be used to boost signals within the 1520 to 1560 nm range. Signals in the 1310 nm band will require an alternative tech-nology (potentially a semiconductor amplifier). Nonetheless, the analysis is valid to benchmark the potential performance benefits. Alternatively, a C&L multiplexer may be used and the C band used for the upstream and the L for the down-stream traffic. The second amplifier is a high power EDFA; this amplifier has high current requirements and does require cooling but gives high gain and high PSAT.
This should offer improvements in high power with high channel count links. Finally, we consider an SOA; this has medium current and cooling requirements and gives a low gain and moderate PSAT. This should offer benefits in
medium channel count links, with channel numbers between those improved by the two types of EFDA. The analysis that
is presented is not exhaustive and could have taken into account more amplifiers with differentPSATand gain values.
Nonetheless, the performance benefits can be illustrated. The analysis presented in Fig.5 assumes that each user requires 3 dBm of transmitter power, which corresponds to∼30 mAof drive current. With the inclusion of the ampli-fier, this current requirement is reduced as the amplifier gain balances the system needs. At low channel counts the inclu-sion of an amplifier is not effective, as the additional power required to drive and cool the amplifier adds significantly to the network total. However, as the channel count increases, the power consumption of the amplifier is shared between greater numbers of channels and a reduction in power con-sumption per channel is realized.
In order to compare the same conditions across the three amplifiers, a 32 channel link has been chosen for the follow-ing comparison. The greatest savfollow-ing, of 49%, is realized with the use of the mini EDFA. The low drive current and lack of cooling means that even at relatively low channel counts, the mini EDFA will offer a benefit over the unamplified link. However, at higher channel counts, the amplifier will satu-rate due to the lowPSAT. Initially, this can be overcome with
higher transmitter power, but this leads to increased power consumption. As the channel count increases, so does the optical input power to the amplifier; eventually, enough power will not be delivered per channel and the link will fail. This explains the bathtub shape of the curve in Fig.5. The enhancement was also calculated for a high power EDFA. Due to the high power consumption of this amplifier and its associated cooling, the energy savings are not realized as with the mini EDFA, although due to the higher PSAT,
many more channels can be accommodated. An alternative to fiber amplifiers is to use an SOA. The particular SOA used in this model is not the usual choice for a preamplifier which typically has high gain and lowPSAT; in this case, it is
impor-tant to have a highPSAT, to perform at higher channel counts
and offer scalability, so a booster amplifier has been chosen although it will be used as a preamplifier. With the SOA, a saving of 27% is predicted. The SOA performance can be seen as a compromise between the two types of EDFA; it will work at higher channel counts than the mini EDFA due to an increased saturation power, but offers a better sav-ing at the low powers than the high power EDFA. The over-arching result from the analysis of these amplifiers is that if we include an amplifier in a WDM-PON where minimal cooling is required, the energy use of the network can be significantly reduced.
6.1 Operation over Extended Temperature Ranges
A line replaceable unit (LRU) in an avionic system is a modular component of an aircraft designed to be replaced quickly at an operating location. In this context, it can be a box in the avionics bay containing the mission control net-work. It is possible that future LRUs may require a high bandwidth link to other areas throughout the aircraft.
The temperature history in an LRU on a commercial air-craft is shown in Fig.6; this has been measured by BAE Systems but the results are not available in the public domain. Figure 6 shows the fraction of time the LRU spent at each smaller, 5 deg temperature range over a com-bined flight duration of roughly 100 h. Effectively, this is a cumulative distribution. To establish the power usage over
[image:5.630.61.305.58.216.2]Fig. 5 Relative power consumption of amplified WDM-PON to unam-plified WDM-PON as a function of channel count for three amplifier technologies.
Table 1 Network amplification parameters.
Amplifier Drive Current Gain (dB) Psat(dBm) NF (dB)
Mini EDFA16 50 mA 29 9 4
EDFA17 300 mA 20 16 4.3
[image:5.630.63.302.669.749.2]this temperature range, the power consumption of a thermo electric cooler in a butterfly package with an SOA was mea-sured for a range of drive currents to the SOA at temperatures plotted in Fig.6. With knowledge of the fractional time spent at each temperature, a weighted average for the power con-sumption of the cooling can be calculated with varying drive currents to the SOA. Due to the similarities of the SOA and DFB laser, the thermal load on the SOA is expected to be comparable to what the thermal load would be for a DFB; so this weighted average is representative of the power con-sumption of the expected cooling for each transmitter in the network. The analysis has again been carried out for three amplifiers and is shown in Fig.7.
The power consumption of a thermo electric cooler when the weighted average temperature is 40°C is 40 mW. This erodes the relative saving per transmitter. However, the inclu-sion of the mini EDFA still offers a 21% reduction in power consumption and the SOA offers a 10% reduction (both for a 32 channel link) and the power consumption of the cooling is still sufficiently low so as to make the implementation of WDM realistic. The network capacity with 32 channels is a 40 Gbps link. This exceeds the current requirements, there-fore, greater channel counts are not envisioned as being required at this point in time on an aircraft; however, with the use of an SOA, this concept allows for significant
power savings if the network is scaled. At 64 channels, the inclusion of an SOA offers a reduction in power con-sumption of 15% and the gain is compressed by <0.5 dB, so there will be no gain dependent nonlinear effects during amplification and there is still the possibility for further scaling.
6.2 Full Temperature Specification
For a component to be specified for operation throughout the aircraft, it must be able to operate in the temperature range of
−55°Ctoþ125°C.19As shown in the LRU case, the temper-ature is not distributed uniformly across the operating range and there is no reason to assume that this will not be the same in other areas of the aircraft. There is a lack of information about the temperature distribution in the full operating perature specification. However, it is unlikely that this tem-perature distribution would be uniform; it is more probable that the time spent at a mean middistribution temperature would be considerably longer than that at the extremes of the specified range. In the following analysis, the tempera-ture distribution has been assumed to be a Gaussian distri-bution with the mean temperature atþ35°Cand the extremes of the operating range at three standard deviations from the mean. It is worth noting that this is an assumption and at this point it is not known how much exposure to the extremes there will be. Although a thermoelectric cooler cannot oper-ate throughout the entirety of this range, the power consump-tions of such a cooler have been extrapolated into this range to illustrate the power consumption over the full avionic tem-perature profile.
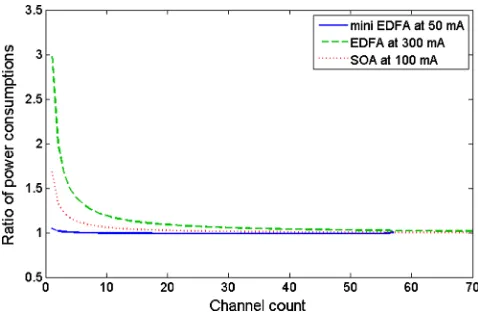
A weighted average for the power consumption of a TEC in this environment has been calculated and it exceeds 1 W per transmitter. When we consider that the power consump-tion of the transmitters is in the order of tens of milliwatts, it is clear that the level of power required by the cooling is unfeasible on an aircraft. As shown in Fig.8, it also com-pletely erodes the savings made with the inclusion of an amplifier, with the cooling power requirements two orders of magnitude greater than the saving at the transmitters. This analysis shows that even with the power savings associated with the optical amplification deployment of WDM PON on aircraft, it is not feasible due to excessive cooling requirements which stem from passive heating. Significant savings in the power consumption of the cooling
Fig. 6 Measured temperatures in a line replaceable unit (LRU) on a commercial jet.
Fig. 7 Relative power consumption of amplified WDM-PON in a tem-perature range found on board a commercial jet.
[image:6.630.63.303.57.209.2] [image:6.630.62.304.552.726.2] [image:6.630.326.565.569.725.2]must be realized before this can realistically be used on air-craft over the extended operational temperature range. Nevertheless, the power savings predicted in the less harsh environments mean that this technique may be useful in certain areas or types of aircraft.
7 Conclusion
With the continued drive to reduce weight on aircraft for eco-nomic and environmental reasons, optical networks have been taken up to meet this need. This paper has proposed the use of WDM-PON and considered a method for reducing the power consumption of WDM-PON using preamplifica-tion. Through analysis of power consumption of both ampli-fied and unampliampli-fied WDM-PON in a range of environments found on aircraft, it has been shown that power savings can be realized in realistic conditions. Realistic reductions in power consumption (considering the transmitter and its cool-ing) with the transmitter exposed to various temperature ranges have been calculated for three different scenarios. In the first case, the temperature is assumed to be a constant atþ25°Cand the WDM-PON has 32 channels with savings around the order of 50% predicted. The second temperature range is taken from experimentally measured data from a civil passenger jet, which ranges from þ17°C to þ57°C; for long term operation in this range, savings of 10% to 21% are predicted for a 32-channel WDM-PON depending on the choice of amplifier. The use of an SOA in this case also offers considerable scope for scaling, as the amplifier is a long way from saturation and can amplify 64 channels with less than 0.5 dB of gain compression. Finally, the calculations were repeated over the avionic temperature specification of −55°Ctoþ125°C; in this case, the power consumption for thermally regulating the lasers and ampli-fiers was almost two orders of magnitude higher than the power consumption of the optical transmitters. This power consumption is too high to be considered feasible on an air-craft over the extended temperature range.
Acknowledgments
This work was funded by EPSRC grant number EP/ G037523/1.
References
1. S. F. Habiby and M. J. Hackert,“RONIA results: WDM-based optical networks in aircraft applications,”inAVFOP, pp. 71–72, IEEE, San
Diego, California (2008).
2. A. Banerjee et al.,“Wavelength-division-multiplexed passive optical network (WDM-PON) technologies for broadband access: a review [Invited],”J. Opt. Networking4(11), 737–758 (2005).
3. “Full service access network,” Next Generation PON Task Group (NGPON) [Online],http://www.fsan.org(1 7 2013).
4. S.-G. Mun, H.-S. Cho, and C.-H. Lee,“A cost-effective WDM-PON using a multiple section Fabry–Pérot laser diode,”IEEE Photonics Technol. Lett.23(1), 3–5 (2011).
5. S. F. Habiby and M. J. Hackert,“RONIA results: WDM-based optical networks in aircraft applications,”inIEEE Avionics Fiber-Optics and Photonics Conf. (AVFOP), San Diego, California, pp. 71–72 (2008). 6. J.-H. Park, J.-S. Baik, and C.-H. Lee, “Fault-localization in WDMPONs,” in National Fiber Optic Engineers Conf., IEEE, Anaheim, California (2006).
7. K. Y. Cho, Y. Takushima, and Y. C. Chung,“10-Gb∕soperation of RSOA for WDM PON,” Photonics Technol. Lett. 20(18), 1533– 1535 (2008).
8. K. Lee et al.,“Energy efficiency of optical transceivers in fiber access networks,”J. Opt. Commun. Netw,4(9), A59–A68 (2012). 9. A. Borghesani,“Optoelectronic components for WDM-PON,”inIEEE
Proc. ICTON, pp. 305–309 (2007).
10. C. Michie et al.,“An adjustable gain clamped semiconductor optical amplifier (AGC-SOA),” J. Lightwave Technol. 25(6), 1466–1473 (2007).
11. G. Proudley,“De-risking future avionic optical physical layer using OSCAR,” inFibre Optics in Harsh Environments Conf., Swindon, UK (2009).
12. http://www.sanspot.com/v/vspfiles/downloadables/FTGN3025Q1TAx .pdf(15 November 2013).
13. http://www.liverage.com.tw/UploadFile/Download/2011621537015T37 U0SC.pdf(15 November 2013).
14. G. P. Agrawal,“Optical receivers,”in Fiber-Optic Communication Systems, 3rd ed., pp. 155–167, Wiley, New York (2002).
15. C. Michie et al.,“Optically amplified passive optical networks: a power budget analysis,”J. Opt. Networking8, 370–382 (2009). 16. http://www.3spgroup.com/3SPG/ProductsFlas.php?locale=en&Line_
no=22&sub_category_id=5400&cat_category_id=400(9 January 2014). 17. http://www.3spgroup.com/3SPG/ProductsFlas.php?locale=en&Line_ no=22&sub_category_id=5400&cat_category_id=400(9 January 2014). 18. http://www.kamelian.com/data/opb_15_ds.pdf(20 October 2014). 19. R. D. Gardner et al.,“PHONAV—a photonic WDM network
architec-ture for next generation avionics systems,”inIEEE Aerospace Conf., Aspen, Colorado, pp. 451–466 (1999).