City, University of London Institutional Repository
Citation
:
Moeller, S. and Zhu, L. An Analysis of Short-Term Performance of UK Cross-Border Mergers and Acquisitions by Chinese Listed Companies. .This is the published version of the paper.
This version of the publication may differ from the final published
version.
Permanent repository link:
http://openaccess.city.ac.uk/15988/Link to published version
:
Copyright and reuse:
City Research Online aims to make research
outputs of City, University of London available to a wider audience.
Copyright and Moral Rights remain with the author(s) and/or copyright
holders. URLs from City Research Online may be freely distributed and
linked to.
City Research Online: http://openaccess.city.ac.uk/ [email protected]
1
An Analysis of Short-term Performance of UK
Cross-border Mergers and Acquisitions
by Chinese Listed Companies
Lin Zhu
Cass Business School, City, University of London
Scott Moeller*
Cass Business School, City, University of London
Using a unique and proprietary database of Chinese cross-border mergers and acquisitions into the UK from 2012 to early 2016, this paper investigates the short-term performance of UK cross-border mergers and acquisitions acquired by Chinese publicly-listed companies. Using event study analysis with four different time-period windows, the results show that Chinese acquirers have earned significantly positive abnormal returns on the first day following the announcement date of M&A deals, however, these positive returns faded away over time. In addition, we conduct the event analysis by sector subsamples. The findings suggest that Chinese acquirers in Real Estate and other business sector deals have gained positive abnormal returns, while those in the Financial sector had negative abnormal returns. Regarding the factors that drive stock performance, the paper takes five of the most related deal characteristics into consideration both in univariate analysis and regression analysis. The results indicate that target form (public/private) and absolute transaction size are the most influential factors on the short-term performance of these Chinese acquiring firms: acquirers engaged in deals where the target firms are UK private and small/medium-sized earn statistically significant higher abnormal returns than those UK public and large-sized targets.
Key Words: cross-border; mergers and acquisitions; abnormal return; cumulative abnormal return;
China; UK
This draft: 2 November 2016
*Corresponding author: Professor Scott Moeller, Mergers & Acquisitions Research Centre, Cass Business School, City, University of London. Email: [email protected].
2
Introduction
For the past 110 years or more, mergers and acquisitions (M&A), by which two companies are united to achieve strategic and business objectives, are of great importance to both companies as well as many other stakeholders including employees, competitors, communities and the overall economy (Sudarsanam, 2010). These deals go in waves, whether in terms of total deal volume, industries, payment terms, and other factors. This paper addresses one of those waves: in the previous couple of decades, the number of M&A deals made by companies in foreign countries has increased substantially. These are known as cross-border mergers and acquisitions.
Chinese firms, responding to national economic reform policies, have been keenly pursuing their international presence. Boateng and Qian (2004) suggested that M&A activities involving firms from emerging economies to developed countries are primarily motivated by market development (including increasing market share, to enable faster entry into new markets), diversification and to obtain foreign advanced technology and other resources. In fact, the world witnessed the enormous expansion of Chinese investment in approximately 160 countries and regions in 2016, ranging from the United States (US), Association of Southeast Asian Nations (ASEAN), the European Union (EU), Australia to Russia. The United Kingdom (UK), considered by many as the easiest major economy with whom to do business in Europe, is one of the most popular countries for Chinese firms. The UK was ranked in first place of the top ten European target countries in cross-border M&A by deal value in 2014 followed by France and Germany (EY, 2014). It was reported that there were 91 Chinese cross-border M&A investments in the UK from January 2012 to June 2016, which also shows a significant upward trend for the last couple of years. The deal value is also remarkable, aggregated at more than $35 billion. An unpublished study by Grisons Peak LLP for the European Commission looked at inbound European deal activity from China from January 2014 to December 2015 and also found that the UK had the highest deal volume amongst all European countries and ranked second behind Italy on deal value (Grisons Peak, 2016). As a result, it would be useful to analyse these Chinese cross-border M&A investments in the UK and, in particular, how those Chinese acquirers perform in these deals.
Companies invest billions of dollars in making M&A investments where success or failure has an enormous impact for both shareholders and debt lenders of acquiring firms. The success of a merger or acquisition depends upon the particular stakeholder perspective adopted and the success criteria that flows from that perspective (Sudarsanam, 2010). From the financial theory perspective, assessment of value creation to shareholders represents the primary focus. One of the most widespread views about M&A is that most M&A deals fail, and thus it is of great interest to determine whether an M&A investment, or indeed a portfolio of investments, is value-adding to the shareholders. That is to say, if we can show that the value of their shares have increased because of the M&A event, then perhaps a conclusion can be drawn that this merger or acquisition is successful at bringing higher returns to shareholders than the risk embedding behind the investments. There are usually two ways to organise such an assessment: the event study method based on share prices and the operating performance method based on accounting analysis. The event study method can be applied, with certain caveats that will be discussed later, to measure the short-run stock performance as well as the long-run share price performance. The other common analytical method, operating performance, is measured based on the financial statements before and after the M&A event and is difficult to use therefore for very short time periods.
3
In this paper, the following questions have been asked and answered:
1) Whether the cross-border M&A deals create value to the shareholders of Chinese acquiring firms; in other words, what is the short-run stock performance of Chinese-listed acquiring companies engaged with UK targets?
2) To what extent the corporate M&A announcements have resulted in value generation for the acquirer.
3) Which factors affect the short-run value creation process?
The rest of the paper is organised as follows: the literature review looks at the existing literature related to cross-border M&A performance with an emphasis on the event study methodology and the drivers of abnormal return. Then follows an overview of Chinese cross-border M&A into the UK from 2012 to 2016. The data and methodology discusses the data sample (as provided by Grisons Peak (UK) LLP) and the analytical methods used, followed by the results and discussion, conclusions of this study and finally the limitations and recommendations for further research.
Literature Review
There has been a long-debated controversy whether M&A creates or destroys value for the combined enterprises. A large number of studies, like empirical study, support the theory of value creation showing that after the merger or acquisition, value increases. There are many reasons given for this, with one of the most common being due to the synergies achieved by the newly-combined firms. Trautwein (1990) and Yook (2003) grouped the synergies into three kinds, namely financial synergy, operational synergy, and managerial synergy, which is on the basis of prior studies conducted by Dennis and McConnel (1986) and Andrade et al. (2001).
Apart from synergies theory, some researchers have put forward the other sources of value creation, such as tax benefit, diversification and the development of the security marketability (Mandelker, 1974) and evaluate the differences between the bidding and target-firm management (Ghosh, 2004). But empirical research could not fully show important value development or even decrease for the combined enterprise if the merger and acquisition only transfers the capital from the acquirer to the target-firm shareholder and thus there are also theories based on non-financial factors such as hubris (Roll, 1986), empire-building (Shleifer and Vishney, 1989), managerialism (Seth et al., 2000), or agency issues (Weston and Weaver, 2001).
Grouping the research of performance into bidder and target sides, the target firm’s performance is always positive (Roll, 1986; Campa and Hernando, 2004). But there still is no agreement on the performance of the acquirer. Quite a few scholars, for example, Conn (1985) and Jarrel et al. (1988) state that the acquirer usually shows positive performance after implementing the merger and acquisition, but, based on the research of Tuch and O’Sullivan (2007), the bad performance of the acquirer would not show for a long time so short-term studies may be misleading. Of 44 studies analysed by Bruner (2002), he concluded that acquiring firms have negative returns and targets are have positive returns.
Methodology used in M&A research
4 Event Study Methodology
An event study, also called residual analysis, is designed as an empirical investigation of the relationship between stock prices and economic or corporate events (Strong, 1992). Efficient markets hypothesis states share prices reflect all available information, and that greater or lesser than expected returns could only be earned by chance. Hence, abnormal return (AR) is introduced to calculate the difference between actual return and expected return around the time of important announcements or events. There are many different models of expected returns.
The simplest is the Index Model which assumes a stock will earn the market rate of return over any time period (Lakonishok et al., 1990). Then, the AR is the actual return less the market rate of return.
Another similar model uses the average return during the estimation period to replace the market rate of return, which is called the Average Return Model.
The Capital Asset Pricing Model (CAPM) controls for the security risk as well as for the market. The expected return of a stock or a portfolio is expressed as: E(Ri) = Rf + i *(Rm-Rf). Rf
represents the risk-free rate, Rm measures the market portfolio return and is the systematic
risk of security relative to the market index. Clearly, the AR is then given by the difference between Rq and Rf + q*(Rm-Rf).
Lastly, the Market Model (MM) is the most widely-used methodology in event studies. It estimates the relationship between a share’s returns and returns on the market by ordinary least squares (OLS) regression and the use of such a relationship to estimate expected returns, given returns on the market (Bowman, 1983). A one-factor OLS regression equation is Rit =
i+i*Rmt+eit, where i and i are regression coefficients and eit is the error term with a mean
zero. The effect of firm-specific events is meant to be fully captured in the error term, representing the unsystematic component. As a result, AR equals Rit – (i+i*Rmt).
In 1969, Fama et al. employed this last model to study the ARs around the announcement of stock splits by collecting all monthly data for 1926-1960 and estimating each stock’s market model coefficients and . This is the earliest and most influential event study. Though the opinion on which benchmark model outperforms the others has not reached an agreement, Seyhun (1986) produced results that MM abnormal returns are superior at less bias because of the size effect. Chopra et al. (1992) confirmed the CAPM can distort results when stock or portfolio has very different betas.
In the M&A domain, MM is also the most common benchmark to conduct event study, for both domestic and cross-border research. For example, Bae et al. (2002) collected a sample from 1981 to 1997 for Korean non-financial M&A activities and conclude that acquiring firms achieve significantly positive ARs in a three-day, 11-day and 21-day event window. Similarly, Moeller et al. (2004), focusing on the US market, conducted a 1980-2001 sample period event study to summarise a significantly positive market reaction to acquisition announcement. In this paper, therefore, MM has been chosen as the expected return benchmark to calculate cumulative abnormal returns (CARs).
Identification of the correct event window is important in event studies. Choice of time around event announcement is dependent on what is being investigated. Glascock et al. (1991) asserted that it is easier to find out any AR presence if a shorter event period is used. In practice, a two-day event window is most common if the event date can be determined precisely, supplemented by cumulative abnormal returns for longer periods ex and post (Armitage, 1995). If the event date is not straightforward, then it would be better to choose one of the days at random as the event date (Dyckman et al., 1984).
Operating Performance Methodology
5
the abnormal stock return, operating performance after M&A can be treated as the measure of realised synergies, both on the revenue and expense sides.
The use of accounting information has been a popular method for determining the long-run operating performance of M&A. Healy et al. (1992) measured the 50 largest US takeovers between 1979 and 1984 by comparing pre-tax operating cash flow returns on assets and reported positive post-merger operating performance compared to their industry peers. Such results have also been supported by many other scholars, such as Manson et al. (2000), Heron and Lie (2002), and Powell and Stark (2005) for domestic M&A. In contrast, Sharma and Ho (2002) and Bouwman et al. (2009) showed that more than 50% of the sample companies experienced losses during the M&A year and the two years after the M&A deal.
Regarding cross-border M&A, the results are surprisingly insignificant. One of the most notable studies in this area was carried out by Moeller and Schlingemann (2005) who concluded that the operating performance after M&A is significantly negative compared to the combined pre-M&A performance of acquiring and target firms. That is to say, the expected synergies have not been achieved and there are as well related costs that have occurred due to the internationally complex integrating and coordinating processes. Thus, they conclude, cross-border M&A might result in higher expenses and, ultimately, lower profitability.
Short-term performance of cross-border M&A activities of acquiring firms
Along with the the increasing liquidity of global financial markets, the growth of cross-border M&A activities has soared over the past twenty years. Eun et al. (1996) suggest that accompanying the increasing integration of the world economy and liberalisation of restrictions on international capital flows, the global market for corporate M&A deals has increased as well. As a consequence, cross-border M&A has been at the centre of a subset of business and management research. Benefiting from the possibility of internationalisation and reverse internalisation, it is assumed that the impact of a cross-border M&A deal announcement on the combined value of the acquirer and target firms should be positive, notwithstanding some of the aforementioned research.
For example, some studies have found that the short-run performance of target firms is positive and significant (Bruner, 2002 and Campa and Hernando, 2004). The positive value effect on target shares is logical as the bidders typically pay premiums to target shareholders in order to compensate them to give up control rights. As a result, the market value of target firms will escalate dramatically. However, the results for acquiring companies are mixed. Antonios et al. (2007) used UK-listed frequent acquirers from 1987-2004 as a sample to show a significant +1.26% accumulative abnormal return between -2 to +2 event windows. Conversely, a huge body of literature reveals the opposite result. For instance, Doukas and Travlos (1988) studied US acquiring firms with a result of no significant impact on bidder shareholder wealth in the short term. These findings were supported by Golubov et al. (2012).
More specifically, many studies have shown significantly negative abnormal returns for the bidders. Under the MM, Datta and Puia (1995) produced proof of significant negative performance for acquiring companies. Danbolt (1995) made a comparison study for acquiring firms from various countries and concluded that UK acquiring firms earn significant negative abnormal returns over the event window from -8 to +5 months. Aw and Chatterjee (2004) confirmed similar findings in their articles based on the average return model and MM. They found that acquiring companies experienced a negative performance ranging from -1.2% to -8.07% in cross-border merger and acquisition activities. Based on prior research (Uysal, 2001), it can be concluded that cross-border M&A activities can benefit the target company with a short-term stock abnormal return but, for the bidders, the market reaction is not homoscedastic. So, the factors driving the acquiring companies’ short term performance which come to people’s minds will be reviewed in the next section.
Performance drivers of cross-border M&A activities short-run performance
6
called determinants of M&A performance. Most prior studies have looked at the deal-related characteristics.
There are quite a lot of basic deal factors, such as relativeness or the M&A’s diversification, payment methods (cash, equity or mixed), private-or-public target firms and their geographical origins. It is proven that the relation between target and acquiring companies might exert great influences on the performance of bidders. Singh and Montgomery (1987) concluded that economies of scope, economies of scale, and market power are beneficial for creating the value with relation to the M&A deal. The research of Walker (2000) also support this opinion, and stated that the market power could be enhanced during this process and the size of the acquiring company can be raised by horizontal acquisition. But, frankly speaking, prior research has proved that in M&A deals without relation and diversity, value also could be created. For these diversifications, the value source is from the diversification’s influence, including the decrease of companies’ default risks, increase in debt capacities (Shleifer and Vishny, 1992) and a domestic capital market establishment (Stulz, 1990). To be more specific, unrelated M&A deals might benefit the managers more than the shareholders through the decrease of the managers’ employment risks (Amihud and Lev, 1981) and enhancement of the managers’ income through expanding the size of the company (Kroll et al., 1990).
From the aspect of payment methods, a large number of scholars, such as, Fuller and Glatzer (2003) and Danbolt (2004), state that if the payment method of M&A was cash, its value creation would be higher than that of other payment methods (shares or cash/shares mix). By contrast, Fuller et al. (2002) proposed more returns for M&A with stock than M&A with a cash transaction. One explanation for this made by Gaughan (2002) is that foreign target firms are not willing to receive currency from abroad. On the basis of this argument, it is not certain whether M&A with cash payment is superior to that of other kinds of payment.
As for the target company form, previous studies suggest that more value would be obtained for a bidding firm that merges or acquires a private firm. This outcome could be explained by the suggestion that the large-sized public company has a better market reputation. Therefore, the bidding firm is more likely to give more for the target that it can obtain in returns, which is finally harmful the wealth of the acquiring company’s shareholders. On the contrary, Draper and Paudyal (2006) stated that managing the private companies with few people would be more likely to exclude agency problems and enhance the bargaining force. And this force is able to make the target private company to extract a higher price leaving the newly-combined companies disadvantaged.
Related to different geographies of bidder and target, the combined firm’s performance would in the short-term, rely on the target’s geographical location. Doukas and Travlos (1988) proposed that the acquiring company’s shareholders could obtain returns if the target company is from less-developed regions, so the diversity could be enhanced by bidders through geography and industry at the same time. Chari et al. (2004) also supported this opinion. But Conn et al. (2001) stated that the acquiring company earns more returns when it undertakes the M&A investment to a target in Europe. The findings of Gleason et al. (2002) put forward certain conditions that would promote the CARs of acquiring firms if the target is in a country with less-restrictive tax regulation, a more open banking atmosphere and a lower level of regulation and intervention from the government.
7 Performance of Chinese outbound M&A activities
In terms of Chinese M&A activities, several Chinese scholars have studied M&A cases in domestic markets but few studies have entered into the cross-border dimension. Feng and Wu (2001) formulate an overall evaluation function of corporate performance by using accounting data and factor analysis. There is no significant change in firm performance in the first year of M&A but the improvements emerge in the second year and fall back in the third year. Zhu and Wang (2002) employ the accounting data to analyse the improvement of ROE and ROA for both acquiring and target companies in 67 M&A cases in 1998. Zhang (2003) suggests that M&A activities add value to the target company but have a negative influence upon shareholders’ income and financial performance in the bidding firm. Jiang (2003) reports a reverse U-shape relationship between the performance of acquiring companies and their previous acquisition experience.
More recently, Bhabra and Huang (2013) examined 137 M&A deals over the period from 1997 to 2007 conducted by Chinese public firms and found that acquirers earned significant positive ARs around the event announcement. Ning et al. (2014) used 335 Chinese cross-border M&A samples during 1991-2010 and discovered significant positive ARs for Chinese acquiring multinational enterprises. A similar result is also obtained by Tao and Liu (2016). Their study looks into the short-term stock performance of Chinese cross-border acquirers on the event announcement. The findings are that the announcement results in a positive stock market reaction and there is a negative relationship between the level of political risk and short-run performance of Chinese listed bidders. However, many other articles report opposite results, such as, Chen and Young (2010)’s study with 39 cross-border deals by 32 Chinese acquirers. They show negative average CARs around the announcement day. This result is supported by earlier studies of Aybar and Ficici (2009) who examine 433 cross-border M&A deals by 58 emerging-market companies including a significant proportion of Chinese firms.
Secondary Research Conclusion
To conclude, a large number of studies have examined the performance of acquiring companies in developed countries such as the US and UK. However, relatively few studies have undertaken an empirical study on cross-border M&As of Chinese companies, and the results of short-run performance of Chinese cross-border acquirers are mixed. The results of those studies are very mixed, with no definitive conclusion as to whether these deals add value or destry it. Therefore, it is imperative to conduct research into Chinese cross-border bidders using a different and recent database in order to test the short-run market performance surrounding the announcement date.
Overview of Chinese Cross-border M&A into the UK
In cross-border mergers and acquisitions activities, due to a flexible exchange rate, prudent financial regulation and an increasingly competitive corporate tax rate, the UK has become one of the most attractive international investor target countries in the world and the undisputed preferred target country in Europe. Over the past decade, a growing number of increasingly mature and confident Chinese investment companies have entered the global market and these play a significant role in global trade (EY, 2015). Along with the accelerated transformation of the Chinese economy and the enhanced strength of Chinese enterprise, a series of new government policies provide strong support for Chinese enterprises to go global. In the last five years, Foreign Direct Investment (FDI) has increased by more than nine times and M&A activities account for the largest share in China. What’s more, in this study, three distinctive stages of Chinese cross-border M&A trade in the UK have been classified based on the total trade volume and trade value, as follows:
Before 2012: Discontinuous Phase
8
business in July 2011, but few other M&A activities took place during this period. Therefore, this study intends to focus on the trade after 2012 when a wave of Chinese cross-border M&A investment in the UK arises.
2012-2014: Initial Phase
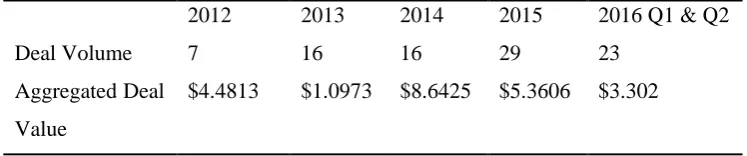
Following Chinese Investment Corp bid $779 million for minority stake of Thames Water Holdings Ltd on 20 January, 2012, this new wave of Chinese M&A investments into the UK started. In total, 39 deals were announced from January 2012 to December 2014, transacted at more than $27 billion. What’s more, it showed a significant increase in trade volume with 16 deals announced every year. The most remarkable trade took place among China National Nuclear Power Co (CGN) & China General Nuclear Power Corp (CNNC) and Hinkley Point C Nuclear Power Station1, priced at approximately $9.1 billion, and accounted for approximately 65 percent of that year’s value volume. In 2014, the outbound M&A activities into the UK in China had three large real estate deals, for example, Greenland Holdings bid $1.0 billion for London’s Canary Wharf Project. The consumer sector also bid $1.5 billion with Hony Capital acquisition of Pizza Express in 2014.
2015-2016: Booming Phase
[image:9.595.111.485.476.554.2]Following Chinese President Xi’s visit to the UK in October 2015, Sino-British relations were elevated to new heights in politics and business. During 2015 and 2016, the expansion of cross-border M&A activities were highly significant and reached a peak in 2015 when 29 M&A transactions were concluded, in which the purchase of China Minsheng Investment Corp for New London Financial District-Royal Albert Dock was valued at approximately $1.5 billion and represented the largest deal for the whole year. During the first two quarters of 2016, 23 M&A transactions were concluded, of which 16 transactions were during the second quarter even with the concern of Brexit, including the Create Group Corp bid of $1.2 billion for Bio Products Laboratory Ltd. After the result of UK referendum, there were still five deals announced by Chinese acquirers, including Dalian Wanda Group’s bid of $1.2 billion for Odeon & UCI Cinemas Group Ltd. It perhaps indicates that Chinese cross-border M&A investment in the UK is resilient with new opportunities continuing to be pursued despite – or perhaps because of – the turmoil in the UK markets post-Brexit.
Table 1. Deal Volume and Aggregated Deal Value in billion ($) 2012-2016
2012 2013 2014 2015 2016 Q1 & Q2
Deal Volume 7 16 16 29 23
Aggregated Deal Value
$4.4813 $1.0973 $8.6425 $5.3606 $3.302
Figures 1 and 2 (source: Grisons Peak LLP) directly demonstrate that the volume and total value of Chinese outbound M&A investments in the UK varies in different quarters but is remarkably steady with an increasing trend latter part of the whole period. Both deal volume and total deal value hit a record high in the second quarter of 2016 as a delayed follow-on to the aforementioned political visit by the Chinese president to the UK in the third quarter of 2015.
1 Because this utility deal is a significant outlier (higher) than the other deals in the sample, it is excluded from the 2013 Q4 samples in
9
[image:10.595.107.489.238.376.2]Figure 1. Chinese Cross-border M&A into the UK Deal Volume during 2012 and 2016
Figure 2. Chinese Cross-border M&A into the UK Aggregated Deal Value during 2012 and 2016
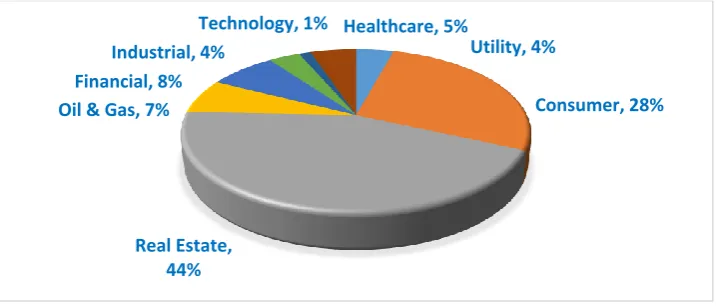
Dividing the total deals into eight different industry sectors, the consumer and real estate sectors account for the highest proportion of deal volume, which is nearly half. Industrial and financial sectors also attract a large portion with more than 10% respectively. Only 5% each of total deal volume is in both the healthcare and oil & gas sectors, which is unsurprising. Globally, China only began its outbound investments into the healthcare industry in 2016. With regard to the Oil & Gas sector, the UK is not a resource-based country, therefore, this type of M&A activity would and should be relatively small. Figure 3 shows this graphicly, with the largest proportion allocated to real estate projects with 43.87% of the total deal value. The consumer and financial sectors rank the second and the third position respectively. The other sectors take the minority share at only 21 percent. The results illustrate that China’s cross-border acquiring companies are mostly interested in UK real estate projects, especially for the commercial buildings of London, which observers suggest provides very profitably returns for overseas investors.
0 5 10 15 20
0 1 2 3
10
Figure 3. Share of China’s Cross-border M&A Deal Volume (by Target Sector)
Figure 4. Share of China’s Cross-border M&A Aggregated Deal Value (by Target Sector)
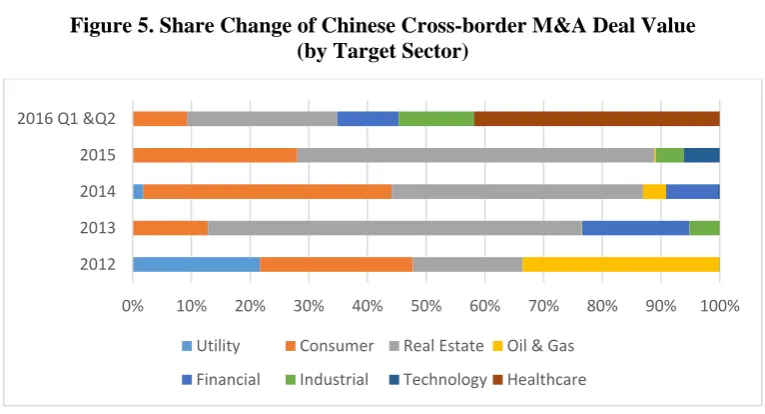
On a year-by-year basis as shown below in Figure 5, Chinese investors began their interest in the UK’s healthcare sector in 2016, whereas deals in that industry hadn’t occurred in previous years.
There is a different story for real estate which has always been the strongest sector for Chinese acquisitions in the UK every year of this study, especially in 2015. Summing $3.26 billion, seven transactions were made by Chinese investors to buy UK real estate projects in that period, including commercial and private buildings, hotels and other construction. Real estate faces a degree of downward pressure in the Chinese domestic market. Conversely, overseas real estate markets were projected to provide promising returns, and thus Chinese capital was allocated to the active purchase of buildings overseas. In early 2016, Poly Group and China Overseas Land set new investments in UK real estate. Although, as noted above, the uncertainty of Brexit existed in the second quarter of 2016, China Life and Hainan Airline continued to close their deals with Aldgate Tower and Courtyard Columbus-Marriott Hotel. The pace of “going out” for international real estate is expected to further accelerate (EY, 2015).
Moreover, Chinese cross-border M&A investments are growing in the consumer-driven industry. Chinese enterprises investing overseas aim to bring products and services to meet the growing Chinese domestic demand because of the expanding middle-class and increasing consumer consumption levels. To conclude, outbound M&A trade in China has become more mature as the enterprise focuses on creating a global strategies. Previously, cross-border investment activities were focused on the utility and oil & gas sectors. However, recently they have begun to expand into the technology, financial and healthcare sectors.
Utility, 6%
Consumer, 24%
Real Estate, 24% Oil & Gas, 5%
Financial, 11% Industrial, 16%
Technology, 8%
Healthcare, 5%
Utility, 4%
Consumer, 28%
Real Estate, 44% Oil & Gas, 7%
Financial, 8% Industrial, 4%
[image:11.595.119.479.277.430.2]11
Figure 5. Share Change of Chinese Cross-border M&A Deal Value (by Target Sector)
Data and Methodology
Data Source for Detailed Analysis
The initial sample information was provided by Grisons Peak LLP which is a UK based merchant bank focussed on cross border advisory which also has built a proprietary Chinese outbound database. Their firm’s “China Outbound Investments” product was launched in 2008 with a view of providing “primary source reconciled data” related to Chinese outbound investments. They monitor all Chinese outbound investments across countries, industries and by type or component of investment including M&A activities, government loans, government-led agreements, etc. Grisons Peak excludes all defence-related or security-defence-related investments. It was the kind provision of access to this unique database that was requested of Cass to conduct this project to look at the returns for Chinese investors of their investment activity in the UK.
Further information was collected from the Thomson ONE Banker deal database. This database provides detailed information about each announced and completed M&A deal globally. Stock prices within the event study period were gathered from Datastream, a data vendor that provides historical daily share prices of listed companies across the world. The corresponding market index was collected from Datastream as well. Due to the variety of stock exchanges that Chinese public companies are listed in, different market indices are selected to represent the market return. In this case, the Hang Seng Index, Shanghai Stock Exchange Composite Index, Shenzhen Stock Exchange Composite Index and Standard & Poor’s 500 Index are selected, where appropriate, as the benchmark performance.
Sample Selection
According to the database provided by Grisons Peak LLP, there were 96 Chinese outbound M&A activities into the UK during the period from 2012 through July 2016. The reason why this research does not include any transactions prior to 2012 is that the frequency of cross-border transactions between China and the UK were not significant until 2012, as discussed in the overview of Chinese cross-border M&A into the UK.
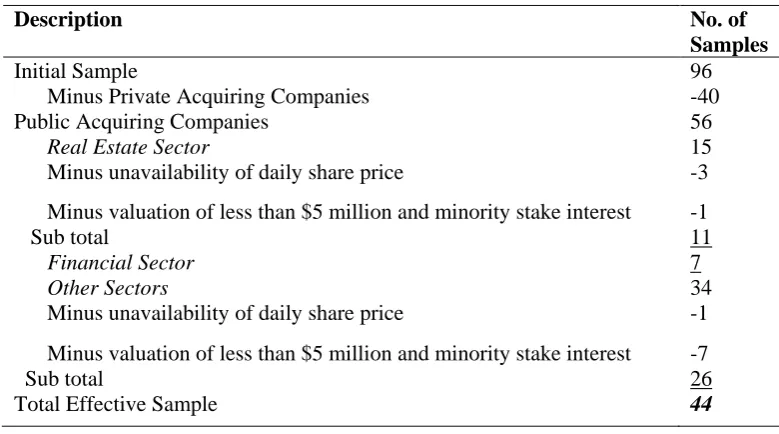
The following restrictions were inserted on the whole sample to become the effective final sample: 1) The samples are restricted to those acquisitions that involve Chinese public limited companies listed
on the Hong Kong, Shanghai, Shenzhen or New York stock exchange as an acquirer because only companies of that type are obliged by regulation to maintain proper records that facilitate reliable data collection.
0% 10% 20% 30% 40% 50% 60% 70% 80% 90% 100% 2012
2013 2014 2015 2016 Q1 &Q2
Utility Consumer Real Estate Oil & Gas
12
2) Deals in the financial sector and real estate are grouped separately from the others due to the different nature of assets and liabilities of financial firms and real estate companies and different financial reporting systems (Uddin and Boateng, 2014).
3) Deals that are valued lower than $5 million and represent a minority stake interest (less than 50%) in the target firms are excluded to eliminate the insignificant impact on the performance of the bidders.
[image:13.595.101.491.258.475.2]These restrictions have reduced a sample of 96 acquisitions to 56 Chinese public companies including 15 real estate deals and seven financial sector transactions. Furthermore, for three acquiring companies in the real estate sector and one company from another sector it was not possible to obtain daily share prices because they were unlisted during the event study period. In addition, one deal in the real estate sector and seven investments of other sectors are valued lower than $5 million and represent less than 50% interest in the target firm.
Table 2. Derivation of Final Sample
Description No. of
Samples
Initial Sample 96
Minus Private Acquiring Companies -40
Public Acquiring Companies 56
Real Estate Sector 15
Minus unavailability of daily share price -3
Minus valuation of less than $5 million and minority stake interest -1
Sub total 11
Financial Sector 7
Other Sectors 34
Minus unavailability of daily share price -1
Minus valuation of less than $5 million and minority stake interest -7
Sub total 26
Total Effective Sample 44
The imposition of such restrictions produced a final sample of 44 Chinese cross-border acquiring companies. Among them, there are 11 real estate firms and seven financial institutions. As the sources of data collection report the M&A activities irrespective of the future status of the acquiring companies, a sample drawn from those sources contains no survivorship bias.
Descriptive Statistics
13
Table 3. Sample Characteristics
Panel A: Year Distribution of Sample M&A Acquiring Companies
Year No. % in Total
2012 1 2.27
2013 6 13.63
2014 6 13.64
2015 17 38.64
2016 Q1 & Q2 12 27.27
July 2016 2 4.55
Total 44 100
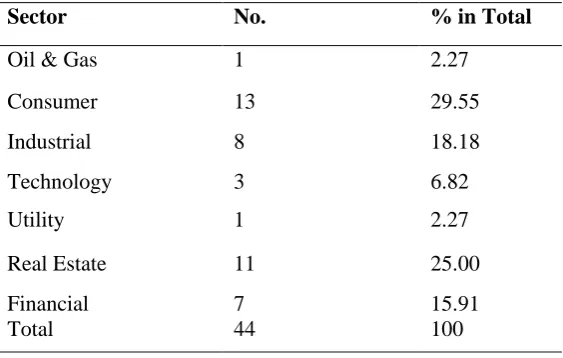
Panel B: Sector Distribution of Sample M&A Acquiring Companies
Sector No. % in Total
Oil & Gas 1 2.27
Consumer 13 29.55
Industrial 8 18.18
Technology 3 6.82
Utility 1 2.27
Real Estate 11 25.00
Financial 7 15.91
Total 44 100
Panel C: Stock Exchange Distribution of Sample M&A Acquiring Companies
Stock Exchange No. % in Total
HKG 20 45.45
SHA 14 31.82
SHEN 9 20.45
NYSE 1 2.27
14
Panel D: Sample Deal Characteristics of M&A Events
Description Sample
Characteristics
No. of
Acquisitions
% in Total
Related or Diversified Related1 34 77.27
Diversified 10 22.73
Total 44 100
Form of Target: Public or Private
Private 30 68.18
Public 14 31.82
Total 44 100
Payment Method Cash
Non-cash2 37 7
84.10 15.90
Total 44 100
Absolute Transaction Size Large3 28 63.64
Small and
Medium 4
16 36.36
Total 44 100
Relative Transaction Size Large5 10 22.73
Small and
Medium6
34 77.27
Total 44 100
1 A deal is identified as related if the target and the acquirer have the same two-digit SIC code.
2 Non-cash payments normally include shares exchange and a combination of cash and shares.
3 Large transactions are those valued at higher than $50 million deals.
4 Small and medium transactions are those valued at less than $50 million deals.
5 Relative transaction size is calculated as absolute transaction value divided by acquirer market capitalisation.
Relative large transactions are those relative transaction sized higher than 40%.
6 Relative small and medium transactions are those relative transactions sized less than 40%.
Methodology
15 Event Study Analysis
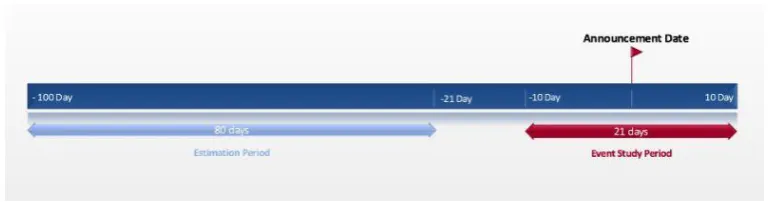
[image:16.595.105.492.233.334.2]The research uses an event study method to measure the short-run stock price performance of Chinese acquiring companies engaged in cross-border M&A activities into the UK. The event date is set to be the announcement date of the M&A event which is found in the Thomson ONE Banker database. Based on the previous studies shown earlier in this paper, the event study period is determined to be 10 days before to 10 days after the announcement date. That is to say, a 21-day period event study surrounding the announcement will be investigated within which shorter period event studies will also be conducted including 11-day, three-day and two-day event windows in order to capture the more significant announcement effect and increase the power of the test. The estimation period in this study started from the 100th day before the announcement date and ended on the 21th day before the event announcement.
Figure 6. Estimation Period and Event Study Period
The standard MM benchmark is employed to calculate the expected return of the sample firms’ stock price:
Rjt = αj + βj*Rmt + εjt, Where,
j = security of acquiring companies
t = day measured relative to announcement date, Rjt = actual return of security j on day t
Rjt = Pjt / Pjt-1 -1
Rmt = a proxy for returns of market portfolio, in this study, it represents the daily returns of Hang Seng Index (HIS)
Or Shanghai Stock Exchange Composite Index (SHCOMP) Or Shenzhen Stock Exchange Composite Index (SZCOMP) Or Standard & Poor’s 500 Index (S&P 500)
Rmt = Pmt / Pmt-1 -1
αj = OLS estimated period intercept of security j βj = OLS estimated period slope of security j
εjt = error term of daily return of security j on the event day t
Then the abnormal return (AR) for each sample event j on day t are obtained as follows: ARjt = Rjt – (αj + βj*Rmt),
16
ARjt = difference between the actual return and expected return to security j for day t Rjt = actual return to security j for day t
αj + βj*Rmt = expected return to security j for day t
The daily average abnormal return for each day t is calculated as: ARt = ∑𝑁𝑗=1ARjt*
1 𝑁
The cumulative abnormal return (CAR) for security j gained during the time window between K and L
equals to:
CAR j, K, L = ∑𝐿𝑡=𝐾ARjt
The average cumulative abnormal return (ACAR) for each security j gained during the time window between K and L equals to:
ACAR j, K, L =
1
𝑁∑ CAR
𝑁
𝑗=1 j, K, L
In order to examine the statistical significance of abnormal return and cumulative abnormal return for the event window, t-statistic will be used.
Regression Analysis
Besides the univariate analysis above, two regression models are used to test the combined effect of the above five factors to the performance of acquiring companies.
CAR j, -1, 1 = α + β1(RELA) + β2(TARFORM) + β3(PAYMETH) + β4(ABSIZE) + β5(RESIZE) + ε
CAR j, 0, 1 = α + β1(RELA) + β2(TARFORM) + β3(PAYMETH) + β4(ABSIZE) + β5(RESIZE) + ε
Where, CAR is the dependent variable representing the cumulative abnormal return gained by the sample firms for the (0, 1) and (-1, 1) event windows.
α: OLS estimated intercept, constant term.
βn: OLS estimated parameters for each independent variable, including:
RELA: Dummy variables of Related or Diversified, representing the industry relationship between the acquirer and target firm. M&A can be related or non-related depending on the similarity between target and bidding firm. As discussed earlier, a deal is defined as related if the target and acquirer share the same first two digits of primary SIC code, if not, it will be classified as a diversified transaction. This variable takes 1 if the event is related otherwise it takes 0.
TARFORM: Dummy variable of Target Form, public or private. This variable takes 1 when the target is private and 0 when the target is public.
PAYMETH: Dummy variable of Payment Method used in M&A events. A value of 1 will be assigned when the M&A is transacted by pure cash and 0 is set for the non-cash M&A activities (including stock or a combination of stock and cash payment methods).
ABSIZE: Absolute Transaction Size, displaying the logarithm of dollar price of absolute transaction size.
RESIZE: Relative Transaction Size is estimated as the dollar price of absolute transaction size divided by the market capitalisation of acquiring firms. This variable is set because some deal sizes are relatively small compared with acquirer’s size.
17
Results and Discussion
Here the results of the analysis conducted according to the methods and data sample described in the previous section are discussed. The first section is the univariate analysis of the performance of the Chinese acquisitions into the UK from 2012 to July 2016, and the second section provides the regression analysis.
Univariate Analysis
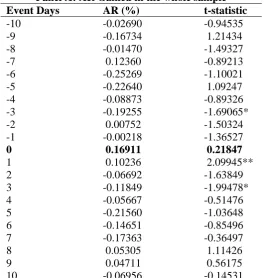
Table 4 describes the abnormal return achieved by the Chinese acquiring companies that undertook cross-border M&A activities in the UK during the period from 2012 through July 2016. In order to differentiate the financial and real estate sector from the others, abnormal return has been measured as a whole and also separately for those two industries. Panel B presents the completed sample in which most of the individual returns from ten days before to ten days after the announcement are negative. But acquiring firms earned positive abnormal returns on the announcement day and the day following the announcement which were 0.17% and 0.10% higher than the market expected return. Although the abnormal return on the announcement day is not statistically significant, the following return obtained a significant t-statistic of 2.09945. The result indicates the announcement of cross-border M&A deals created values for the shareholders of acquiring companies within this short time scale.
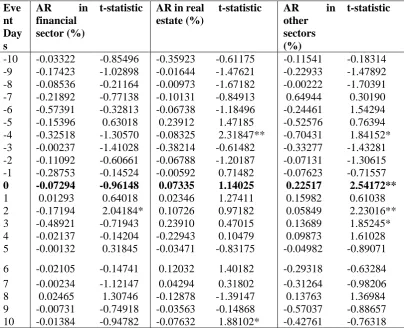
In Panel B, a more detailed picture of abnormal returns gained by acquirers in different sectors is shown. The whole sample is divided into three streams: financial sector, real estate sector and all other sectors. According to these results, the findings are as follows:
It is evident that the financial industry acquiring firms generated negative abnormal returns during most event days, only two of which were positive; therefore it was not statistically significant.
With respect to real estate deals, the acquiring companies obtained positive abnormal returns on the announcement day and the following +1, +2 and +3 days but, regrettably, none were statistically significant.
Other sectors, however, generated different outcomes. The individual returns showed that acquiring firms earned negative abnormal returns prior to the announcement of the M&A activities, but abnormal returns turned positive on the announcement day and positive values lasted for four days following the event announcement. Among them, two positive abnormal returns generated statistical significance at a 95% confidence level and one was significant at a 90% confidence level. The abnormal returns on the announcement days and two days after the announcement were 0.23% and 0.06%. Both were statistically significant at the 5% level. These results show that the announcement of Chinese outbound M&A activities targeting the UK generate positive values for the shareholders of bidders from other sectors (oil & gas, consumer, industrial, technology and utilities). However, in terms of the financial and real estate sectors, no obvious conclusion regarding value creation or value destruction can be drawn due to the statistical insignificance.
18
Table 4. Abnormal Return (AR) Gained in Each Event Day Panel A: AR Gained in the whole sample
Event Days AR (%) t-statistic
-10 -0.02690 -0.94535
-9 -0.16734 1.21434
-8 -0.01470 -1.49327
-7 0.12360 -0.89213
-6 -0.25269 -1.10021
-5 -0.22640 1.09247
-4 -0.08873 -0.89326
-3 -0.19255 -1.69065*
-2 0.00752 -1.50324
-1 -0.00218 -1.36527
0 0.16911 0.21847
1 0.10236 2.09945**
2 -0.06692 -1.63849
3 -0.11849 -1.99478*
4 -0.05667 -0.51476
5 -0.21560 -1.03648
6 -0.14651 -0.85496
7 -0.17363 -0.36497
8 0.05305 1.11426
9 0.04711 0.56175
10 -0.06956 -0.14531
19
Panel B: AR Gained in Different Sectors
Eve nt Day s
AR in
financial sector (%)
t-statistic AR in real
estate (%)
t-statistic AR in
other sectors (%)
t-statistic
-10 -0.03322 -0.85496 -0.35923 -0.61175 -0.11541 -0.18314 -9 -0.17423 -1.02898 -0.01644 -1.47621 -0.22933 -1.47892 -8 -0.08536 -0.21164 -0.00973 -1.67182 -0.00222 -1.70391 -7 -0.21892 -0.77138 -0.10131 -0.84913 0.64944 0.30190 -6 -0.57391 -0.32813 -0.06738 -1.18496 -0.24461 1.54294 -5 -0.15396 0.63018 0.23912 1.47185 -0.52576 0.76394 -4 -0.32518 -1.30570 -0.08325 2.31847** -0.70431 1.84152* -3 -0.00237 -1.41028 -0.38214 -0.61482 -0.33277 -1.43281 -2 -0.11092 -0.60661 -0.06788 -1.20187 -0.07131 -1.30615 -1 -0.28753 -0.14524 -0.00592 0.71482 -0.07623 -0.71557
0 -0.07294 -0.96148 0.07335 1.14025 0.22517 2.54172**
1 0.01293 0.64018 0.02346 1.27411 0.15982 0.61038 2 -0.17194 2.04184* 0.10726 0.97182 0.05849 2.23016** 3 -0.48921 -0.71943 0.23910 0.47015 0.13689 1.85245* 4 -0.02137 -0.14204 -0.22943 0.10479 0.09873 1.61028 5 -0.00132 0.31845 -0.03471 -0.83175 -0.04982 -0.89071 6 -0.02105 -0.14741 0.12032 1.40182 -0.29318 -0.63284 7 -0.00234 -1.12147 0.04294 0.31802 -0.31264 -0.98206 8 0.02465 1.30746 -0.12878 -1.39147 0.13763 1.36984 9 -0.00731 -0.74918 -0.03563 -0.14868 -0.57037 -0.88657 10 -0.01384 -0.94782 -0.07632 1.88102* -0.42761 -0.76318
Notes:Significance test is based on the T-distribution with a degree of freedom (df) of 6 for financial sector, 10
for real estate, and 25 for other sectors. Therefore, at the 95% and 90% confidence level, the critical values would be as follows:
95% confidence level 90% confidence level
df=6 2.447 1.943
df=10 2.228 1.812
df=25 2.060 1.708
[image:20.595.96.501.92.420.2]**p<0.05, *p<0.1.
Table 5. CAR for Chinese Cross-border M&A Acquirers
Panel A: CAR Gained by the whole sample
Event Window CAR (%) t-statistic
(-10, 10) -1.31612 -0.48067
(-5, 5) -0.68855 -1.67482
(-1, 1) 0.26929 0.41292
(0, 1) 0.27147 1.10837
Panel B: CAR Gained by Financial Sector
Event Window CAR (%) t-statistic
(-10, 10) -2.72934 -0.55639
(-5, 5) -1.62381 -0.78094
(-1, 1) -0.34754 -1.33291
20
Panel C: CAR Gained by Real Estate
Event Window CAR (%) t-statistic
(-10, 10) -0.75260 -0.30029
(-5, 5) -0.12104 -0.89914
(-1, 1) 0.09089 1.50792
(0, 1) 0.09681 0.41784
Panel D: CAR Gained by Other Sectors
Event Window CAR (%) t-statistic
(-10, 10) -2.48940 0.70148
(-5, 5) -1.08110 1.30294
(-1, 1) 0.30876 -0.87334
(0, 1) 0.38499 2.89274**
[image:21.595.142.455.92.160.2]Notes: **p<0.05, *p<0.1.
Figure 6 shows the overall trend of abnormal returns for the Chinese acquiring firms over the 21-day event period surrounding the international M&A announcement for UK targets. The result shows that the stock prices of Chinese acquiring firms fluctuated wildly during the sample period, especially for the financial and real estate sectors. It shows that abnormal returns are mostly positive from the day of announcement to the sixth day following corporate announcemen except for the financial sector deals. But this effect is weakened over the passage of time from the sixth day after announcement. The result is supported by research from Gubbi et al. (2010), Kohli and Mann (2012).
More specifically, acquiring Chinese companies in other sectors such as the consumer industry experience positive abnormal returns on the day and the following day after announcement. A typical example is the acquisition by Nanjing Xinjiekou Department Store Co Ltd (SHA: 600682) of Highland Group Holdings Ltd (House of Fraser) on 8 April 2014. The bidder obtained a positive abnormal return of 1.49% and 0.43% respectively on the announcement day and the first day after announcement. Both figures are statistically significant at 5% level.
The financial sector acquirers, on the other hand, does not show any positive abnormal returns upon the announcement and experience an obvious price decline on the third and fourth days after the event announcement. For example, Industrial Commercial Bank of China (ICBC, SHA: 601398) acquired 60% of Standard Bank Plc (Global Markets Units) for $765 million on 29 January 2014. The stock price of ICBC saw performance of 1.08% below the expected return on the announcement day and the negative abnormal returns last for the next five days.
21
Figure 6. Chart of AR Earned by Chinese Acquiring Firms
Panel A: Whole Sample and Other Sectors
Panel B: Financial Sector and Real Estate Sector
[image:22.595.111.487.290.447.2]As part of the univariate analysis, this study also examines the drivers of AR performance of Chinese bidders based on different characteristics of deals, namely payment method, the form of target (public or private), M&A strategy, absolute deal size and relative deal size. Table 6 shows the performance of bidders based on different, either relative or non-relative, industry relationships between two firms. The results show that relative M&A events gained relatively higher positive cumulative abnormal returns than non-relative ones for the event window (-1, 1) and (0, 1). However, the result is statistically insignificant because the sample sizes used were limited in number. Previous studies conducted by Gregory and McCorriston (2005) also support these findings. These studies conclude that cross-border acquisitions conducted in relative M&A deals would show better performance than those of non-relative deals.
Table 6. The results of abnormal returns based on Industry Relationships between Acquiring Firm and Target Firm
Event Window
CAR (%) for Related Deals
t-statistic CAR (%) for
Non-relative Deals
t-statistic
(-10, 10) -2.20914 -0.37485 -1.02184 -0.16842
(-5, 5) -0.10518 0.10148 -0.14015 -1.10147
(-1, 1) 0.22014 1.21395 0.00149 0.41015
(0, 1) 0.41028 0.21524 0.21541 1.30204
Notes: **p<0.05, *p<0.1.
Table 7 shows different CARs for Chinese acquiring firms engaged in cross-border M&A. They were mostly targeting two types of firms. Results indicate that acquirers show better performance with private
-1 -0.5 0 0.5 1
1 2 3 4 5 6 7 8 9 10 11 12 13 14 15 16 17 18 19 20 21
Whole Sample Other Sectors
-0.8 -0.6 -0.4 -0.2 0 0.2 0.4
1 2 3 4 5 6 7 8 9 10 11 12 13 14 15 16 17 18 19 20 21
[image:22.595.90.498.641.720.2]22
[image:23.595.99.494.198.285.2]targets in event windows (-5, 5) and (0, 1) with CARs of 0.03% and 0.10% respectively. The former is significant at a 95% confidence level. However, corresponding acquiring companies earned negative CARs for all event windows (not statistically significant) when they were targeting publicly-listed firms. These findings are consistent with many previous studies conducted by Conn et al. (2005) and Wu et al. (2015). These studies also support the result that superior stock performance will appear in M&A with private targets. There are very interesting reasons behind this phenomenon. Extensive arguments have been made to explain the results such as the liquidity argument (Fuller et al., 2002), managerial motive argument (Draper and Paudyal, 2006) and the possibility of a reduced level of hubris in the case of bidding for private targets (Conn et al., 2005).
Table 7. Effects on CAR based on Different Forms of Target Event
Window
CAR (%) for Private Target
t-statistic CAR (%) for
Public Target
t-statistic
(-10, 10) -0.78201 -0.89173 -1.13948 -1.00212
(-5, 5) 0.03413 1.99023** -0.99210 -0.09324
(-1, 1) -0.28342 0.76736 -0.53721 -2.23844**
(0, 1) 0.10238 -1.23087 -0.02019 -0.35283
Notes: **p<0.05, *p<0.1.
[image:23.595.104.493.430.535.2]Table 8 shows the CAR for Chinese cross-border acquirers, based on the type of payment methods. Results show that cash M&A deals perform relatively better than non-cash deals. Cash deals had positive CARs in the event windows of (-5, 5), (-1, 1) and (0, 1) whereas only CAR in the (0, 1) event window is positive in the non-cash M&A events although all of them are not statistically significant. Theoretical arguments from other papers, including signalling hypothesis (Leland and Pyle, 1977), information asymmetry hypothesis (Myers and Majluf, 1984) and benefit of debt hypothesis (Peterson, 1991), attempt to demonstrate why cash deals can bring higher returns for acquirers as compared to non-cash deals. Moreover, the findings of the study are also in line with studies conducted earlier by Fuller and Glatzer (2003).
Table 8. Effects on CAR based on Different Payment Methods
Event Window CAR (%)
for
Cash Deals
t-statistic CAR (%) for
Non-Cash Deals
t-statistic
(-10, 10) -0.83142 -0.10028 -1.11259 -0.83958
(-5, 5) 0.01251 0.29837 -1.08376 -1.20186
(-1, 1) 0.14038 0.70937 -0.71948 -0.28191
(0, 1) 0.29105 1.44922 -0.58521 -1.39072
Notes: **p<0.05, *p<0.1.
[image:23.595.90.497.668.758.2]Next two tables examine and show the return to Chinese cross-border acquiring companies based on the absolute/relative transaction size. Based on the absolute deal size, Table 9 categorizes the whole sample into large deals and small/medium deals. It shows that bidders with large deals slightly underperform compared to the bidders acquiring small/medium targets. Both CARs in the event window of (0, 1) are statistically significant at 5% level and CAR for small/medium deals in (-1, 1) is significant at 10% level. Considering some of the Chinese acquiring firms are conglomerates, especially for the national ownership companies, influence stemming from transaction size relative to the company market capitalisation should be taken into consideration.
Table 9. Effects on CAR based on Absolute Transaction Size Event
Window
CAR (%) for Large Deals
t-statistic CAR (%) for
Small/Medium Deals
t-statistic
(-10, 10) -1.31294 -0.50849 -0.97871 -0.63961
(-5, 5) -0.88469 -0.41978 -0.49287 -0.43207
(-1, 1) 0.18495 -0.04118 0.44901 1.89153*
(0, 1) 0.40197 2.11409** 0.73280 2.08371**
23
[image:24.595.96.496.177.266.2]Based on the above review, Table 10 then shows this impact on the acquiring company’s performance. The results are almost identical to the ones based on absolute transaction size except that most of the figures are not statistically significant in the latter table. Uddin and Boateng (2014) suggest that enhanced reputation for management is associated with larger deals, so managerial problems are possibly more noticeable. Moreover, larger deals could act as a deterrent for the post-acquisition integration of participating firms. As a result, acquiring firms with small/medium deals will offer better returns to shareholders upon the event announcement.
Table 10. Effects on CAR based on Relative Transaction Size Event
Window
CAR (%) for Large Deals
t-statistic CAR (%) for
Small/Medium Deals
t-statistic
(-10, 10) -0.99821 -0.43958 -1.06564 -0.41718
(-5, 5) -1.23941 -0.82917 -1.31580 -0.88845
(-1, 1) 0.33504 -0.50293 0.56248 1.08637
(0, 1) 0.69317 1.52218 1.00294 0.74908
Notes: **p<0.05, *p<0.1.
Cross-Sectional Analysis
In addition to the univariate analysis, this study also employs a cross-sectional regression analysis to identify the joint impact of various independent variables on the short-term return of Chinese cross-border M&A acquiring companies. As noted before, the CAR in the event windows of (0, 1) and (-1, 1) have been selected as the dependent variables because only these two are positive among the four event windows. Five independent variables are used in this study. A basic econometric rule indicates that one variable should normally have 10 samples to do the OLS regression. This step is necessary to ensure the statistical significance of OLS regression. In the above-mentioned case, 44 samples only allow the regression to incorporate at most five variables. Thus, only five independent variables related to the deal characteristics are included in the cross-sectional analysis, which show industry relationship between acquirer and target (relative or non-relative target), forms of targets (private or public), payment method (cash or non-cash), absolute transaction size and relative transaction size (large or small/medium deals). The first three are dummy variables. The methodology section of this article provides a detailed description of these variables.
24
Table 11. Results of OLS Regression
Variables Model 1 CAR (-1, 1) Model 2 CAR (0, 1)
Constant -1.51413 (-2.20541)** -2.01541 (-2.33607)**
RELA 0.10854 (0.62184) 0.21384 (0.88416)
TARFORM 0.13824 (1.14084) 0.40141 (2.86214)**
PAYMETH 0.01445 (0.15491) 0.07384 (0.23284)
ABSIZE -0.21511 (-0.85471) -0.10149 (-0.44105)
RESIZE -0.38207 (-0.74154) -0.17480 (-0.08514)
R2 0.03454 0.05568
Adjusted R2 0.02141 0.04687
F value 1.52155 1.88524
D-W Statistic 2.12 2.14
Notes: Two-tailed tests, **p<0.05, *p<0.1. T-value is in parentheses. D-W = Durbin-Watson test.
Conclusion
Using a unique database of Chinese cross-border mergers and acquisitions into the UK, this study has examined the short-term share price performance of Chinese acquiring companies during the period from 2012 to July 2016.
Although a large body of literature has studied and reviewed cross-border M&A activities between developed countries, the existing research on this topic still does not sufficiently focus on developing countries. Because during recent years, international M&A investments among which China are playing a increasing role in the FDIs in the global world, this analysis of Chinese investment into the UK is very timely and interesting.
The first part of this paper focused on the analysis of Chinese cross-border M&A investments into the UK. Analysis revealed that in the examination period, deal volume hits a record high in 2016 Q2 with 16 deals being announced which shows a strong trend even immediately post Brexit but this will need to be tracked as more recent data seen after this study shows deal volume may have started to decline since August 2016. 2015 Q3 ranked second in terms of deal volume with 11 transactions were made in that quarter. The aggregated deal value was at a peak in 2015 Q1 but the final quarter of the study (2016 Q2) also performed very well with more than $2.4 billion. Accounting for more than half of deal value, British companies belonging to consumer and real estate sectors are the most popular targets for cross-border acquiring firms from China during the study period. It is important to emphasize that Chinese investors were beginning to pay more attention to UK healthcare companies and they spent less on the utility and oil & gas sectors over the above-mentioned period.
The second part of the event study assesses the abnormal returns and cumulative abnormal returns earned by acquiring firms. Based on the review of previous literature and the performance of cross-border M&A activities, this paper has calculated the abnormal return earned by Chinese acquirers. This abnormal return depends on several deal-specific characteristics including industry relatedness between the bidder and target, payment methods, target forms and transaction size. The results show that Chinese acquiring firms gained significant positive abnormal returns on the day following the event announcement and the positive returns disappeared as the event day passed. When looking deeper at the specific industry sectors, it is evident the majority of the positive abnormal returns come from the real estate and other sectors. (oil & gas, consumer, industrial, technology and utilities). The financial sector on the contrary shows a disappointing negative abnormal return for the acquiring firms. According to the statistical test results, the study confirms that the target form and the absolute transaction size do have an effect on short-run performance of acquiring firms. Both univariate and cross-sectional analysis support the statistically significant impact of the target form on the abnormal returns.
25
demonstrates that the market positively evaluates the UK M&A activities by Chinese firms to obtain, for example, well-knowns brands, technologies and network channels.
Limitations and Recommendations for Future Research
The following are a few limitations that could bias the power and reliability of this research paper. The first limitation is that this paper is studying only the Chinese cross-border M&A activities into the UK, which limits the geographical location. Thus, the data is restricted to China-UK deals rather than focusing on data on a global scale. In fact, North America and Continental Europe are also popular destinations for Chinese cross-border M&A investments. Therefore, in order to achieve a broader and deeper understanding of Chinese cross-border M&A value creation, studies need to be conducted in the future to collect global data via well-known and trusted sources for other markets as well.
The second limitation is that the database used in this study provides data from 2012 to July 2016, which is a very short time period for conducting this research. Data prior to 2012 is unavailable in this study’s data vendor company. This is explained by the fact that China into the UK M&A activities had not formed a main trend until 2012 so it would be more representative to collect and clear data from 2012. The number of data samples for empirical research were therefore restricted. To achieve more robust and accurate results, and to get greater statistical significance, further studies could extend the data timeline and thus the number of deals being analysed. This may also allow for greater segmentation of the analysis to identify other factors that drive the success of this deal activity.
The third limitation is that the present work is based on event study methodology to measure the abnormal returns in a short-term twenty-one-day event window. However, M&A activities are considered as significant events for any company and the effects of those events prevail for a relatively longer time (Uddin and Boateng, 2014). Stock prices may often be distorted by other factors, especially in China where the market is demonstrably more volatile than many other stock markets and may not be as consistently and strongly regulated. Moreover, the change of stock price does not directly reflect the impact of M&A activities on cost, revenue, profit and cash flows (Sudarsanam, 2010). As a result, longer-term operating performance should also be examined to judge the overall success of M&A decisions. This method would also enable analysis of synergy achievement. Hence, future research could try to bridge this gap in order to gain a whole picture of the success of Chinese cross-border M&A activities into the UK.
Another restriction was that the research only examined the performance of Chinese public acquirers and it ignored the private companies. Based on this research, more than 40% of Chinese acquiring companies are privately owned which are also active in cross-border merger and acquisitions into the UK. Private equity companies are an example in this regard. Consequently, it is important to find a way to measure the performance of private acquiring firms for long and short-term, although there is as of yet no established and generally accepted methodology to do this.