City, University of London Institutional Repository
Citation
:
Broom, M., Rychtar, J. and Stadler, B. (2009). Evolutionary Dynamics on
Small-Order Graphs. Journal of Interdisciplinary Mathematics, 12, pp. 129-140.
This is the unspecified version of the paper.
This version of the publication may differ from the final published
version.
Permanent repository link: http://openaccess.city.ac.uk/977/
Link to published version
:
Copyright and reuse:
City Research Online aims to make research
outputs of City, University of London available to a wider audience.
Copyright and Moral Rights remain with the author(s) and/or copyright
holders. URLs from City Research Online may be freely distributed and
linked to.
City Research Online:
http://openaccess.city.ac.uk/
[email protected]
M. BROOM, J. RYCHT ´A ˇR, AND B. STADLER
Abstract. We study the stochastic birth-death model for structured finite populations popularized by Lieberman et al. [Lieberman, E., Hauert, C., Nowak, M.A., 2005. Evolutionary dynamics on graphs. Nature 433, 312-316]. We consider all possible connected undirected graphs of orders three through eight. For each graph, using the Monte Carlo Markov Chain simulations, we determine the fixation probability of a mutant introduced at every possible vertex. We show that the fixation probability depends on the vertex and on the graph. A randomly placed mutant has the highest chances of fixation in a star graph, closely followed by star-like graphs. The fixation probability was lowest for regular and almost regular graphs. We also find that within a fixed graph, the fixation probability of a mutant has a negative correlation with the degree of the starting vertex.
1. Introduction
Evolutionary dynamics has been traditionally studied in infinite homogenous [13] or infinite spatial [6] populations. Recently, the dynamics was extended to finite populations and studied in [21]. The dynamics in finite and spatially structured populations (i.e. graphs) was popularized in [10], see also [7, 16]; other important work on this subject can be found in [8, 17, 2].
The present study tries to find answers to the following questions.
1) What is the chance that a mutant (information, computer virus, or disease) spreads through the graph and reaches every vertex (in other words, fixates in the graph)?
2) Are certain graphs significantly better (increase fixation probability) or worse (decrease fixation probability) than others?
3) Within one graph, how does the chance of fixation depend on the starting position of a mutant?
For regular graphs (a graph is regular if all of its vertices have the same degree), [10] provided answers to questions one and three. First of all, they implicitly showed that, in regular graphs, the chances of fixation does not depend on the starting position of a mutant. Second, they calculated that the fixation probability for a mutant in a regular graph with N vertices is given by
(1) 1−1/r
1−1/rN.
They also found that certain directed graphs (namely superstars) significantly in-crease the fixation probability and that directed linear graphs significantly dein-crease
Key words and phrases. evolutionary dynamics, fixation probability, heterogeneous graphs, star graphs.
2 M. BROOM, J. RYCHT ´A ˇR, AND B. STADLER
the fixation probability of advantageous mutants. They also introduced a notion of a selection amplifier. A graph is said to have anamplification factor kif an average fixation probability of a mutant in that graph is given by
(2) 1−1/r
k
1−1/rkN.
In other words, the graph with amplification factorkamplifies the fitness advantage of a mutant fromrtork.
One of the major drawbacks of [10] is that many naturally occurring graphs are not regular. Therefore, in [19] we have studied the dynamics on small-world networks. A small-world network is a random graph where most vertices are not neighbors to each other, yet the majority of vertices can be reached from any other vertex in a relatively short path through the graph, [23]. Social networks, the Internet and national power grids all exhibit the characteristics of small-world networks, [22, 23].
For any graph with a vertex of degree at least three (i.e. any graph that is not a line or a circle), the rules of the evolutionary dynamics introduced in section 2 lead to the system (4) that has of the order 2N linear equations; the number 2N
can be reduced by considering inner symmetries of the graph (see [4] for details), yet in most cases the reduction is not significant. Consequently, the only attempts for analytical solutions of the system (4) are in [10] (for regular graphs), [5] (for
r≈1, r≈0, r≈ ∞), and [4] (for linear graphs and star graphs). In [1] the authors provide an analytical method of approximation of the solution and they also show that the fixation probability of a mutant that starts at a vertex of degree k is proportional to 1/k(the later result is improved in [5]).
In this paper we retreat to numerical simulations of the dynamics by the Monte Carlo Markov Chain method. Since the small-world networks are typically large graphs and simulations of the dynamics on such graphs would take too long, for this paper we restricted ourselves to small graphs of orders three to eight. We find that the fixation probability of randomly placed advantageous mutants is maximal in star and star-like graphs (a star is a graph where all vertices but one have degree of one and are attached to one central vertex, see Figure 1). The fixation probability of randomly placed mutants in any graph is at least as high as given by formula (1) for regular graphs. We found that any heterogeneity in the graph generally increases the chances of advantageous mutants. We also confirm the result from [1] and [5] that it is best for a mutant to start at the vertex with the least possible number of neighbors. Moreover, we demonstrate that the notion of the amplification factor introduced in [10] may not be the right notion for a graph since it changes not only with the graph but also with the mutant fitnessr.
2. Evolutionary dynamics on graphs
LetG= (V, E) be an undirected graph,V be the set of vertices andE the set of edges. We assume all graphs are simple, i.e. no vertex is connected to itself and there are no parallel edges. The dynamics introduced in [10] is a discrete-time Markov chain. At the beginning, a vertex is chosen and replaced by a mutant with fitnessr, all remaining vertices having fitness 1. At every next step, the population is updated based on the following rules.
b) a neighbor of the base vertex is selected at random
c) the base vertex places its offspring into the selected neighboring vertex. Letfi denote the fitness of an individuali∈V;fi∈ {1, r}, wherefi=rmeans
that the individual is a mutant. An individual atiis selected for reproduction with probability
(3) si =
fi
P
v∈V fv
.
The graph structure is represented by a matrix W = (wij), where wij is the
probability of replacing a vertex j by a copy of a vertexi, provided vertexi was selected for reproduction,
wij =
(1
ei, ifiandj are connected,
0, otherwise,
whereei is the number of edges incident to the vertexi.
LetPCdenote the probability of mutant fixation given mutants currently inhabit
a setC⊂V. The rules of the dynamics yield (see [10]),
(4) PC =
X
i∈C
X
j6∈C
rwijPC∪{j}+wjiPC\{i}
X
i∈C
X
j6∈C
rwij+wji
withP∅= 0 andPV = 1.
For any graph that is not a line or a circle the system (4) has of the order of 2|V|
linear equations, [4]. It was also shown in [4] that, after considering the symmetries, the system (4) consists of|V| (for a circle), 2|V|+ 1 (for a star) and|V|2/4 (for a
line) equations.
3. Methods
3.1. Graph creation. We considered all undirected connected graphs of orders three through eight. The graphs were created using a program calledgengobtained from [12]. This program allowed us to create all possible non-isomorphic graphs of a given order. For each order, graph representations were stored in the graph6 format, an ASCII style format explained in [11].
We have verified that we generated all possible graphs by checking the graph counts. The numbers of all undirected connected graphs of a given order was found in [3, 18, 20], see Table 1.
3.2. Algorithm for evolutionary dynamics and its implementation. Here we describe the algorithm we used to simulate the evolutionary dynamics as well as the implementation of it. It is a modification of what was used in [19]. The input of the algorithm is a graphG= (V, E), a starting vertexv∈V, and a mutant fitness valuer. One run of the simulation is described as follows:
place a mutant with a fitnessr into the vertexv∈V while (not (graph fully mutated or without mutants))do
select (abasevertex for reproduction)
find (all neighboring vertices ofbasevertex)
4 M. BROOM, J. RYCHT ´A ˇR, AND B. STADLER
order number of graphs
3 2
4 6
[image:5.612.246.365.114.235.2]5 21 6 112 7 853 8 11,117 9 261,080 10 11,716,571 11 1,006,700,565
Table 1. The number of connected undirected graphs of a given order, [3, 18, 20].
replace (neighboringvertex by offspring ofbasevertex)
end
C++ was chosen as the language to handle the simulation. It was primarily chosen due to available C++ libraries from http://www.boost.org. Below are the specific libraries used in development of the program:
• Boost graph libraries,
• the read graphviz function was used to construct a graph based on an input from the file in the AT&T Graphviz format,
• Boost random libraries - the mt19937 Mersenne twister generator was used for all random number generation. The Boost non-deterministic random generator was used to seed the mt19937 generator. Note, this non-deterministic generator only works on Linux and Unix like machines.
The graph6 format created by programgeng was incompatible with the AT&T Graphviz format needed by our C++ program. We thus used NetworkX, a Python package designed for the study of and creation of graphs, to convert the graph6 format to the Graphviz format. As the Python script converted and created an individual Graphviz file for each graph, it also created and numbered a graphical representation of each graph using the matplotlib Python libraries, available at http://matplotlib.sourceforge.net.
3.3. Tests in numbers. For each graph and each vertex of the graph, we tested five different mutant fitness values, r∈ {1,1.1,1.5,2,10}. We tested fitnessr = 1 because for this fitness value theoretical results were known from [5] and we wanted to make sure our simulation ran correctly. In total, for all graphs of orders 3 through 8, there were 95,714 vertices tested. Overall there were 478,570 tests performed. Each test consisted of 105runs of our main simulation. At the end of each such run,
the graph either was fully mutated or there were no mutants at all. We counted how many times the graph mutated and it yielded the fixation probability of a mutant of a given fitnessr introduced into a specific vertexv of a given graphG.
We have chosen to run the simulation 105times after we have performed several
pilot simulations with 106 runs and determined that after 105 the estimate for
fixation probability changed by less than 10−3. As a matter of fact, since we have
any r (from [4]) we compared randomly selected results of our simulations with the theoretical results and concluded that simulation results were accurate with an error smaller than 1.5·10−3.
For each order, we ran the simulations three times and thus produced three sets of data to minimize any possible error and also to account for any natural drift in the pseudo-random number generator.
3.4. Analysis of results. We have worked with graphs of different orders sep-arately. For every graph, and for each vertex of the graph and each value r ∈ {1,1.1,1.5,2,10}, the simulations provided the fixation probability of a mutant with fitness r introduced to the graph at that specific vertex. We compared the resulting independent three sets of data between each other and for the majority they matched accurately. There were about 10 cases with a difference of 2·10−3
or higher between the value in one data set and values in the remaining two data sets. In those cases we disregarded the outlier and went with the number provided by the other two sets.
We performed two distinct operations with the data. First, for a fixed graph and fixed r, we have sorted the vertices by the fixation probability. We have tracked whether this sorted ordering depended onrand we also checked which vertices in any possible graph of a given order yielded the best chances for a mutant. Sec-ond, for a fixed graph and r we calculated averages over the vertices to get a fixation probability of a mutant introduced randomly into the graph. For fixed
r∈ {1.1,1.5,2,10}we then sorted all the graphs by the fixation probability and we have also tracked whether this sorted ordering depended onror not.
We sometimes had to neglect differences of 10−3since those were likely caused by
an error in our estimates. For example, if in all but one comparison a graphG1was
better (significantly, i.e. by more than 10−3) than graphG
2 and in the remaining
comparison the difference was negligible (smaller than 10−3) we still counted that
asG1 is better thanG2.
4. Results
4.1. Starting position has a significant impact on the fixation probability.
Across all graphs and regardless of the value of r(in particular even forr= 1, i.e. a non-advantageous mutant), the larger the difference between the average degree (2|E|/|V|) of a vertex in a graph and the actual degree of the starting vertex, the higher the fixation probability of a mutant introduced into that vertex. This confirms the results from [1, 5] that in heterogeneous graphs (graphs which have vertices of different degrees) the vertices with smaller degrees are better starting positions for mutants. Overall, the best vertices to start at are vertices of degree one, such that their removal would result in a complete or almost complete graph. Interestingly enough the absolute winner, i.e. the vertex where the chances of a mutant are the highest out of any vertex in any graph of the given order, was in the graph that overall did not increase the advantage of mutants too much (see Figure 2 e). Also, the higher the graph order, the better the chances of a mutant in this “best vertex”.
6 M. BROOM, J. RYCHT ´A ˇR, AND B. STADLER
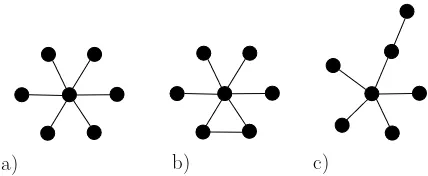
[image:7.612.198.412.117.205.2]a) b) c)
Figure 1. Best selection amplifiers. Graphs of order 7 are shown, yet the results were consistent for all orders 4 through 8. a) the star is best for any value of r; b) the star with an extra edge is second best for larger and third best forraround 1; c) the star with a tail is second best forraround 1 and third best for larger.
and a star with a tail (see Figure 1 b and c). A star with a tail was the better of the two forr≈1, and a star with an extra edge was better for larger. This happened consistently across the graphs of various orders and we thus conclude that the star with an extra edge is the better selection amplifier for largerwhile the star with a tail is a better amplifier for smallerr. In particular, the notion of the amplification factor of a graph as defined in [10] is not a property of a graph itself but ofr as well.
Also, the fixation probability of a randomly placed mutant in any graph is at least as high as given by formula (1) for regular graphs. Consequently, the regular graphs are the graphs that support the mutants the least. The regular graphs were closely followed by graphs that were almost regular (an addition of a few edges would make the graphs regular). In fact, in most cases there was not a significant (larger than 10−3) difference between fixation probabilities in regular and almost
regular graphs.
We also noticed that, overall, the trees (graphs with no cycles) scored very well with many trees being represented in the top 20 of the best selection amplifiers. The line (in fact, an almost regular graph that just needs one edge to become a regular circle) scored worst from the trees, yet still in top 25% of the graphs.
4.3. Heterogeneity amplifies selection. The star is a graph with almost the largest variation of the vertex degree, defined as
var degG:=
1
|V| X
v∈V
degG(v),
where degG(v) is a degree of the vertexv. The star has the largest variation for
graphs with degree 6 and less. As the degree increases, there are more and more graphs with larger variation (one such graph at degree 7, three graphs at degree 8, at least 30 at degree 9). Nevertheless, the variance of a star always belonged to one of the highest.
c) b)
[image:8.612.165.452.121.192.2]a) d) e)
Figure 2. Graphs with relatively low variance yet good selection amplifiers (a, b, and c) and graphs with relatively high variance yet bad selection amplifiers (d and e). a) variance 1.9, ranked second and third, b) variance 1.34, ranked 6th, c) variance 0.776, ranked around 18th place, d) variance 2.81, ranked around 136th place, e) variance 2.2, ranked around 500th. (there are 835 graphs of order 7).
there were graphs with relatively high variance that ranked poorly (see Figure 2 d, e). Note that the regular or almost regular graphs have variance 0 or almost 0.
5. Summary and discussion
We have studied the evolutionary dynamics on all graphs of order 8 and smaller. We found that the the star graph is a graph where randomly placed mutants have the highest chances of fixation, and regular graphs are the graphs where mutants have the lowest chances. The graphs that were almost regular (i.e. an addition of one or two edges would make them regular) yielded fixation probabilities only negligibly higher than regular graphs. Also, we demonstrated that the heterogeneity of the graph (i.e. the variance of the degree of a vertex) has a strong positive correlation with the fixation probability. In heterogeneous graphs, the fixation probability for a mutant was higher if it was placed in a vertex with smaller degree. Further work has to be done in order to understand what graph characteristics influence the fixation probability and how this influence can be estimated. Also, the question of which graph is best for mutants remains unanswered. We demonstrated that the star is best for small order graphs. However, it does not mean that it is best for graphs of any degree (for directed graphs, superstars - structures that need about 30 or more vertices to be really effective - are even better than stars, see [10]). Due to the unmanageable amount of graphs of order 20 or higher, the exhaustive search we did for small orders cannot be repeated. Thus, new methods are needed to solve this problem.
Since the heterogeneity of the graph measured by the variation in the vertex degrees can explain some but not all results, we are also working on measures of irregularity that would quantify how far a given graph is from being regular. One such a measure is the number of edges that would have to be added to the graph so that the resulting graph is regular. We hope that this and similar measures can provide deeper insight into the dynamics.
References
8 M. BROOM, J. RYCHT ´A ˇR, AND B. STADLER
[2] Barabasi A, Albert R (1999) Emergence of scaling in random networks. Science 286: 509–512
[3] Briggs K (2007) Combinatorial Graph Theory. September 12, 2007, http://keithbriggs.info/cgt.html
[4] Broom M, Rycht´aˇr J (2008)An analysis of the fixation probability of a mutant on special classes of non-direction graphs. Preprint
[5] Broom M, Rycht´aˇr J, Stadler B (2008). In preparation.
[6] Durrett R, Levin S (1994) The importance of being discrete (and spatial). Teor. Pop. Biol. 46 (3): 363–394
[7] Ebel H, Bornholdt S (2002) Coevolutionary games on networks. Phys. Rev. E 66 (5): Art. No. 056118.
[8] Erd¨os P, Renyi A (1960)On the evolution of random graphs.Publ. Math. Inst. Hungarian Acad. Sci 5: 17–61
[9] Hagberg A, Schult D, Swart P (2007)API Documentation, Module Cluster, NetworkX. August 4, 2007, https://networkx.lanl.gov/reference/networkx/toc-networkx.cluster-module.html
[10] Lieberman E, Hauert C, Nowak MA (2005)Evolutionary Dynamics on Graphs. Nature 433: 312–316
[11] McKay B (2007) graph6 and sparse6 graph formats. Computer Sci-ence Department, Australian National University, September 12 2007, http://cs.anu.edu.au/people/bdm/data/formats.html
[12] McKay B (2007)nauty. Computer Science Department, Australian National University, September 12 2007, http://cs.anu.edu.au/ bdm/nauty/
[13] Metz JAJ, Geritz SAH, Meszena G, Jacobs FJA, van Heerwaarden JS (1995)Adaptive dynamics, a geometrical study of the consequences of nearly faithful reproduction. Sto-chastic and spatial structures of dynamical systems (Amsterdam), 183–231, In Konink. Nederl. Akad. Wetensch. Verh. Afd. Natuurk. Eerste Reeks, 45, North-Holland, Amster-dam, 1996
[14] Moran PAP (1958)Random processes in genetics.Proc. Camb. Phil. Soc. 54: 60–71 [15] Nowak MA (2006) Evolutionary Dynamics: Exploring the equations of life. Harvard
University Press
[16] Ohtsuki H, Lieberman E, Hauert C, Nowak MA (2006)A simple rule for the evolution of cooperation on graphs and social networks. Nature 441: 502–505
[17] Nagylaki T, Lucier B (1980)Numerical analysis of random drift in a cline.Genetics 94: 497–517
[18] Royle G (2007) Small Graphs. Computer Science and Software En-gineering, The University of Western Australia. September 12, 2007, http://people.csse.uwa.edu.au/gordon/remote/graphs/index.html
[19] Rycht´aˇr J, Stadler B (2008)Evolutionary Dynamics on Small-World Networks. Interna-tional Journal of Mathematics Sciences 2(1): 1–4
[20] Sloane NJA (2007) The On-Line Encyclopedia of Integer Sequences, AT&T Labs Re-search, Sep 12 2007, http://www.research.att.com/ njas/sequences/A001349
[21] Taylor C, Fudenberg D, Sasaki A, Nowak MA (2004) Evolutionary game dynamics in finite populations. Bull. Math. Biol. 66 (6): 1621–1644
[22] Watts DJ (1999)Small Worlds. Princeton University Press
[23] Watts DJ, Strogatz SH (1998)Collective dynamics of ‘small world’ networks. Nature 393: 440–442
M. Broom: Department of Mathematics, University of Sussex, Brighton BN1 9RF, UK
E-mail address: [email protected]
J. Rycht´aˇr: Department of Mathematics and Statistics, University of North Car-olina at Greensboro Greensboro, NC 27402, USA
E-mail address: [email protected]
B. Stadler: Department of Computer Science, University of North Carolina at Greensboro Greensboro, NC 27402, USA
![Table 1. The number of connected undirected graphs of a givenorder, [3, 18, 20].](https://thumb-us.123doks.com/thumbv2/123dok_us/1617542.114796/5.612.246.365.114.235/table-number-connected-undirected-graphs-givenorder.webp)