Rochester Institute of Technology
RIT Scholar Works
Theses Thesis/Dissertation Collections
2-2-2011
Network Based Malware Defense
Thomas TuftsFollow this and additional works at:http://scholarworks.rit.edu/theses
This Thesis is brought to you for free and open access by the Thesis/Dissertation Collections at RIT Scholar Works. It has been accepted for inclusion in Theses by an authorized administrator of RIT Scholar Works. For more information, please [email protected].
Recommended Citation
Network Based Malware Defense
By
Thomas Tufts
Project submitted in partial fulfillment of the requirements for the
degree of Master of Science in Information Technology.
Rochester Institute of Technology
B. Thomas Golisano College of
Computing and Information Sciences
Rochester Institute of Technology
B. Thomas Golisano College
of
Computing and Information Sciences
Master of Science in Computer Security
and Information Assurance
Project Approval Form
Student Name:
Thomas Tufts
Project Title:
Network Based Malware Defense
Project Committee
Name
Signature
Date
Chair
Committee Member
Copyright 2011 Thomas Tufts
Table of Contents
1. Abstract ... 5
2. Introduction ... 5
3. Related Work ... 6
4. Wild worm vs. Test worm ... 8
5. Test worm ... 9
6. Quarantine System ... 12
6.1. Quarantine System Introduction ... 12
6.2. Nessus Scanner ... 13
6.3. Snort Monitor ... 15
6.4. Network Control ... 17
6.5. Command Center ... 19
7. Testing Methodology ... 20
7.1. Testing Introduction ... 20
7.2. Test Network ... 20
7.3. Testing and Simulations ... 21
7.4. Data Collection and Parsing ... 22
8. Simulation Results ... 23
8.2. No Protection ... 24
8.3. Nessus Only ... 28
8.4. Snort Only ... 32
8.5. Full System ... 36
9. Population Growth Results ... 40
10. Simulation Analysis ... 43
11. Population Growth Analysis ... 47
12. Quarantine System Performance ... 47
13. Future Research ... 48
14. Bibliography ... 49
15. Appendix A – commandcenter.py ... 51
16. Appendix B – nessusscan.py ... 52
17. Appendix C – netcontrol.py ... 57
18. Appendix D – snortmonitor.py ... 62
19. Appendix E – testing.py ... 64
20. Appendix F – resetallvms.bat ... 65
1.
Abstract
1.1. This goal of this research was to create a network-based malware quarantine system and test the effectiveness of it on the speed of worm propagation across a virtual network. Worms that spread in epidemic ways cause a large amount of financial and digital damage to the average Internet user while posing threats to the infrastructure of the Internet. This impact on consumers and the Internet as a whole can be significantly reduced through the implementation of a quarantine system at the network level. The quarantine system tested combined a network based vulnerability scanner, a Network Intrusion Detection System (NIDS), and a custom written control system to detect malware behavior on a network, and segregate those potentially compromised hosts from other hosts, with the intention of slowing the propagation of a network worm. A virtual test environment was used to track the propagation of a custom written worm as it spread to virtualized test machines. Before each test, the network was cleared of malware and the speed of propagation was documented. This data was analyzed to determine the most effective configuration that will still maintain network usability. After testing four variants of the custom worm with four different variations on the quarantine system configuration the spread data and quarantine system logs were analyzed to determine that the quarantine was in fact very effective against the spread and was able to slow or stop it in almost all simulations.
2.
Introduction
2.1. Computer virus and worm outbreaks can spread across the Internet at an epidemic rate. (Lelarge & Bolot, 2008) These outbreaks can cause severe damage to civilian networks and can pose great threats to Internet infrastructures and servers. The largest recent worm outbreak was the Conficker botnet. As of August 15, 2010, this botnet is estimated to command over 4.9 million unique IP addresses. (Conficker Working Group, 2010) According to the FBI, “Because of their widely distributed capabilities, botnets are a growing threat to national security, the national information infrastructure, and the economy.” (FBI National Press Office, 2007) Due to their widespread propagation and the huge amount of traffic that they can generate; Internet worms pose a significant threat to the infrastructure of the Internet as a whole. This deluge of traffic can cause Distributed Denial of Service (DDoS) conditions, which severely degrade network availability in affected areas. (Joukov & Chiueh)
2.3. The impact of viruses and malware on consumers may be significantly reduced through the implementation of a quarantine system placed on the network. This research will test such a quarantine system by measuring its effectiveness at slowing the spread of a virus across a model consumer network. This system will conduct a scheduled scan of the test network searching for known vulnerabilities while monitoring traffic on the network for malware related scans and other suspicious traffic.
2.4. While it is common for protection to be placed on managed network to protect corporate environments, unmanaged networks tend to go unprotected. This research is significant in that it will create an effective malware countermeasure that is usable on both managed and unmanaged networks. This is valuable research because of the threat of viruses to end users and the infrastructure and economy of the Internet.
3.
Related Work
3.1. Over time, as the Internet has grown, the sophistication of network attacks has grown. Viruses and worms have been developed that have much more advanced methods of communication and propagation. Attack tools have become increasingly automated and are allowing a much faster exploitation of vulnerabilities than before. The amount of time available for a vulnerability to be patched is shrinking due to the faster transition from vulnerability discovery
to effective malicious exploit. One of the fundamental protection devices used is the firewall. Due to development of new technologies, firewalls are becoming more-and-more easy to penetrate. All in all, the threats to computers are growing at a very fast rate and the general knowledge of users to protect themselves is being outpaced. The economic impact of some worms is in the range of billions of dollars. (Householder, Houle, & Dougherty, 2002)
3.2. Heien, Massengale and Wu developed a test-bed network to study the way that the network is affected by malware infestation. The proposed network allows the team to “’poke and prod’ malicious software to gather data.” This data can later be used to predict worm behavior and develop better defenses. The network was developed to take advantage of the sandboxing method used by virtualization. Each host has two virtual machines on it that share its resources and network card. Various testing tools are used to monitor the network and gather data. (Heien, Massengale, & Wu, 2008)
3.3. The propagation of worms on the Internet can be described epidemically. This means that while an unprotected computer can be infected and suffer the personal effects of the infection, it can now become a launch-bed to further spread the infection. Because of this epidemic propagation of malware, research into limiting this spread is beneficial to all users of the Internet. (Lelarge & Bolot, 2008)
3.4. There are two commonly used models for predicting epidemic population growth. The first model is the SI-model breaks the population into two groups: Susceptible and Infected. As an infection spreads through the groups it follows
the pattern described by the derivative in Figure 3.1
This describes a curve that is approximately exponential at the start, and as the infection saturates the population the “Infected” curve slows and mirrors the start in reverse. The inverse of this curve is representative of the “Susceptible” population. The second common model used for epidemic spread is the SIR-model. It breaks the population into three groups by adding a Removed group. This is allows for recovered individuals that are no longer susceptible, and deceased individuals. The formula for this model is significantly more complicated, as shown in Figure 3.2.
As the infected population grows to its peak, (Figure 3.3) the removed population begins to expand, and the infected and susceptible population decreases proportionally.
This paper describes these models and how they relate to the spread of computer worms over the
Internet. They expand these formulas to include human protection measures and slower infection rates due to network traffic. The following graph shows their prediction of worm population growth, epidemically, to include these two additional factors. (Misslinger)
3.5. The fast propagation of Internet worms poses a serious threat to
the infrastructure of the
Internet as a whole. As worms spread over networks, the traffic generated can have a distributed denial of service effect on the network. This effect can cause large portions of the Internet to go down. Because the spread is so fast there is no way that manual responses by humans can have any retarding effect on their spread. The research conducted
by (Joukov & Chiueh) graphed the spread of nine well-known and widespread Internet worms. They also discuss some detection methods and mitigation techniques to slow the spread of worms.(Joukov & Chiueh)
3.6. The RIT Information Security Office (ISO) manages a vulnerability scanner and quarantine system that periodically scans the RIT campus for known vulnerabilities and will quarantine the affected computer. Machines that are quarantined are placed on a restricted network and are allowed to access remediation services. The Network Standard policy published by the ISO briefly outlines the capabilities of the network scanner. (Rochester Institute of
Figure 3.2
Technology Information Security Office, 2009)
4.
Wild worm vs. Test worm
4.1. In order to measure the effectiveness of the quarantining system, a worm was needed to infect the test network. Initially, the plan was to use a “wild” worm to test the network, meaning a worm found spreading on the Internet. However, after research of these “wild” worms, creation of a test worm was found favorable on several accounts. By writing a new worm, tracking, targeting, and predictability were more controlled; this also led to a solid set of characteristics that would be necessary when writing the custom worm.
4.2. Rather than relying on an outside program such as a virus scanner or tracking script, a custom test worm could incorporate tracking into itself. To collect data some sort of sensor or trigger would need to be in place to log which computers were infected and when. For a wild worm, the sensor would have been a series of scripts to monitor the system looking for worm activity. Although scripts would be advantageous over using a standard virus scanner, incorporating tracking into the worm was more effective as it didn’t rely on an outside script at all. Also this made administration easier by eliminating the need to manage the set of scripts on each host.
4.3. A problem with using wild worms is that they often spread using a random IP generator. Because the test network was only a very small portion of the IPv4 address space, it would be very difficult to get the worms to spread to other test hosts. A custom worm could intentionally target the test network, rather than finding ways for the network to trick the worm into propagating. Some ideas that were considered for making wild worms propagate were to write a custom router that repackaged traffic directed outside the virtual network and instead forwarded it back in. When the worm targeted an outside host, the attack would be redirected at an internal host. Another possibility would be to reverse engineer and attempt to alter the functionality of the wild worm and force it to spread on the test network only. These possibilities were unnecessarily complicated and it became clear that while wild worms may be possible, they were not feasible. Creating a worm custom written for these simulations made the simulations much more efficient and effective as well as giving more opportunities for variations in testing.
4.4. A custom worm is much more predictable and easy to control. Wild worms tend to make analysis and reverse engineering as difficult as possible. They often employ encryption techniques and debugging/virtualization detection to prevent researchers from learning how they work. This makes them less than ideal for this research. Also, because the goal of this system is not to learn how the worms work, but rather, to test the effect on propagation of the quarantine system, it is unnecessary to deal with the unpredictability of wild worms. A custom test worm’s propagation techniques could be intentionally manipulated to fully test the quarantine system and its behavior would be completely predictable.
having self-propagation capabilities. To improve data collection and the ability to track the worm’s spread, it had to log each new exploitation and infection. To avoid unnecessary complication it had to be predictable and controllable. Finally, it had to target hosts only within the test network and be unable to spread outside.
5.
Test worm
5.1. Test.X is the custom worm written for the purposes of testing the quarantine system described in this paper. It has a structure comprised of six parts: Reporting, infection, target selection, scanning, exploitation and code transfer. It propagates by gaining Local System level privileges by exploiting the Distributed Component Object Model (DCOM) vulnerability addressed in MS03-026. The DCOM interface is made network accessible through the Remote Procedure Call (RPC) protocol, allowing remote attackers to gain control without physical access. The code was written in Visual C++ using Visual Studio 6.0. The entire worm is only 534 lines of code and comprises one 197KB Windows Portable Executable (PE). Four variations of Test were created; two target selection variations and two multithreaded variations. These will be referred to as Test.NTL (Non-Threaded Linear), Test.NTR (Non-Threaded Random), Test.TL (Threaded Linear) and Test.TR (Threaded Random).
5.2. Reporting messages are sent for two events during the lifecycle of Test. This is helpful when running propagation simulations by sending fine-grained propagation logs to the configured syslog server. Before Test.X is compiled, the syslog server’s IP address is defined explicitly throughout the code. The Report and ReportExploit functions send installation and exploitation messages respectively.
5.3. When Test.X runs, whether initially upon infection or after a system reboot, it will check the Installed() function, which returns true or false depending on the presence of the C:\Windows\system32\worm.exe file. If the worm is not installed it copies itself to that location. Finally, Test.X also adds a registry key to HKEY Local Machine\Software\Microsoft\Windows\CurrentVersion\Run, causing the worm to rerun on system startup.
5.5. Once a new target has been selected, the worm attempts to connect to that IP on the RPC DCOM port 135. If a connection cannot be made the worm begins the target selection process once again. This allows the worm to randomly scan for vulnerable systems on the network. The method for network scanning is single-threaded. While this method is rather slow, it simplifies the propagation timeline while still maintaining a realistic epidemic spread.
5.6. On vulnerable target systems, the RPC DCOM interface is exploited using a buffer overflow to execute remote code. A malformed packet is sent via port 135 with an overrun in the server name field. For the Test.X exploit, the value passed as the server name contains a memory location to jump program execution to a NOP sled and then to shellcode that calls system() with a given command. The Metasploit Framework is a penetration-testing framework that is freely available on the Internet. It includes tools for network scanning, shellcode generation and exploitation. This framework was used to generate shellcode which was
embedded into Test.X’s exploit. This shellcode can execute any given command on the remote system. The command parameter must be generated on the fly to ensure that the shellcode calls back to the attacking system at its IP address, which is of course different for each attacker. The command that is run is cmd /c tftp –i <attacker_ip> get bot.exe && bot.exe (Shown in Figure 1.1).
5.7. This command will use the built-in Windows XP Trivial File Transfer Protocol (TFTP) client to call back to the attacking system on port 69, attempt to retrieve a file, which it will save as bot.exe, and then it will run bot.exe.
5.8. The exploit used in Test.X is based on the exploit published by Last Stage of Delirium (LSD) research group in July 2003. Further changes to the exploit have been published throughout the Internet as Windows has been updated since then. Different versions of Windows and different service packs use different memory addresses in the buffer overflow. For the purpose of this research Test.X targeted only Windows XP SP1. This simplified the development of Test.X and as the targeted operating system is irrelevant, it was one less factor to consider. The overrun of RPC DCOM initiates a system crash with a 60 second timer. This gives the worm enough time to transfer and install itself before the system reboots.
5.9. The RPC DCOM vulnerability was chosen for three reasons. First, the RPC DCOM vulnerability is easily exploitable across the network without any user interaction. Second, the RPC DCOM exploit code was readily available and easy to manipulate making it easy to build self-propagation into the worm. Finally, the vulnerability is old enough that there is little fear of the worm doing any damage in the unlikely event that it could be somehow released into the outside network. 5.10. The final stage of Test.X’s lifecycle is the transfer of the executable to the
newly exploited system. As soon as the exploit shellcode is transferred to the target machine, the attacking machine starts a very simple TFTP service joined to UDP port 69. The server listens for a single packet from the target system. Once received, it begins to dump the binary over the network. The shellcode command run on the remote system will receive the binary data and save it to the file bot.exe. Bot.exe will be immediately run after the transfer is complete. When run on the remote system Test’s lifecycle begins on the remote system. It will now install and reboot then run on system startup.
5.11. There was of course concern with writing a worm for this experiment that
it would leak onto the Internet and cause unforeseeable damage. To mitigate this risk, the exploit that was chosen was intentionally greatly outdated and mostly patched across the Internet. Careful control of the worm executable has been exercised to ensure that it does not leak or get executed outside of the test network. Finally, the target spread mechanism of the worm was written in such a way that it would only target the test network and have no way to spread outside. It will only target a 192.168.1.0/24 network and nothing else.
6.
Quarantine System
6.1.Quarantine System Introduction
6.1.1. The quarantine system used for this research was custom written. It uses four Python modules, two network sensors, and a Cisco switch to react to worm activity and coordinate quarantining infected and vulnerable systems on the network. The system is based on two sensors: the Nessus vulnerability scanner and the Snort intrusion detection system. A Python
module was written for each of the two sensors to interface with the sensor over the network. A third Python module was written as network control and it interfaces with the Cisco switch. The fourth module ties the other three modules together by receiving alerts from the two sensors, determining what action to take and interfacing with the network control module.
6.1.2. The two sensors in the system were chosen to protect network hosts during two stages of the infection lifecycle. As a worm spreads over a network it must first search the network for potential targets, identify if they are
vulnerable to the exploit code it carries, and then spread to the target host. After a host is infected it begins scanning the network again for more vulnerable targets.
6.1.3. The Nessus vulnerability scanner detects vulnerabilities in network hosts in a similar way that the worm detects vulnerable targets. When a vulnerable network host is identified it can be moved to an isolated network segment to prevent interaction with other potentially infected hosts. These quarantined hosts are not blocked from accessing the Internet, only from communicating directly with other hosts on the local network.
6.1.4. The Snort intrusion detection system is placed on the network in such a way that it has visibility of all network traffic as it traverses the switch. With this particular system this was accomplished by configuring a Switch Port Analyzer (SPAN) port. The switch forwards all traffic out the SPAN port to the Snort sensor where the sensor can analyze the data. When Snort receives traffic it compares each packet to a database of signatures to detect malicious network traffic. When a worm transmits itself to a newly infected machine, the Snort sensor detects the exploit code and the transmission of the worm code and sends an alert over the network to the quarantine command center. 6.1.5. When the command center receives a syslog message from the Snort
sensor it first blocks the sending machine and then examines the response traffic from the target to determine if it was in fact infected. It the target was infected, the command center then blocks the newly infected target machine. This behavior by the Snort system and the network control system is a form of intrusion protection system.
6.2.Nessus Scanner
6.2.1. The vulnerability-scanning sensor uses Tenable Network Security’s Nessus Vulnerability Scanner version 4.4.0. This software package is installed on a server and controlled via a web browser. Nessus downloads plugins from the Internet and uses those plugins to detect vulnerabilities when scanning targets. Policies are configured on the server and specified before a new scan is run.
6.2.2. For this research it was not necessary to detect all possible vulnerabilities on the network. The scan policy for the network was only configured to detect the vulnerability that the test worm targeted. This allowed for faster scans of the network. In a real world scenario this scanner would need to be capable of scanning all known vulnerabilities at a high rate of speed.
6.2.3. Tenable is consistently creating new plugins as new vulnerabilities are reported. There are two licensing options available for Nessus: the HomeFeed and the ProfessionalFeed. HomeFeed is their free service that provides up-to-date plugins and allows the server to scan up to 15 hosts. ProfessionalFeed is their paid service that provides customer service and no limit on the number of hosts that can be scanned.
proposal, asking for permission to use a ProfessionalFeed license for this research. He kindly provided 3 months of trial licensing, allowing for further development.
6.2.5. The server component of Nessus does not have a command line or graphical user interface. When Nessus is installed, there is a server controller application placed on the desktop to handle starting and stopping the Nessus service. All other interactions with Nessus, including creating policies, starting scans and viewing reports are all handled through the web interface. 6.2.6. The Nessus web interface is completely flash based and communicates with the server via eXtensible Markup Language – Remote Procedure Call (XML-RPC) commands. These commands provide an inter-process communication channel, which allows the server to be controlled from other remote machines, not only the server.
6.2.7. This XML-RPC interface made it possible for the Nessus control module to communicate directly with the server, issuing scan creation, start, and stop commands directly to the server. The XML-RPC command set is well documented by Tenable and provided a very robust control mechanism. Without this communication channel it would have been extremely difficult to automate the scanning and reporting mechanisms that were implemented by the Nessus scanning module of this quarantine system.
6.2.8. The “nessusscan” Python module consists of a handful of simple XML-RPC interfacing functions, some scanner control functions, a report parsing function and a threaded class. The XML-RPC functions are responsible for opening the network socket, logging into the Nessus server and sending and receiving messages from the network socket. The login process produced a session token that must be transmitted with every request as authentication. 6.2.9. This system was only configured to detect a single vulnerability so the
scan policy was manually created on the server via the web interface and given the policy identification of “ID 1”. When a scan begins, the scanner connects a network socket, logs in, and sends the “/scan/new” procedure call. The arguments for “/scan/new” are scan name, policy ID and target. These variables are statically set within the module.
6.2.10. The XML-RPC documentation does not provide any procedure call to check on the progress of a scan, although it may be an undocumented method, as it is possible from within the web interface. Once the new scan has been started by the scan() function, the module needs to wait for it to finish before it can download the scan report. This functionality was made possible using the “/scan/list” procedure call. This returns a list of all active Nessus scans. The scanwait() function was written to constantly poll the server for the list of active scans, and not return until there are no active scans left. This ensures that the scan report is available when the function completed.
parsereport() functions are responsible for downloading the report, storing it locally on the command machine, parsing it for vulnerabilities and sorting them by host and severity. The parsereport() function returns three data structures with the report information; one for each severity level. The RPC-DCOM vulnerability being tested is a severity 3 vulnerability.
6.2.12. All of this scan process is handled by a single function called startscan(). This function starts scans, waits for them to finish, gets the report, parses the report, deletes the report from the server to avoid clutter, and returns the results of the parsed report. Startscan() is called by the run function of the threaded class mentioned above. When the quarantine system runs it instantiates a NessusScanner thread and starts it. When started, a loop begins that runs scans on a timed interval.
6.2.13. A threaded class called “Timer” governs this timed interval. When Timer is created it takes an integer argument that determines how many minutes it will wait. At the beginning of the NessusScanner thread it checks to see if a timer is running. If there is not one running, it starts one. Then it goes on to kick off a Nessus scan. While the scan is running, the thread is constantly checking to see if the timer has completed. If the timer is set to a shorter time than the Nessus scan takes, a new scan will begin before the first is complete, which of course causes problems with the scanwait() function. Optimizing the scan policy and ensuring that the timer is set to high enough intervals avoided this problem.
6.2.14. When the command center creates a NessusScanner thread it assigns it a shared queue object. This object is used by the command center and the NessusScanner to transfer information about vulnerable hosts; specifically it holds IP addresses of vulnerable hosts. When a scan completes, scanstart() returns the lists of vulnerabilities and hosts. The list of severity 3 data is looped through and all host IP addresses are placed onto the shared queue object. This queue object is also passed to the netcontrol thread, which monitors it for newly queued hosts. When a host is queued by Nessus, it is taken off the queue by the network control module and quarantined.
6.3.Snort Monitor
6.3.1. The intrusion detection system uses Snort, an open source system developed by Sourcefire. Snort uses detection signatures, which are distributed by Sourcefire. Because the Snort rule format is open source, custom rules can be written as needed. Snort rules are available via a subscription-based service similar to Nessus. The two subscription levels for Snort are free and paid. The paid subscription gets snort updates daily and real-time as they are developed. The free subscription provides these rules one month later than the paid subscription. The RPC DCOM exploit in Test.X was released in 2003 and Snort has long since released detection signatures for it to the free subscription. This allowed Snort to be used for free.
is responsible for reading layer 2 addresses on data packets and forwarding them out the switch-port that the destination machine is connected to. This provides a level of privacy to hosts connected to the network from other hosts. This presents a challenge for intrusion detection systems that need to be able to see all traffic. Cisco solves this problem by implementing a Switch Port Analyzer (SPAN) setting that can be configured. A SPAN port will receive all network traffic that traverses the switch. An IDS can be placed on a SPAN port and see all network traffic, solving the traditional switching problem. This is what was set up for this research so that Snort could see malware propagation traffic between infected machines and targets. 6.3.3. One advantage that the IDS sensor has over the vulnerability scanner is
that it runs non-stop on the network. This also made the Snort control module much easier to write because there was no start or stop code, the only thing the module was responsible for doing was receiving alerts from Snort, parsing them, and adding them to a queue.
6.3.4. Snort was installed and configured on a Debian Linux server. Snort alerts were sent to the syslog service in Linux, which was configured to send them across the network to the IP address of the server with the command center program running. Syslog is a logging protocol standard commonly used in Linux. It is used for internal log messages and can be forwarded across the network to a central logging server. The syslog service on the Snort server was configured to transmit all messages to the command center server where the Snort monitor module runs.
6.3.5. The Snort monitor module binds to UDP port 514 to receive syslog message data. When a new message is available on the socket, the module copies it into a new string object and parses out the Snort ID of the signature detected, the source of the traffic and the destination. When an infected machine (host-A) attempts to spread to a machine that is not vulnerable to the RPC-DCOM exploit (host-B), it still sends the exploit code, and triggers a Snort alert, but does not successfully spread to the target machine.
6.3.6. This poses a problem for the quarantine system. If both host-A and host-B are quarantined, false positives will be common. On the other hand, if the quarantine system only quarantines host-A, it will be consistently one step behind the spread of the worm when it is successful. To solve this problem, the module receives two messages at a time. When a worm exploit is successful, host-B responds with a TFTP (trivial file transfer protocol) connection back to the host-A. This connection is detected by the Snort monitor and triggers an alert. These two alerts will be sequential and the Snort monitor can determine whether the target has been infected or not. If the second alert is not detected, only host-A is blocked by the quarantine system. On the other hand if the second alert is detected, this signifies a successful spread and both host-A and host-B will be blocked.
6.3.7. The RPC-DCOM exploit Snort ID is 9601 and the TFTP snort ID is 1444.
second alert’s ID is checked. If it is 1444 then the destination’s IP address is also added to the block queue.
6.3.8. The block queue in the Snort monitor module is similar to the queue used by the Nessus scan module. It is passed from the command center into the Snort monitor thread when it is instantiated and is then shared with the net control module. A separate queue is used for Snort than is used for Nessus. The quarantine system treats the results of these modules differently. If a Snort alert triggers a block event then the hosts are blocked from any access to the Internet or any non-infected hosts. Quarantined computers are segregated from each other but are allowed to access the Internet. This will be explained in more detail in the following section.
6.4.Network Control
6.4.1. The network control module is responsible for communicating from the command center server to the Cisco switch. The Python library “telnetlib” was used for communication to the switch and the telnet management interface of the switch was turned on. This is, of course, not a secure way of managing the switch, but for the purposes of this research there was no danger in using an unencrypted communication method and it saved time in development, as there is not currently a Secure Shell (SSH) library for Python 3.1.
6.4.2. In order to segregate computers during a worm infection, a network access control technique was needed. Two options were considered and the use of virtual local area networks (VLANs) was chosen. Another option would be to use the 802.1x authentication protocol. This would allow the network to block or allow a host’s network communication on a switch port based on authentication of the host using certificates installed on the host. Using VLANs as a quarantining method was ideal because of widespread use across the Internet and in enterprise networks; nearly all professional switches and routers support VLAN assignment. A disadvantage of 802.1x is that it would require registration and pre-configuration of the end hosts VLAN placement would not require any contact with new hosts.
6.4.3. A VLAN segregates computers by logically separating ports on a switch. A port is joined to a specific VLAN and all communication through that port is tagged by that VLAN. The switch will not forward any VLAN traffic to a port that is not a member of that VLAN. By default a switch places all ports into VLAN 1 and they can all communicate with each other. Because the switch will not forward VLAN traffic to other VLANs, hosts cannot communicate with hosts on other VLANs, even if they are on the same switch. The only way for traffic to move from one VLAN to another is by traveling up to and through a router. This requires that the VLANs be assigned IP addresses on separate networks, and for the router to allow communications between those two networks. A router can be configured to block traffic from one network to another, or a VLAN can be created that has no connection to the outside through a router.
port. In a production environment, each quarantine-VLAN could be connected to a router and given access to the Internet, but the router would block inter-VLAN communication. The blocked VLAN was configured with no connection to the outside. Only infected hosts were placed in the blocked VLAN, so it was not important that they be protected from each other. 6.4.5. A key requirement for this quarantine system is that each host on the
network must have a dedicated switch port. This is necessary so that the network control module can tell the switch to move a port to a quarantined VLAN and only a single computer would be affected by the network change. This greatly affected the testing infrastructure by limiting the use of virtualization. A single virtualization server with many virtual machines would only be plugged into a single switch port. A virtual machine can be mapped directly to a physical network adapter, but adding enough physical network adapters to a single server was prohibitively expensive. More details of the physical layout of the test network will be described in following sections.
6.4.6. Once the network was built with a single host on each port, a Cisco switch, and the command center server, it was possible for the command center to telnet into the switch and move ports between VLANs as necessary. The “netcontrol” Python module automates these actions and a threaded class was created to interface the telnet switch controls with the command center. The running thread monitors the two Queue objects that are shared with the Nessus and Snort modules. When an IP address is added to one of the queues the netcontrol module retrieves it and begins the process of quarantining or blocking that host.
6.4.7. In order to communicate with the switch, netcontrol had to pass Cisco IOS commands to it. This of course requires a login method to begin communication with the switch and an “enable” method to gain administrative permissions to configure the switch. These methods passed login and enable commands to the switch and responded to login prompts with the appropriate usernames and passwords.
6.4.8. After login and enable commands are successful, the threaded Monitor class that controls netcontrol can pass it quarantine or unquarantine commands. The quarantine method takes two arguments: IP address and source. IP address is the network address of the machine to quarantine or block. Source is an integer, either 1 or 0. If source is 1, this indicates that the IP address is already infected. If source is 0 then the IP is vulnerable. This information is determined based on which queue the object has been retrieved from.
6.4.9. Once a quarantine method has been called it must first resolve the MAC address from the given IP address. Because switches work at the data link layer, they do not have any visibility of layer 3 addresses (IP). Switches do however store the connection port location of each layer 2 address.
question. Only the specified computer will respond to an ARP request, and it responds with its MAC address. This process happens whenever a layer-3 communication happens on a network. If the target host is on the same broadcast domain, it will respond to the ARP request. All hosts in this research are on the same switch, and if they are in the same VLAN, they are within the same broadcast domain, so should respond when requested. 6.4.11. Once a MAC address has been determined, the switch can internally
lookup the port that mac address is connected to. It does this by querying its source address table (SAT). A switch maintains a SAT by watching traffic coming into it on its own ports. When a new source address is seen, the switch determines that it can communicate with that MAC address on that port, and adds that information to its SAT. When the switch needs to send traffic to a requested MAC address, it first queries its SAT for the MAC address. If found, it will only send the traffic out that port. If it’s not found then the traffic will be sent to all ports. The switches SAT can be printed through a telnet session, and is used by netcontrol to find the port that must be quarantined or blocked.
6.4.12. After finding the appropriate switch port, netcontrol simply goes into the configuration mode of the switch and changes the VLAN of that port. Once this is done that port can no longer communicate with any of the other ports or the Internet, depending on which VLAN it has been moved to. If the source argument is 1 (infected) the port will be moved to VLAN 100, if it is 0 (vulnerable) it will be moved to the VLAN that directly corresponds with the port number, shifted up one to allow for VLAN 1 as the default communication port, i.e. Port 24 will be placed in VLAN 25.
6.4.13. Two other simple methods were built into netcontrol for easier management of the testing environment. A “restoreAll” method was created and a “listinfected”. RestoreAll was used to move all ports back to VLAN 1 at the end of a simulation. Listinfected was used as a logging feature to show which ports were in which VLANs at the end of a simulation. Both of these helped to automate testing and debug the emulation system.
6.5.Command Center
6.5.1. Because this system was created to be modular, the command center portion was kept as simple as possible. Essentially, all that this module needs to do is instantiate the three threads and create the shared queues. A timing function was built into the Command Center thread to allow for timed simulations but of course in a production environment it would run continuously.
6.5.3. After the thread has been started, it checks the internal Nessus and Snort settings and spawns those threads accordingly. When a new thread is created, that thread handles creation of its own Queue object. This queue is then referenced by Command and passed into the new netcontrol thread, allowing asynchronous communication between threads.
6.5.4. After threads have been started, Command sleeps while the simulation runs. Most tests were run for 30 minutes. After that time expires, Command stops each thread and closes itself.
6.5.5. The majority of the code for this Command Center is specific to this testing environment. In a production environment this would likely be controlled manually by a graphical user interface of some sort, with many more “knobs” for controlling the frequency of Nessus scans, and the sensitivity of Snort detection. Hosts would have to be manually removed from quarantine or unblocked as IT personnel clear them. These capabilities would be built into a functioning Command Center.
7.
Testing Methodology
7.1.Testing Introduction
7.1.1. After the worm and quarantine system were created, the final phase of research was to run simulations to test the system. A network was needed and a set of simulations needed to be developed to thoroughly test its effectiveness. As described in the worm documentation, the test worm was created with four variants, each having a slightly different approach to propagation. The quarantine system also has four different variations of its configuration. With four quarantine systems and four worms to test per system, there were sixteen tests to be run.
7.2.Test Network
7.2.2. The number of ports on the switch dictated the number of victim hosts. The Cisco switch had twenty-four 100 MBps ports for use by the victim hosts. It also had two 1 GBps ports, one was used as a SPAN port for the Snort sensor, and the other was used to connect a small five port unmanaged switch. The command and control server, two syslog servers and the Nessus scanner were all connected to that second switch. The Nessus server and the Snort sensor were on the thirteenth machine. The command and control server and syslog server were both virtualized on the fourteenth machine.
7.2.3. Once hardware was acquired, Windows Server 2003 and VMware
Workstation were installed on each server and two virtual machines were created per server. The virtual machines (VMs) were all configured with Windows XP Service Pack 1, so that they would be vulnerable to the RPC DCOM exploit used by the test worm. After each VM was fully configured, a VMware snapshot was taken so that they could be easily reverted to a pre-infection state. Each virtual machine was bridged directly to a physical network interface on the server and each network interface was connected to a switch port.
7.3.Testing and Simulations
7.3.1. After the network was fully created, a final round of development and debugging tests were run. These helped to iron out any bugs or problems in the worm, its logging facilities, the quarantine system, and the network infrastructure. Running these tests prevented bugs from interfering with the final set of simulations and data collection. These initial tests also gave a better idea of the time needed for final simulations. Initially tests would run
for two hours, to give the worm enough time to spread across the entire network and stabilize. It was found that, in most cases, this stabilization took less than twenty minutes. For this reason the final simulations were reduced from two hours to thirty-minute runs.
7.3.2. Sixteen final simulations were run to collect data. There are four variations of the quarantine system to be tested: No Protection, Snort Only, Nessus Only, and Full System. Each of these quarantine variations was tested against each variation of the test worm. The four types of worms were different in the way that they spread: Threaded Random (Test.TR), Threaded Linear (Test.TL), Non-Threaded Random (Test.NTR) and Non-Threaded Linear (Test.NTL). Using no protection system established a baseline propagation speed of each type of worm. The other three variations of quarantine system determined the effectiveness of each sensor on its own, as well as the overall effectiveness of the system. The four types of worm were chosen to provide a variation in targeting method, while still keeping the worm simple and not changing the whole structure of the worm. By making the threaded variants it allowed the worm to spread to many more targets simultaneously. This is explored in more detail in the worm documentation above.
7.3.3. To automate each simulation, another Python script was written which reverted the test network to a pre-infection state and began each test. This script iterated over a list of tests. For each test it first cleared the network and reset the VLANs on the switch, it then ran the simulation. When finished the script collected and archived logs and reset the network in preparation for the next test. All switch ports are reverted via a method in the netcontrol module that restores all ports to VLAN 1. To revert the VMs, the script uses the SysInternals utility “psexec” and the VMware command line utility “vmrun” and tells each VM to revert to its pre-infection snapshot.
7.4.Data Collection and Parsing
7.4.1. To collect data during each simulation logs were kept from each worm and from the quarantine system. All worm logs were sent via syslog messages to a central logging server. After each simulation this log was archived and renamed based on which test it corresponded to. The quarantine log was also archived and renamed. These two logs are the primary data collection and stored all information on worm spread and host quarantining with timestamps.
of infected machines as time progressed. When a new spread event happened, a new point was plotted on a graph with the time and new total population. This graph was plotted using the open source utility “gnuplot”. The Python script generated a .p file and passed it into gnuplot to create a PNG image file of the line graph.
8.
Simulation Results
8.2.No Protection
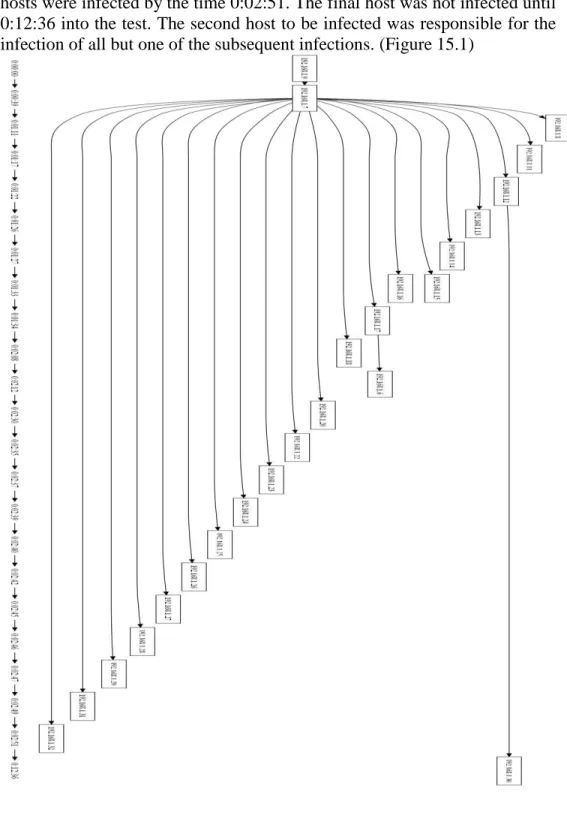
8.2.1. The Test.NTL worm spread from Host-0 to 192.168.1.7 at 0:00:39. The worm then spread to the all but one of the remaining hosts incrementally from there over the next two minutes. Twenty-three out of the twenty-four hosts were infected by the time 0:02:51. The final host was not infected until 0:12:36 into the test. The second host to be infected was responsible for the infection of all but one of the subsequent infections. (Figure 15.1)
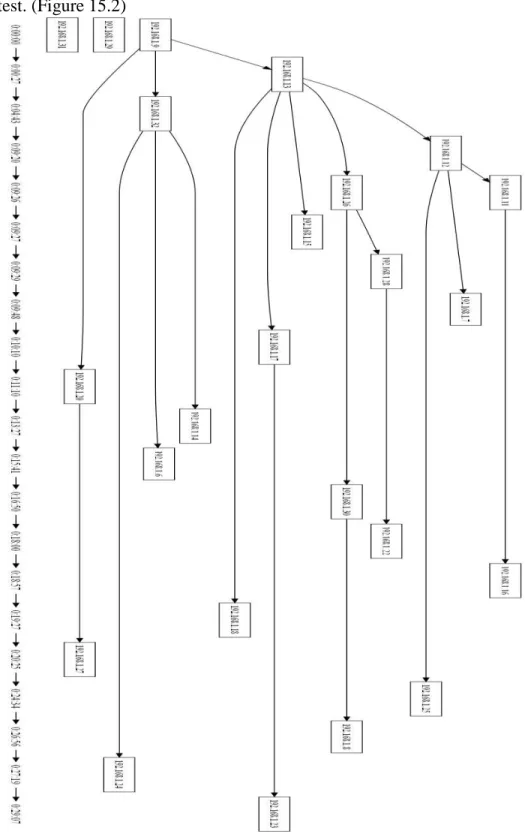
8.2.2. The Test.NTR worm spread from Host-0 to three hosts, two of which were infected in the first five minutes. Each infected host then spread to three or four more hosts. The last host to be infected in this test was at 0:29:07. Twenty-two out of the twenty-four hosts on the network were infected in this test. (Figure 15.2)
8.2.3. The Test.TL worm spread from Host-0 to two other hosts within fifty seconds. Each infected host then spread to a few more systems. The host with IP address 192.168.1.20 infected the most hosts in this test by infecting seven hosts, one of which went on two infect two more. In this test, the worm infected twenty-three of the twenty-four hosts. The last host was infected at 0:24:27. (Figure 15.3)
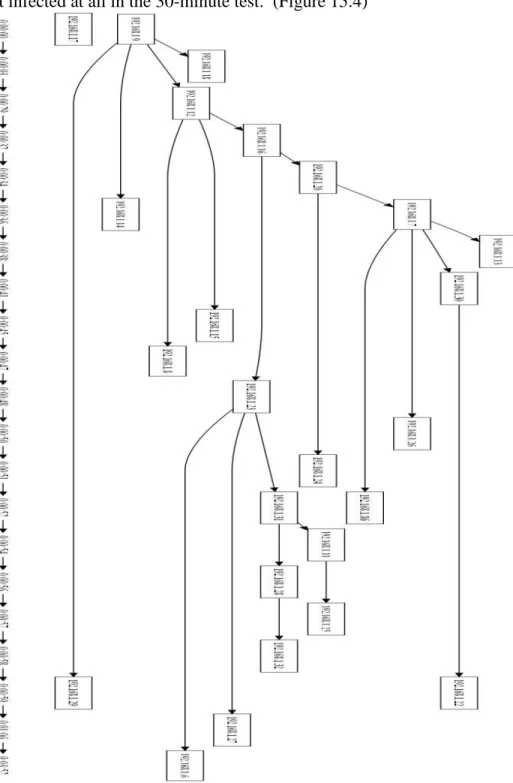
8.2.4. The Test.TR worm spread from Host-0 to three hosts quickly, then one more host toward the end of the test. The first three hosts were infected in the first forty seconds of the test. One of those four hosts went on to infect the rest of the hosts on the network. Each new host infected went on to infect two or three more hosts. Twenty-two of the hosts were infected in the first 0:01:06 of the test, the last host to be infected was at 0:03:52. One host was not infected at all in the 30-minute test. (Figure 15.4)
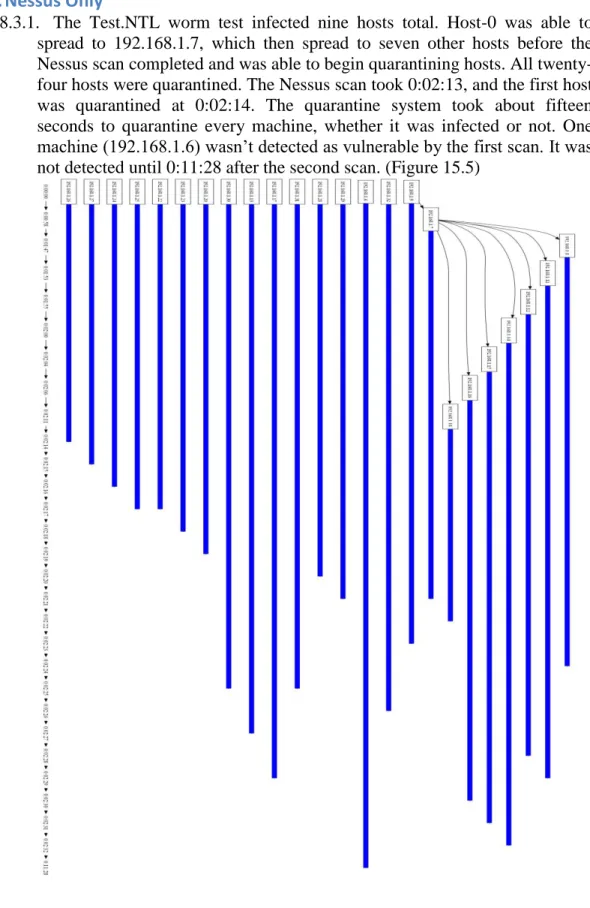
8.3.Nessus Only
8.3.1. The Test.NTL worm test infected nine hosts total. Host-0 was able to spread to 192.168.1.7, which then spread to seven other hosts before the Nessus scan completed and was able to begin quarantining hosts. All twenty-four hosts were quarantined. The Nessus scan took 0:02:13, and the first host was quarantined at 0:02:14. The quarantine system took about fifteen seconds to quarantine every machine, whether it was infected or not. One machine (192.168.1.6) wasn’t detected as vulnerable by the first scan. It was not detected until 0:11:28 after the second scan. (Figure 15.5)
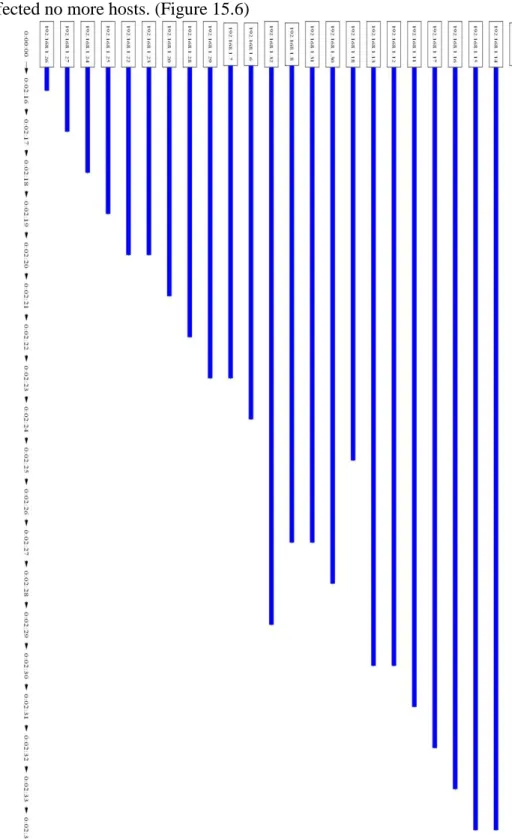
8.3.2. Test.NTR infected zero machines when tested with Nessus only. All network hosts were quarantined. The first scan completed at 2:16 and quarantined all machines by 2:34. After the infection of Host-0, the worm infected no more hosts. (Figure 15.6)
8.3.3. The Test.TL test infected twenty-two machines by 16:00. The first machine was infected after two seconds. Host-0 infected twelve machines. One of these “second-generation” hosts infected another seven machines, and three other machines were infected by the other eleven. The first scan finished at 0:05:19 but did not detect any vulnerabilities. The second scan completed at 0:12:15 and quarantined seven hosts. Thirteen hosts were quarantined total, with the last machine quarantined at 0:22:31. Not all computers were quarantined. (Figure 15.7)
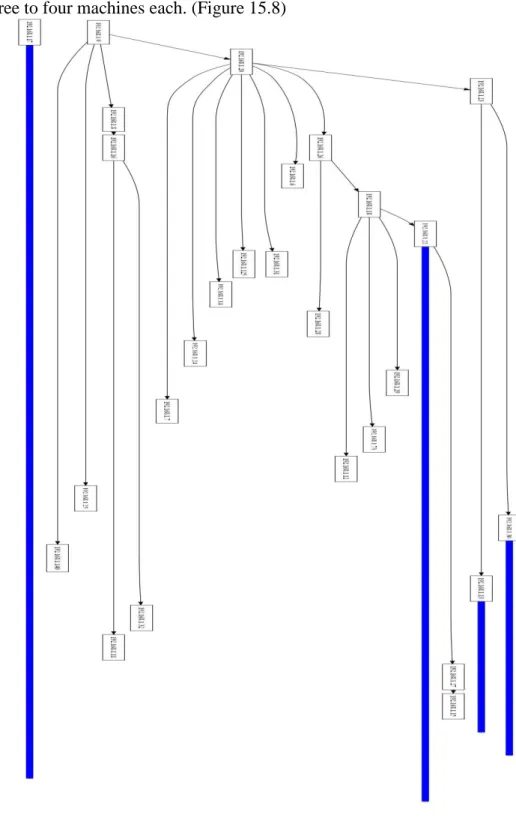
8.3.4. For the Test.TR test, the first infection occurred after 2 seconds, and the last at 0:04:36. A total of twenty-two machines were infected. The Nessus scan ended at 2:34, only quarantining one computer of twenty-two infected at that point. Host-0 infected four machines, and each subsequently infected three to four machines each. (Figure 15.8)
8.4.Snort Only
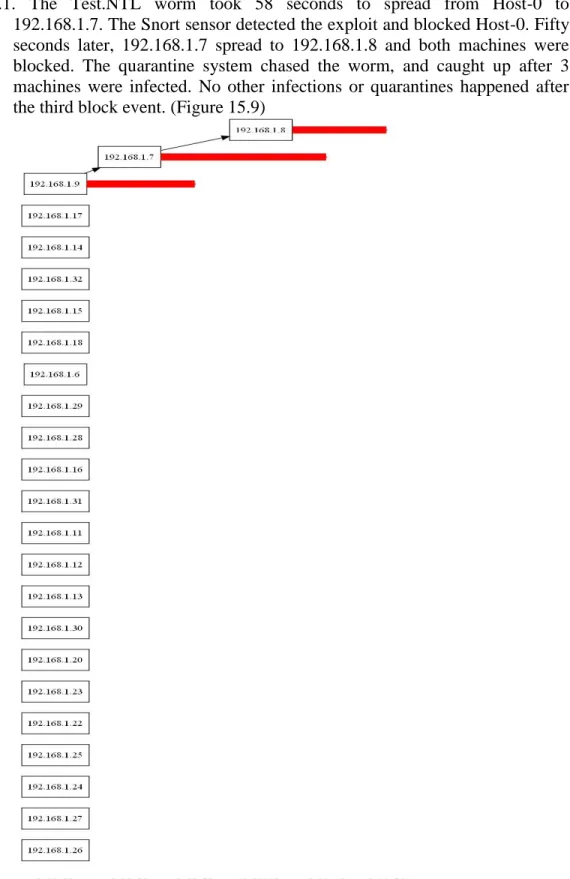
8.4.1. The Test.NTL worm took 58 seconds to spread from Host-0 to
192.168.1.7. The Snort sensor detected the exploit and blocked Host-0. Fifty seconds later, 192.168.1.7 spread to 192.168.1.8 and both machines were blocked. The quarantine system chased the worm, and caught up after 3 machines were infected. No other infections or quarantines happened after the third block event. (Figure 15.9)
8.4.2. In the Test.NTR test, after initial infection, at 0:00:49, Host-0 attempted to spread to an invulnerable host and was quarantined. No other hosts were infected or quarantined over the next 29 minutes. (Figure 15.10)
8.4.3. The Test.TL worm attempted to spread from Host-0 to 192.168.1.18. Both hosts were quarantined before the worm fully spread, when the exploit code was detected by Snort. (Figure 15.11)
8.4.4. The Test.TR test results behaved in the same way as the Test.TL test. The only difference was the host that was attacked first. 192.168.1.13 was exploited by Host-0 and blocked by the Snort sensor before the worm code could be transmitted across the network. This resulted in both hosts being blocked and the worm contained 4 seconds into the test. The remaining 29 minutes passed without any further events. (Figure 15.12)
8.5.Full System
8.5.1. In the Test.NTL test, after initial infection of Host-0, the worm unsuccessfully attempted to spread to another computer but was blocked after 52 seconds. No other machines were blocked, quarantined, or infected throughout the simulation. It is notable though that all three Nessus scans failed to detect any vulnerable hosts, even though twenty-four vulnerable hosts existed on the network. (Figure 15.13)
8.5.2. The Test.NTR worm, at 0:01:12, attempted to spread from Host-0 to an invulnerable system and the quarantine system blocked Host-0. Between 0:12:34 and 0:21:56, twenty machines were quarantined by Nessus scans. There were no further infections and three machines were not quarantined or infected.(Figure 15.14)
8.5.3. 2 seconds into the Test.TL test, Host-0 spread to a second computer; both were blocked 10 seconds later by snort. All but one of the remaining computers were quarantined between 0:02:18 and 0:21:39. One computer remained unaffected and twenty of the twenty hosts were protected from infection. (Figure 15.15)
8.5.4. In the Test.TR test, initial infection spread from Host-0 to 192.168.1.11 and to 192.168.1.28. Both Host-0 and 192.168.1.11 were blocked immediately and 192.168.1.128 was blocked 2 seconds later. All three hosts were blocked by 0:00:10 seconds. The remaining twenty-one machines were quarantined between 0:12:29 and 0:12:45. No more machines were infected after 0:00:10. (Figure 15.16)
9.
Population Growth Results
9.1. The Test.NTL worm population grew quickly from one host to twenty-two hosts in the first three minutes. The worm took nearly a minute to spread from Host-0 to the first and second hosts. After 0:01:17, the propagation spread accelerated and in the next minute seventeen hosts were infected. The last two hosts were infected over the last twenty-seven minutes. (Figure 16.1)
9.2. The Test.NTR worm population grew slowly for the first nine minutes of the test, growing from one to four hosts. After 0:09:20 the population began to grow quickly to the next nine hosts, then from there it grew steadily to reach a final population of twenty-two hosts. (Figure 16.2)
9.3. The Test.TL worm population grew very quickly from the start, the first infection was three seconds into the test and eighteen of the hosts were infected in the first three minutes. The final population of twenty-three was reached after another twenty-one minutes. (Figure 16.3)
9.4. The Test.TR worm population grew from one infected host to twenty-two infected hosts by 0:01:06. The last host was infected about three minutes later. (Figure 16.4)
10.
Simulation Analysis
10.1. No Protection
10.1.1. The Test.NTL worm spread to 95.83% of the total population within three minutes. The worm was able to spread so quickly because of the layout of IP addresses on the network. The worm targets hosts by beginning at the first IP address on the subnet and incrementing through the subnet sequentially. This was uniquely effective against the test network because the DHCP server assigns IP addresses sequentially from the beginning of the subnet. These two configuration anomalies worked together to allow the worm to spread with almost perfect success to all of the vulnerable systems on the network. 10.1.2. The Test.NTR test spread in a more predictable way across the network.
Because the worm targeted hosts randomly, it spread evenly, though a bit slower than the linear worms. This worm demonstrates the epidemic spread that is more prominent in flash Internet worms. As the worm spreads to a few hosts, those hosts then go on to spread to even more. This is the effect that the quarantine system is expected to be most effective against.
10.1.3. The Test.TL worm should be a slightly faster version of the Test.NTL worm. Because the worm is threaded, there are many instances of the worm scanning the network at any given time. The Test.TL worm had to be altered slightly so that each thread scans a different section of the subnet. If this weren’t done, all of the threads would scan the same targets at the same time, and threading the worm would not be beneficial at all. The threaded worms were configured to spawn fifteen threads, which scanned seventeen hosts each. Because the DHCP server assigned IP addresses to the beginning of the network, the first two threads were the only ones that scanned vulnerable hosts. This explains why the Test.TL worm was about as fast as the Test.NTL worm, even a little slower.
10.1.4. The Test.TR worm was much more able to take advantage of multithreading because it was more suited to the random targeting. The Test.TR worm is the fastest propagation for this reason. As previously stated, the random worm displays the more realistic epidemic spread. This is intensified by threading the worm because there are more random IPs being targeted at a given time.
10.2. Nessus Only
10.2.1. With the Nessus sensor protecting the network, the Test.NTL worm was very effective. As seen in the baseline tests, the Test.NTL worm variant spreads very quickly due to the placement of IP addresses by the DHCP server. This allowed the worm to spread to nine hosts before the Nessus scan finished at 0:02:14. Once the scan was complete, all of the hosts were quarantined and prevented the worm from spreading further. This shows that the Nessus sensor is effective, but limited by the scan duration.
10.2.2. The Test.NTR simulation with only the Nessus sensor was perfectly successful. As previously noted in the last section, the Nessus scanner is limited by its scan duration. In the baseline scan with the Test.NTR worm, it took a while for the worm to find a vulnerable host. The first host was infected in about one minute and the second after four minutes. When the worm was run with the Nessus scanner protecting the network, the worm was unable to randomly choose any vulnerable targets before the Nessus scan was complete. This allowed the entire set of vulnerable hosts to be quarantined before the worm could spread at all.
91.66% of the network. The remaining two hosts were quarantined after the second scan completed successfully. It is likely though that the worm targeted them and the worm was unable to spread to them for other reasons. 10.2.4. The Test.TR simulation with only Nessus was completely overcome by
the speed of the worm. The Nessus scan finished and quarantined only 192.168.1.17. The next scan completed with no results. The third scan completed at 0:22:33 and quarantined 192.168.1.7. This scan again shows the two failings of using only a Nessus sensor to protect the network. The Nessus scan fails to perform properly on all three of the scans of this simulation. If the scans had performed properly, the worm spread was so fast, spreading to 87.5% of the population before the first Nessus scan completed. Two of the three remaining hosts were not infected at all, and only four hosts were quarantined at all.
10.3. Snort Only
10.3.1. The Test.NTL test with the Snort sensor active was a drastic improvement over any other tests thus far. The Snort sensor detected the spread event from Host-0 to 192.168.1.7 and quarantined Host-0 immediately. The simulation logs show that Host-0 actually attempted to exploit 192.168.1.6 at 0:00:46 but failed to spread. The Snort sensor did not detect this exploit event, as it should have. Eleven seconds later, Host-0 spread to 192.168.1.7 and Host-0 was quarantined immediately. The quarantine system should have blocked both hosts at this point. This can be explained based on the way the quarantine system determines whether an exploit event culminates in a full worm spread. The Snort sensor detects both the exploit event, and the TFTP traffic that follows from the exploited machine. The quarantine system must receive these two Snort events sequentially though. The system only buffers one alert after an exploit alert. In this case it is possible that another unrelated Snort alert was generated between the exploit alert and the TFTP alert. This could cause the quarantine system to only block the sending host. Fifty seconds later 192.168.1.7 spread to 192.168.1.8 and both hosts were blocked. The quarantine system worked as expected and was able to block only the infected hosts. The Snort sensor only takes action against hosts that have “misbehaved”. Consequently, only the three hosts were blocked and the rest were left untouched.
10.3.2. The Test.NTR worm tried to exploit from Host-0 to 192.168.1.72. This host was invulnerable to the exploit and was not affected. The exploit code traversing the network triggered a Snort alert and caused Host-0 to be blocked immediately. At this point Host-0 was the only infected host and was unable to communicate or spread to any other hosts on the network. The quarantine system performed perfectly in this test; blocking Host-0 before it could spread and not blocking any hosts unnecessarily.
place within the first four seconds of the simulation. The worm was prevented from spreading further. For the Snort sensor to work, the worm must show itself on the network and must attempt to exploit a target. If that first target is vulnerable, the worm will successfully spread and the Snort sensor will block both hosts. If the target is not vulnerable, the exploit code will trigger a Snort alert and the quarantine system will watch for the TFTP traffic. When the TFTP traffic is not seen, the quarantine system will only block the sending host.
10.3.4. The Test.TR simulation resulted exactly the same as the Test.TL simulation. Host-0 scanned three targets and exploited 192.168.1.13 after three seconds. The quarantine system blocked both Host-0 and 192.168.1.13 by 0:00:04.
10.4. Full System
10.4.1. The Test.NTL simulation combined both the Snort sensor and the Nessus scanner. Host-0 attempted to spread to 192.168.1.6 after fifty-two seconds. 192.168.1.6 was invulnerable and did not respond to the exploit, so the Snort sensor only blocked Host-0. The Nessus scanner ran three times over the thirty-minute test and each scan failed to detect any vulnerable systems on the network. The network in fact had twenty-four hosts that were vulnerable and should have been detected by Nessus. Without the Snort sensor in this simulation, the worm would have likely spread unchecked. This is strong evidence for having both sensors active in the quarantine system.
10.4.2. The Test.NTR worm in the Full System test did not spread beyond Host-0. Host-0 attempted to exploit 192.168.1.84 and was blocked in the process. The first Nessus scan returned with no results but the second scan detected the vulnerability in eighteen out of twenty-three vulnerable systems. Two more vulnerable systems were detected in the third scan and three hosts were missed by the Nessus sensor altogether.
10.4.3. The Test.TL test resulted in two hosts blocked and twenty-one hosts quarantined. The threaded versions of the worm in past tests exhibit a higher capability of successfully exploiting vulnerable systems as the first target. This proved true in this test as well, Host-0 scanned six hosts before it successfully targeted 192.168.1.18 and spread to it. The quarantine system detected this spread and quarantined Host-0 and 192.168.1.18 at 0:00:04 and 0:00:12 respectively. The Nessus scanner went on to detect and quarantine seventeen hosts after the first scan and three more hosts after the second scan. One host was left untouched by the protection system.
11.
Population Growth Analysis
11.1. With no protection the Test.NTL worm population growth dynamic should
be predictable by an exponential growth formula. The worm will spread to a second host and both of them then go on to spread to two more hosts. The population will grow from one, to two, to four, and will continue to grow exponentially. This test initially appears to match the curve of an exponential graph, but by looking closer at the spread timeline you see that after Host-0 spreads to the second host, that second host spreads to the rest of the network. Because there is really a single infection vector, it is not taking advantage of an exponential epidemic spread. This is due to two unique characteristics of the simulation. Because the DHCP server sequentially assigns IP addresses and the worm targets hosts linearly, the second host infected was able to spread quickly across the network before the other hosts had the opportunity to begin scanning. Also because all infected systems spread in the exact same pattern, later systems will be targeting hosts that have already been infected or are invulnerable.
11.2. The Test.NTR worm displayed a much more predictable epidemic spread
that more closely resembled an exponential spread. In this test having more infected hosts scanning enhanced the likelihood that vulnerable systems would be infected. This worm targeted new hosts randomly. Unlike the linear worms, it was able to take advantage of those higher infection numbers and epidemic spread. The curve never reached a “flash point” where it spread to the rest of the network instantly. This is due to the overhead that the worm has between infection and when it can begin scanning. It is also difficult to fully determine a mathematical growth pattern with so few data points.
11.3. The Test.TL and Test.TR worms spread extremely quickly across the network. The population grew nearly to the maximum population in a few minutes. The Test.TL worm gained five more hosts over the next fifteen minutes. The Test.TR worm reached its maximum population by four minutes into the simulation.
11.4. Because the test network only contains twenty-four hosts, the worm spreads much too quickly to see an exponential curve expressed in the data. All of the data from these tests are relatively linear because of the speed of the worm and the limits of the test network. On a much larger network, the worm could be expected to spread slowly to start and accelerate until it reaches a nearly vertical growth line. On a bounded network, the worm would continue to grow at this rate until all vulnerable hosts are infected. On an unbounded network it would eventually plateau as each host has a harder and harder time finding vulnerable hosts. This ending curve would match a logarithmic function.
12.
Quarantine System Performance
worm were better able to target vulnerable hosts for the first spread, these two worms were able to spread from Host-0 to a second host. In the Test.TR variant the worm was caught by the system as it spread to a third host. Fully enabled, over the course of all four tests, the system was able to protect 89/96