City, University of London Institutional Repository
Citation
:
Mitroglou, N., Nouri, J. M. and Arcoumanis, C. (2009). Spray structure from double fuel injection in multihole injectors for gasoline direct-injection engines. Atomization and Sprays, 19(6), pp. 529-545. doi: 10.1615/AtomizSpr.v19.i6.30This is the unspecified version of the paper.
This version of the publication may differ from the final published
version.
Permanent repository link:
http://openaccess.city.ac.uk/1516/Link to published version
:
http://dx.doi.org/10.1615/AtomizSpr.v19.i6.30Copyright and reuse:
City Research Online aims to make research
outputs of City, University of London available to a wider audience.
Copyright and Moral Rights remain with the author(s) and/or copyright
holders. URLs from City Research Online may be freely distributed and
linked to.
Spray structure from double fuel injection in
multi-hole injectors for gasoline direct-injection engines
N. Mitroglou, J. M. Nouri and C. Arcoumanis
School of Engineering and Mathematical Sciences, City University London, Northampton Square, London EC1V 0HB, UK
Corresponding author j.m.nouri@city.ac.uk
ABSTRACT
The spray characteristics of double fuel injection in multi-hole injectors for direct-injection gasoline engines have been evaluated in a constant-volume chamber using Iso-Octane as fuel. Measurements of droplets mean and rms velocity and their diameter were obtained using a 2-D phase Doppler anemometer (PDA) at injection pressures up to 120bar, atmospheric chamber pressures and ambient temperatures up to 115°C. Complementary spray visualisation made use of a pulsed light, a CCD camera and a high-speed video camera synchronised with the injection process. Spray images with double injection revealed that there are delay times in needle opening and closing of the order of 0.6ms and 0.3ms, respectively, and that dwell times less than 0.5ms introduced a pre-spray prior to the second injection event while, for dwell times more than 0.5ms, the images showed that the overall jet-spray structure in the cases of the first and second injection event remained the same as those of single injection.
PDA results near the injector exit quantified the relatively strong pre-spray at 0.3ms dwell time and revealed that its strength reduced with increasing dwell time so that at 1ms there was no sign of the pre-spray. The effect of ambient chamber temperature on the spray velocity for double injection was found to be significant at temperatures above 90°C; results at higher temperatures, 115°C, showed a consistent reduction in the mean droplets velocity up to 10% within the core of the first and second sprays, with a corresponding increase in the RMS velocity fluctuations due to the increased vaporisation rates and the droplets momentum loss. The droplet size distribution of the double injection spray was, in general, similar to that of single injection except during the dwell time when the droplets arithmetic mean diameter (AMD) with pre-spray was found to be smaller than those without the pre-spray because of the different type of droplets and the much higher data rates in the case of the pre-spray.
INTRODUCTION
Direct-injection spark-ignition (DISI) gasoline engines are under continuous research and development in an effort to maximise their full potential in terms of fuel economy and CO2 emissions. In Europe, for example, the European Automobile Manufacturers’ Association (ACEA) members have committed themselves to lower their vehicle fleets' CO2 emissions to 120g/km by 2012. In DISI engines, various approaches have been researched which mainly focus on part-load charge stratification under overall very lean conditions using combustion systems based on wall-, air-, or spray-guided configurations that employ different relative position between the injector and the spark plug, modifications to the piston crown shape, variable and multiple injection timing, and various air motion and mixture preparation strategies [1]. More recent research has been focusing on spray-guided combustion systems employing either central or side fuel injection. The major advantage of this configuration is that it makes use of the injection process to ensure that a stable combustible mixture reaches the spark plug at the time of ignition which, in turn, depends strongly on the spray temporal and spatial characteristics [2-3].
New high-pressure multi-hole injectors and outwards opening piezo injectors, referred to as ‘second-generation’ systems, were introduced into the market on the assumption that they are capable of producing stable fuel sprays with very fine fuel droplets independent of the time of fuel injection. Such typical multi-hole injectors are used in the present investigation, since they offer the highest possible flexibility in adapting the spray pattern layout to a particular combustion chamber design. There have been rather limited investigations of DISI multi-hole injectors [12-15] confirming the improved stability of the spray at elevated chamber pressures relative to that of swirl injectors. Also, enhanced air entrainment has been observed due to the larger surface area of the separated spray jets and enhanced flexibility to direct the sprays towards the spark plug, thus allowing improved matching between the injector, the generated spray and the combustion chamber design. Recently some detailed experimental investigations have been carried out and reported in [15-19] on the spray characteristics and mixture distribution in engines equipped with high-pressure multi-hole injectors operating at injection pressures up to 200bar and chamber pressures up to 12 bar. These studies have confirmed that the overall spray angle relative to the axis of the injector is independent of injection and chamber pressure. The measured spatial droplet velocity profiles were jet-like at all axial locations, with the maximum local velocity at the centre of the jet, implying limited effect of the airflow. Within the measured range, the effect of injection pressure on droplet size proved to be rather small while the increase in chamber pressure from atmospheric to 12bar resulted in much reduced droplet velocities, by up to fourfold, and larger droplet sizes by up to 40%. For late fuel injection during the compression stroke aiming at stratified, overall lean, mixtures the elevated in-cylinder gas pressure/density reduces spray penetration and produces a more compact spray that can more easily be directed towards the spark plug gap.
The present investigation is the continuation of previous work done by the same research group [15-19] by focusing on the spray characteristics of double injection in multi-hole injector nozzles. Double injection strategy has proved to be an effective way of minimising engine and catalyst warm-up time [20-22], a period during which emissions are at their highest level. In addition, double injection contributes to the formation of a consistently combustible air/fuel mixture around the spark-plug electrode; it also results in reduced spray tip penetration for both injection events, which prevents fuel impingement on cylinder walls and the piston crown. Splitting the total injection duration into two parts is dictated by the engine load requirement. In particular, homogeneous stoichiometric mixture is achieved by placing the first injection during induction and the second during the early compression stroke. Furthermore, a common strategy for creating a stratified mixture places the first injection early in the compression stroke followed by the second injection shortly after. The aim is, therefore, to characterise the sprays from the double injection as a function of injection pressure, injection duration, and the delay time between the two injections often referred to as the “dwell time”. A pulsed light source and a CCD camera were used to produce Mie images of the spray and a phase-Doppler anemometer (PDA) allowed droplet velocities and sizes to be measured. Such experiments, using injection into a constant volume chamber under quiescent flow conditions, have provided an assessment of the injection system operating parameters and their effect on the ensemble averaged temporal and spatial spray characteristics. The following sections describe the experimental arrangement and the measurement systems followed by presentation and discussion of the results and a summary of the main conclusions.
EXPERIMENTAL SETUP AND INSTRUMENTATION
assist the needle-opening event, it is the absolute rail pressure that affects injection pulse durations smaller than 0.9ms. Another consequence of the long needle opening delay is to limit considerably parameters related to the multiple-injection strategy. The long needle delay time associated with any injection pulse duration constitutes a major drawback for the commercial exploitation of multi-hole high-pressure gasoline injectors for DISI engines unless they are driven by a piezoelectric stack.
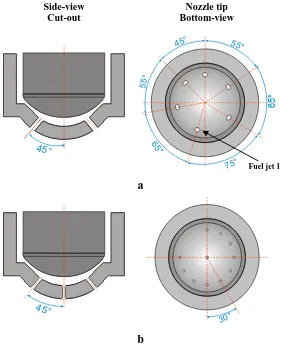
Side-view Cut-out
Nozzle tip Bottom-view
45°
75°
65°
65°
55°
55°
45°
a
45°
30°
[image:4.595.162.445.122.467.2]b
Figure 1 Tested multi-hole nozzle configurations. (a) Asymmetric 6-hole, (b) 12-hole with a central hole and two blocked peripheral holes.
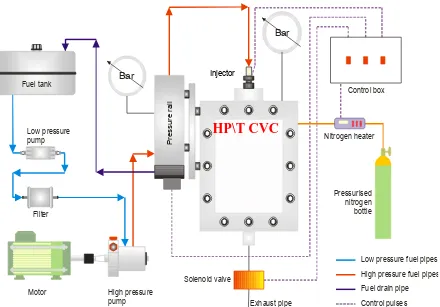
A constant-volume chamber (CVC) was used to allow experiments to be performed under quiescent flow conditions with full optical access for optical measurements such as those used in [15 & 19]. A schematic diagram of the high-pressure\temperature CVC and the high-pressure fuel injection system is shown in Figure 2. The CVC, located in the middle of the figure, was made of stainless steel and was equipped with four quartz windows. The chamber was connected to a pressurised nitrogen bottle for accurate setting of the required chamber pressure (up to 25bar). The nitrogen flow through the CVC is not continuous and quiescent flow conditions were achieved with a solenoid valve installed in the chamber’s exhaust pipe; the exhaust pipe and solenoid valve were thus essential equipment for discharging the chamber contents after each injection to avoid fouling of the window. The fuel injection system comprised a common rail, a three-piston-type high pressure pump coupled to an electric motor to provide pressures up to 200bar, a rotary valve regulator to maintain the common rail pressure, a fuel tank, a low-pressure fuel pump to deliver fuel to high-low-pressure pump, the filter and the fuel tank. The common rail was connected to the injector via a pipe with a specific diameter and length, to simulate more closely the engine operating conditions. The injector was mounted centrally on the top face of the CVC and was injecting vertically downwards.
Iso-octane has been selected as the working fluid since it is more convenient for optical studies compared to gasoline. In addition, iso-octane is a single-component fuel that features constant properties, in contrast to commercial grade gasoline which varies in composition according to the oil supplier. Iso-octane has a density, kinematic viscosity and surface tension of 692kg/m3, 0.78cSt and 0.0188N/m, respectively and, as a single component fuel, can be more easily simulated in CFD calculations.
Figure 2 Schematic of the high-pressure\temperature constant volume chamber (HP\T CVC) test rig and the high pressure injection system.
Figure 3 Schematic of the spray visualisation set-up.
The Mie scattering spray visualisation set-up of the high-pressure multi-hole injector is shown schematically in Figure 3. The CCD camera used for the still spray imaging was a 12bit fast shutter Sensicam with a resolution of 1280x1024 pixels and a minimum exposure time of 100ns; it was fitted with a zoom lens and connected to a PC via a PCO image acquisition card through an optical data cable. The PC also had a timer card installed that triggered both the spark light and the camera. All internal camera settings could be adjusted with the image acquisition software. The spray was illuminated by Xenon spark light equipped with two flexible optical fibres which increased the effectiveness of the imaging set-up. A total of 20 images were acquired at every time-step (time After Start Of Injection – ASOI) with an adequate sample population for a statistical analysis after image post-processing. The post-processing of the acquired images was performed by in-house, highly customised software, developed on the Matlab platform. High-magnification images were also obtained using a telescopic lens, to allow the exact start of injection (SOI) to be identified accurately. Start of injection represents the zero time in all the results presented in subsequent paragraphs; it is defined as the time the first liquid appears at the exit of the injection hole.
The injector timing and the solenoid valve, together with the timing of other devices, were all controlled electronically with a National Instruments PCI-6602 32bit general-purpose timer/counter card featuring 8 individual counter/timers for delivering flexible TTL signals as and when required. This guaranteed
Bar
Fuel tank
Low pressure pump
Filter
Solenoid valve
Exhaust pipe
Control box
P
re
ssu
re
r
a
il
Low pressure fuel pipes High pressure fuel pipes Fuel drain pipe Control pulses Motor High pressure
pump
Bar
Nitrogen heater
Pressurised nitrogen bottle
HP\T CVC
[image:5.595.171.439.400.574.2]sufficient high-speed injection pulses and triggering signals for the camera and flashlight. For the injector timing, the definitions of all double injection related values are illustrated in Figure 4. A Microsoft Visual Basic program was developed, which was interfaced to a PC for controlling the hardware. The trigger and imaging parameters were set according to the PCO system software, which also managed the acquired images and made simple batch image processing possible. The high-speed digital video camera utilised an IEEE1394 (FireWire) communication protocol with its control software.
Time [ms]
Injection
pulse
Dwell time
1 injection
st [image:6.595.145.462.133.296.2]2 injection
ndVoltage
Figure 4 Definitions of injection duration and “dwell time” in the double injection pattern.
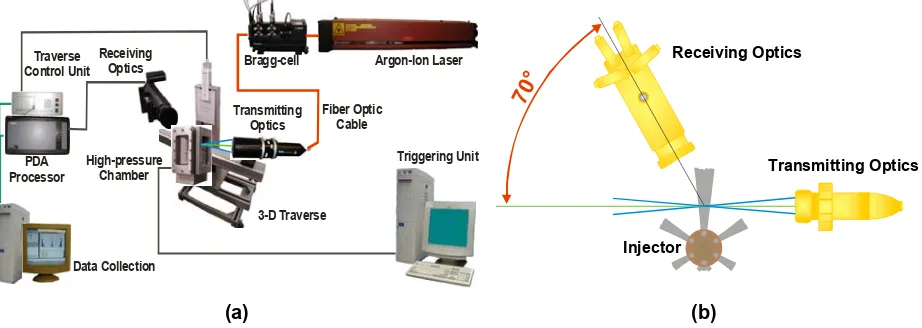
The 2-D Dantec PDA system shown in Figure 5 was used to measure the two droplet velocity components and the droplet diameter simultaneously. An Argon-ion laser supplied the laser light beam with a maximum power output of 1.5W, and was aligned with an optical unit which included the laser beam splitter and the Bragg-cell. This unit was responsible for splitting the laser beam into a pair of green light at a wavelength of 514.5nm, used to provide the axial velocity component, and a pair of blue light at 488nm wavelength and provided the radial velocity component; each pair consisted of two equal intensity beams that featured a 40MHz frequency shift provided by the Bragg-cell. The transfer of the laser beams to the transmitting optics was through a fibre optic cable. The collimating and focusing lenses formed an elliptical intersection volume with major and minor axes of approximately 2.863 and 0.092mm for the green, and 2.716 and 0.088mm for the blue component. The PDA receiving unit consisted of a 310mm focal length lens that focused the collected light onto the four photomultipliers (PM) through a slit of 0.01mm width which was capable to minimise the major axis of the measuring volume and to ensure that multi-particle detection is avoided. The receiving optics was positioned at 70° to the plane of the two green laser beams, Figure 5(b), to ensure that refraction dominated the scattered light; the afore-described optical set up detects droplet sizes up to 96μm. Transmitting and receiving optics were both mounted on a three-dimensional traversing mechanism with a positional sensitivity of 0.01mm in the x-y plane and 0.05mm in the vertical, z, direction, thus minimising any positional error.
(a) (b)
Figure 5(a) Schematic of the 2-D PDA system; (b) Top view of the PDA optics set-up.
The signal from the four photomultipliers was transmitted to the processor unit where all the data processing was carried out. The processor was connected to a desktop computer via an Ethernet adaptor where all the acquired data were saved for further analysis. The measurement period was defined by the injection duration for each test case; this period varied from 2.5–4.5ms. The total number of samples collected each time was of the order of 10,000 samples/ms of measurement and was collected over many injection cycles. The measurement period was divided in narrow time windows of 0.1ms for further post-processing of the collected data which consisted of time, axial and radial velocity components as well as droplet size information. Post-processing involved calculation of
ensemble-Injector
Transmitting Optics Receiving Optics
70°
Argon-Ion Laser Bragg-cell
Transmitting Optics Receiving
Optics
3-D Traverse High-pressure
Chamber Traverse
Control Unit
PDA Processor
Data Collection
Triggering Unit Fiber Optic
[image:6.595.72.533.524.688.2]averaged values of droplet mean and root mean square (rms) velocities as well as arithmetic mean (AMD) and Sauter mean (SMD) diameters over 0.1ms time interval with number of samples varied from 500 to 1000 with maximum statistical uncertainties of less than 1.7% and 6.2% in the ensembled droplet mean and rms velocities, respectively, based on a 95% confidence level and a velocity fluctuation of 20% of the mean value. The ambiguity of droplet sphericity was minimized by using two pairs of PMs to measure the droplet size, hence, a droplet was considered spherical when the difference between measured values from each pair of PMs was within 5%.
RESULTS AND DISCUSSION
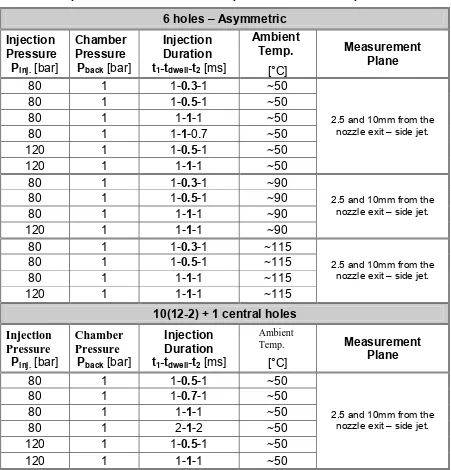
[image:7.595.79.530.335.805.2]Before presenting the data, a brief explanation of the terminology used is required. Zero time refers to the start of injection (SOI) and not the electronic start; the difference between the two is the needle opening delay of each injector. The start of injection is defined as the time the first liquid appears at the hole exit while injection duration is defined by the electronic injection pulse width as shown in Figure 4. The delay time between SOI and electronic start as described above was quantified in [18] using a CCD camera with an exposure time and triggering time resolution of 1μs and a high-magnification telescopic lens to visualise the near nozzle exit sprays. It was found that the start of injection for both nozzles was 0.6ms after the electronic start of injection, and that the effects of injection and chamber pressure on the SOI time were negligible, with a difference of the order of ±0.02ms, i.e. 3.5% of the total delay time. The results of spray visualisation are presented first, followed by the PDA measurements; all results are presented based on the time after start of injection (ASOI) as defined above. The experimental conditions of the presented data are summarised in Table 1.
Table 1 Double injection test cases for the 6-hole – Asymmetric and the 12-hole symmetric nozzles.
6 holes – Asymmetric
Injection
Pressure
P
inj.[bar]
Chamber
Pressure
P
back[bar]
Injection
Duration
t
1-t
dwell-t
2[ms]
Ambient
Temp.
[°C]
Measurement
Plane
80 1 1-0.3-1 ~50
80 1 1-0.5-1 ~50
80 1 1-1-1 ~50
80 1 1-1-0.7 ~50
120 1 1-0.5-1 ~50
120 1 1-1-1 ~50
2.5 and 10mm from the nozzle exit – side jet.
80 1 1-0.3-1 ~90
80 1 1-0.5-1 ~90
80 1 1-1-1 ~90
120 1 1-1-1 ~90
2.5 and 10mm from the nozzle exit – side jet.
80 1 1-0.3-1 ~115
80 1 1-0.5-1 ~115
80 1 1-1-1 ~115
120 1 1-1-1 ~115
2.5 and 10mm from the nozzle exit – side jet.
10(12-2) + 1 central holes
Injection
Pressure
P
inj.[bar]
Chamber
Pressure
P
back[bar]
Injection
Duration
t
1-t
dwell-t
2[ms]
Ambient Temp.
[°C]
Measurement
Plane
80 1 1-0.5-1 ~50
80 1 1-0.7-1 ~50
80 1 1-1-1 ~50
80 1 2-1-2 ~50
120 1 1-0.5-1 ~50
120 1 1-1-1 ~50
Spray Visualisation
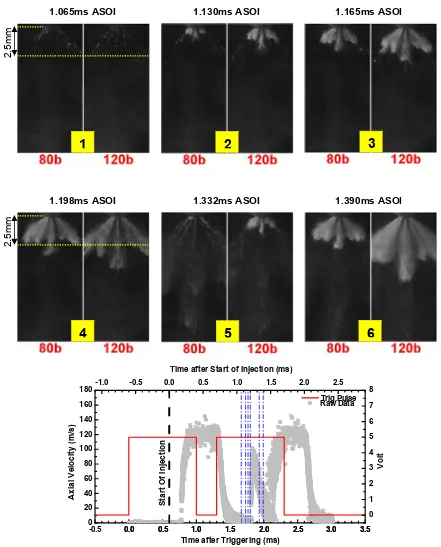
Observation of spray images with double injection near the nozzle exit revealed that the start of injection (SOI) for the first injection event is found to be 0.6ms after the TTL pulse, while for the second injection this time was highly dependent on the dwell time. More specifically, multi-hole injectors that are coil-driven feature a finite needle closing delay time which has been identified to be around 0.3ms. In the unfortunate event where the dwell time was of the order of the closing delay time (0.3-0.5ms) the behaviour of the second injection changed dramatically and became unstable. Under these conditions high-speed spray imaging recorded a pre-spray of very short duration prior to the second injection event. This behaviour is due to short dwell time settings that do not allow enough time for the needle and the driving coil to recharge. Fortunately, for dwell times greater than 0.5ms normal development of the second injection event was confirmed.
1.065ms ASOI 1.130ms ASOI 1.165ms ASOI
1.198ms ASOI 1.332ms ASOI 1.390ms ASOI
-0.5 0.0 0.5 1.0 1.5 2.0 2.5 3.0 3.5 0
20 40 60 80 100 120 140 160 180
Raw Data
Axial Ve
loc
ity (m/s)
Time after Triggering (ms)
0.0 0.5 1.0 1.5 2.0 2.5 3.0 3.5 0 1 2 3 4 5 6 7 8
Volt
Trig.Pulse -1.0 -0.5 0.0 0.5 1.0 1.5 2.0 2.5
S
tar
t Of Inj
e
ction
[image:8.595.78.519.195.742.2]Time after Start of Injection (ms)
Figure 6 Top and middle row: Double injection of 1ms injection duration for both injection events and 0.3ms dwell time. Time sequence of high-speed images acquired during the dwell time period at injection pressures of 80 and 120bar. Bottom row: Combination of injection electronic pulse with raw PDA data taken at 80bar injection pressure and at 2.5mm from the nozzle exit presented in two timescales.
1
2
3
4
5
6
2.
5mm
2.
The double injection spray images revealed that the overall spray structure of the first injection remains the same as those of single injection as presented previously in [15, 19] (in those investigations effects of injection pressure and chamber pressure on overall and jet cone angle, spray pattern and tip penetration were quantified and the early stage of the spray development near the nozzle exit was presented). The same conclusion can be drawn for the second injection, for dwell times more than 0.5ms. The present work focuses on the spray structure of the second injection and investigates any parameters that may affect its characteristics. As mentioned before, a pre-spray prior to second injection was observed with dwell time less than 0.5ms which was found to be affected significantly by injection pressure as shown in Figure 6, where a representative sequence of images is illustrated for two injection pressures of 80 and 120 bars; the two injection events have the same duration and the dwell time is set to 0.3ms. The graph at the bottom row of Figure 6 is an illustration of raw phase-Doppler anemometry (PDA) data combined with the electronic injection pulse; the presented raw PDA data were measured at 2.5mm from the nozzle exit at an injection pressure of 80bar at the centre of the jet. The scattered raw PDA data show clearly the two injection events plus the presence of the pre-spray prior to the second injection. On the same graph a dual x-axis system clarifies the difference between time after triggering and after start of injection, as defined earlier in this section. Finally, the times at which all sets of images (1st – 6th) were taken is indicated on the same graph with the blue dash-dotted lines.
In the first set of images in the given sequence at 1.065ms ASOI, the first injection event has just finished, as shown in the raw PDA data at the bottom of Figure 6. Around 0.07ms later (2nd set of images), the emergence of the pre-sprays out of the nozzle is clearly evident at both injection pressures and they last for almost 0.17ms (2nd to 5th set of images). According to the illustration at the bottom row of Figure 6 the temporal position of the 2nd, 3rd and 4th set of images is before the pre-spray, at 80bar injection pressure, reaches 2.5mm from the nozzle exit, where the raw PDA data were measured. The pre-spray end at times between 1.198 to 1.332 (between 4th and 5th set of images) and the emergence of the second injection event can be seen in the 5th set of images. As previously explained, the presence of the pre-spray is related to the short dwell time settings which prevent the driving coil of the needle to be fully recharged. Apart from the pre-spray that is visible in the above time-sequenced spray images, the emergence of the second injection has occurred sooner (between 4th and 5th set of images) than expected in the case of the 120bar injection pressure. This is thought to be happening due to the fact that inadequate time has been allocated to the needle to be kept closed and, as a result, the higher injection pressure contributes to a faster needle-opening event. As already mentioned these abnormalities disappear when dwell times are greater than 0.5ms.
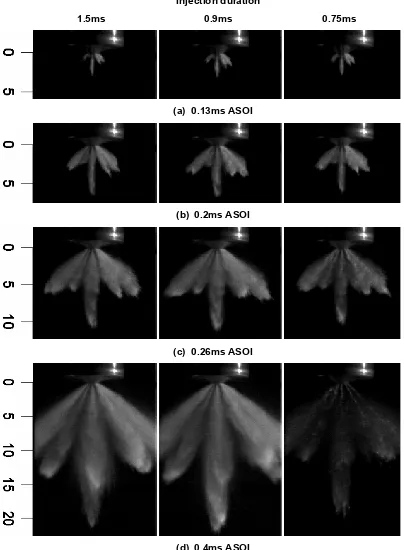
Injection duration
1.5ms 0.9ms 0.75ms
(a) 0.13ms ASOI
(b) 0.2ms ASOI
(c) 0.26ms ASOI
[image:10.595.106.510.67.617.2](d) 0.4ms ASOI
PDA Measurements
Although spray imaging is a useful tool in the initial stages of a spray characterisation experiment, quantitative droplet information is essential in completing the picture. Droplet velocity and size distribution data, as well as their behaviour under various thermodynamic chamber conditions, are needed to provide conclusive evidence of the appropriateness of multi-hole injectors for second-generation spray-guided DISI engines.
2.5mm
10mm
30mm
Several points acquired
to cover the full width of
the jet
i
v
i
u
U
totalSimultaneous acquisition
of
radial, vi,
and axial, ui,
velocity components
r
z
[image:11.595.122.446.138.294.2]θ
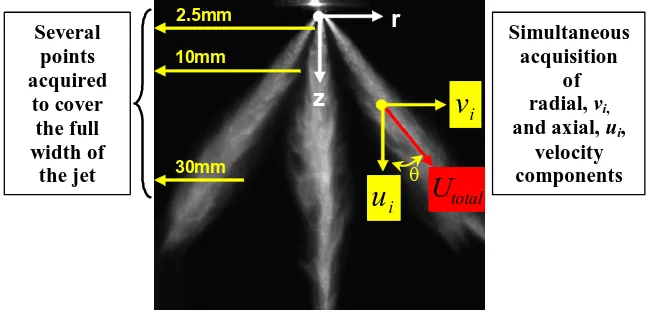
Figure 8 PDA measurements grid and resultant velocity definition.
The double injection test conditions listed in Table 1 have been investigated thoroughly in the constant volume chamber. Droplet velocity and size distribution data have been acquired using a two-dimensional PDA system and a limited set of results are presented below in order to quantify the effect of double injection on droplet velocity and size distribution. The reason is that they are quite similar to the results of single injection reported for the same injectors [15, 19]. Figure 8 illustrates the measurements grid for all PDA experiments and the definition of the resultant velocity. The selection of the measurement planes was based on the primary and secondary droplet break-up lengths, which are believed to be less than 2.5mm and 10mm, respectively [23-25]. Additionally, simultaneous acquisition of radial and axial velocity components for a single droplet allows the accurate calculation of the resultant velocity, including its direction angle θ that is linked to the overall spray cone angle.
Temporal velocity profiles and droplet size distributions are presented in this section, quantifying the effects of injector operational parameters on droplet velocities and sizes. Temporal profiles present the variation in both droplet velocities and sizes throughout the injection process at one measurement location at the centre of the spray jet exiting from hole 1 as indicated in Figure 1.
-0.5 0.0 0.5 1.0 1.5 2.0 2.5 3.0 3.5 4.0 0 20 40 60 80 100 120 140 160 180 Raw Data
Mean Velocity (m/s)
Ax ia l V e lo ci ty (m /s )
Time after Triggering (ms)
[image:12.595.126.442.55.255.2]0.0 0.5 1.0 1.5 2.0 2.5 3.0 3.5 4.0 0 1 2 3 4 5 6 7 8 Volt Trig.Pulse
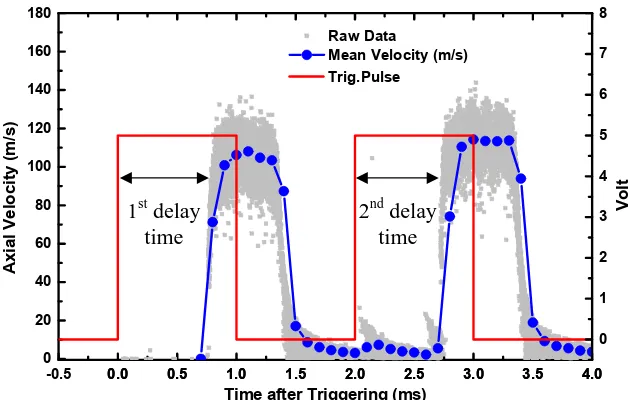
Figure 9 Instantaneous droplet velocity profile of a double injection event and corresponding injection triggering pulse superimposed on the same graph.
It should be mentioned that Figure 9 represents a typical temporal variation of the instantaneous droplet velocity at an injection pressure of 80bar and, as it is clearly evident, all the details of the injection process are fully registered for both injection events and the dwell time such as needle’s opening and closing and the spray core; the results at the higher injection pressure of 120bar are of the same quality. Considering that the fuel sprays investigated here are quite dense, it can be argued that the measured droplet velocities and sizes such as those presented in Figure 9 provide confidence in the measurements and the derived conclusions.
Comparison of spray results between double and single injections reveals no significant changes in droplet velocities and will not be considered here, but in this report the focus would be to quantify the effects of injection pressure, dwell time and temperature on the spray characteristics with double injection. Figure 10 illustrates the effect of injection pressure at a distance of 2.5mm from the nozzle exit, where the expected increase in droplet velocities at the higher pressure is clearly visible by up to 35m/s. The results also show that the rate at which the droplets velocity increases at higher pressure during the needle lift is slightly faster in the second injection than that of the first injection which was observed in all conditions tested. The reason for this could be the fast needle opening as explained in Figure 9. The droplet rms velocity fluctuations are, in general, following the mean velocity variations and are almost the same for both injection pressures in the first injection event, while in the second injection event the lower pressure shows somewhat larger rms values by up to 4m/s. This may indicate that the initial flow inside the sac volume and nozzle is not the same for both injection events which suggests that the 1ms dwell time is not long enough for the internal flow of the second injection to establish itself like that of the first injection.
0.0 0.5 1.0 1.5 2.0 2.5 3.0 3.5 4.0 0 20 40 60 80 100 120 140 160 180 V e lo ci ty ( m /s )
Time ASOI (ms)
Mean 80b RMS 80b Mean 120b RMS 120b
Figure 10 Effect of injection pressure on double injection for a 6-hole asymmetric nozzle injecting at 1bar chamber pressure; values measured at 2.5mm from the nozzle exit: dwell time, 1st and 2nd injection durations are 1ms.
1st delay
time
2nd delay
[image:12.595.177.394.548.711.2]0.0 0.5 1.0 1.5 2.0 2.5 3.0 3.5 4.0 0
20 40 60 80 100 120 140 160 180
Velo
city
(m/s
)
Time ASOI (ms)
[image:13.595.96.470.56.247.2]Mean D.T.=0.3ms RMS D.T.=0.3ms Mean D.T.=0.5ms RMS D.T.=0.5ms Mean D.T.=1ms RMS D.T.=1ms
Figure 11 Effect of dwell time on double injection for a 6-hole asymmetric nozzle; values measured at 2.5mm from the nozzle exit at 80bar injection pressure.
Next, the effect of dwell time has been quantified in the presence of the pre-spray prior to the second injection event for relatively short dwell times. The results for three dwell times of 0.3, 0.5 and 1ms at 2.5mm from the injector are presented in Figure 11 and reveal that the dwell time has negligible effect on the droplet mean and rms velocities of the first injection. On the other hand, the effect of dwell time on the spray generated by the second injection is quite significant. With the shortest dwell time of 0.3ms, the presence of the pre-spray is clearly evident with velocities up to 80m/s prior to the second injection event. With increasing dwell time the pre-spray becomes less pronounced so that at 0.5ms dwell time the peak velocity of the spray is reduced to 60m/s, while at 1ms dwell time there is almost no sign of the pre-spray. Concerning the velocity variations in the spray associated with the second injection event, there is no significant effect of the dwell time except for the delay in start of the needle opening which scales with the increase in dwell time, as expected. It is also evident that, for all cases presented here, the effect of the dwell time on the rms droplet velocity fluctuations of both injection events is negligible with similar rms velocity profiles.
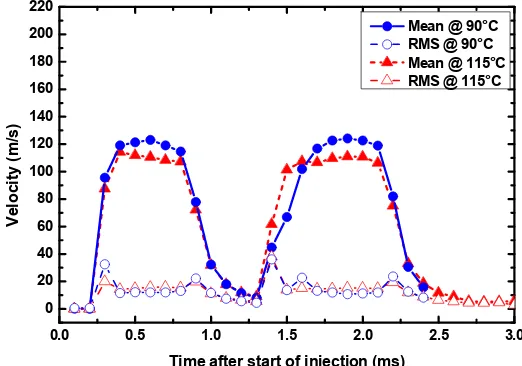
At 2.5mm from the nozzle exit, as shown in Figure 11, the presence of the pre-spray is not insignificant for dwell times less than 0.5ms, altering the velocity field especially prior to the second injection event. However, further downstream at 10mm from the nozzle exit, it appears that the pre-spray merges with the second injection spray as can be seen in Figure 12. This is probably due to the higher velocity droplets from the second injection event which catch up the slower moving pre-spray droplets and mix together, causing a less steep velocity gradient for the second injection spray and a broadening of its velocity profile.
0.0 0.5 1.0 1.5 2.0 2.5 3.0
0 20 40 60 80 100 120 140 160 180 200 220
Velocit
y
(m/
s
)
Time after start of injection (ms)
[image:13.595.172.433.528.711.2]Mean @ 90°C RMS @ 90°C Mean @ 115°C RMS @ 115°C
Figure 12 Double injection droplet velocities from a 6-hole nozzle at 80bar injection pressure, at 90° and 115°C and at 10mm from the nozzle exit: dwell time is 0.3ms; 1st and 2nd injection durations are 1ms.
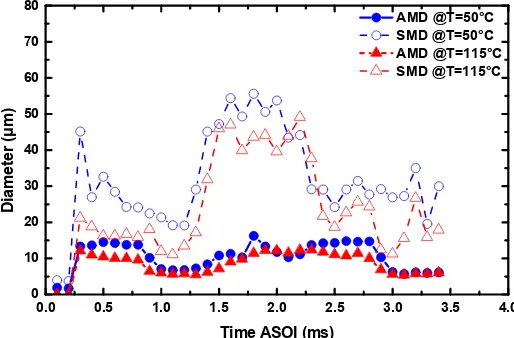
≈105°C at 1bar) the effect of temperature becomes apparent with slightly lower mean velocities especially within the core region; when the needle is fully open, at the first and second injection events, an average reduction of 10% can be seen. The observed reduction in the mean droplet velocities at 115°C compared to 90°C is possibly due to the increased vaporisation rates associated with the higher temperature that reduces the droplet mass and, thus, the droplet momentum. It is interesting to note that, within the core of the spray where the mean velocity is reduced, the rms velocity fluctuations show consistently higher values at higher temperatures which is a reflection of the more significant fluctuations in the instantaneous droplet velocities due to the relative loss of the droplet mass through evaporation. The latter is confirmed by droplet size distributions illustrated in Figure 13, where arithmetic and Sauter mean droplet diameters (AMD & SMD) are presented for chamber temperatures of 50 and 115°C; injection duration for both injection events and dwell time are set to 1ms and measurements are taken at 10mm from the nozzle exit. The reduction in droplet sizes is evident for the higher chamber temperature everywhere, in particular, during the main injection events where reductions of the order of 30% can be seen.
0.0 0.5 1.0 1.5 2.0 2.5 3.0 3.5 4.0
0 10 20 30 40 50 60 70 80
D
iamet
er (
μ
m)
Time ASOI (ms)
[image:14.595.175.432.230.399.2]AMD @T=50°C SMD @T=50°C AMD @T=115°C SMD @T=115°C
Figure 13 Double injection droplet size distributions from a 6-hole nozzle at 80bar injection pressure, at 50° and 115°C and at 10mm from the nozzle exit: dwell time, 1st and 2nd injection durations are 1ms.
As mentioned in the previous paragraph, droplet size distributions of the spray in the case of double injection does not show any significant changes relative to that observed and reported for single injection [15-19] with the same injector. There is, however, one extra operating parameter with double injection that affects the droplet size distribution in a predictable manner and this is the dwell time. The previously analysed pre-spray formed during short dwell times prior to the second injection event, consists of droplets which can be different in size from those formed during longer dwell times with no pre-spray. The mechanism of pre-spray formation is simple and stems from needle instability caused by short dwell times which force the needle to open before it has shut completely. The end result is that the needle does not fully open and the pre-spray is formed that is characterised by large droplets due to incomplete atomisation mechanism relative to that at full needle lift. These are discussed by the droplet size distributions presented in Figure 14 for two dwell times and two distances from the nozzle exit in order to evaluate the secondary break-up.
As illustrated in Figure 14 (top row), in the interval between the two injection events (marked region), droplet sizes are similar or even larger than those measured during the main injections. The results also indicate that the droplet size distributions during the longer dwell time (1ms with no pre-spray) are either similar (SMD) or larger (AMD) than those during the shorter dwell time (0.3ms with pre-spray) at 2.5mm from the nozzle exit (Figure 14 top row). This can be explained from the type of droplets and the number of samples collected during the dwell time periods. In the case of the 0.3ms dwell time (Figure 14a) when there is a pre-spray, the data rate is very high and the validated samples per averaging time window can be as many as 3,000, thus influencing the AMD values. On the other hand, a dwell time of 1ms (Figure 14b) does not produce a pre-spray and the validated samples during that period are low and may not exceed 500 per time window. This low number of validated samples during the dwell time period is the result of droplets formed by liquid ligaments exiting the injection holes after the needle has closed; these liquid ligaments are produced from the liquid left in the sac volume and emerge from the injection holes with little atomisation due to the lack of upstream pressure; they are captured by the PDA system as few large droplets which control the SMD values. However, the afore-described situation is reversed at 10mm from the nozzle exit (Figure 14 bottom row).
the order of 20%, during the main injection events. Furthermore, droplet sizes measured during the dwell time period appear to be reduced compared to main injection events, for a dwell time of 0.3ms (Figure 14a bottom row). As mentioned in previous paragraph, droplets from the second injection event with velocities of the order of 100m/s catch up slower moving droplets from the pre-spray and mix together. The latter suggests that droplet sizes during the short dwell time period (0.3ms) at 10mm from the nozzle exit would appear to have much smaller sizes compared to that of main injection. In the case of the longer dwell time of 1ms, the same trend is observed but in a much smaller scale (Figure 14b bottom row). The reason is the absence of any pre-spray combined with the long dwell time that prevents any droplet mixing. As a result, the number of samples validated during that period is low, thus SMD values (Figure 14b bottom row) are larger than that during the main injection events.
Time between the two
injection events
0.0 0.5 1.0 1.5 2.0 2.5 3.0 3.5 4.0 0 20 40 60 80 Di am et er ( μ m)
Time ASOI (ms)
AMD SMD
0.0 0.5 1.0 1.5 2.0 2.5 3.0 3.5 4.0 0 20 40 60 80 Di amet er ( μ m)
Time ASOI (ms)
AMD SMD
0.0 0.5 1.0 1.5 2.0 2.5 3.0 3.5 4.0
0 20 40 60 80 Di am ete r ( μ m)
Time ASOI (ms)
AMD SMD
0.0 0.5 1.0 1.5 2.0 2.5 3.0 3.5 4.0 0 20 40 60 80 D iam ete r ( μ m)
Time ASOI (ms)
AMD SMD
[image:15.595.69.540.177.555.2]a b
Figure 14 Effect of dwell time for a 6-hole asymmetric nozzle at 80bar injection pressure for a dwell time of (a) 0.3ms (b) 1ms. Top row: at 2.5mm and bottom row: at 10mm from the nozzle exit.
CONCLUSIONS
The spray characteristics of gasoline high-pressure multi-hole injectors have been investigated in a constant-volume chamber using a combination of Mie scattering visualisation and phase-Doppler anemometry (PDA). The effects of various operating parameters have been quantified and the most important conclusions can be summarised as follows:
1. Observation of the spray images with double injection revealed that the start of the second injection event was highly dependent on the dwell time. To prevent this, the minimum dwell time should be set to a value higher than the needle closing delay time (0.3ms for the multi-hole injectors used here). Spray visualisation and PDA measurements confirmed that a dwell time longer than 0.5ms can ensure normal development of the second injection.
3. For dwell times less than 0.5ms, high-speed spray imaging revealed the presence of a pre-spray prior to the second injection due to shorter than the required time for the driving coil of the needle to be fully recharged. The sequence of images also showed that the start of the second injection depended on the injection pressure and occurred sooner than expected in the case of higher injection pressure due to the faster needle-opening at higher pressures.
4. PDA results very near the injector exit revealed the presence of a relatively strong pre-spray at 0.3ms dwell time with maximum droplet velocities of the order of 0.58 times the maximum velocities in the main injection events. The strength of the pre-spray reduced with increasing dwell time so that at a time of 0.5ms the maximum droplet velocity ratio was reduced to 0.42 and diminished completely at 1ms dwell time. Further downstream, at 10mm from the nozzle exit, the pre-spray was merged with the second injection spray as its faster moving droplets overtook the slower moving pre-spray droplets, causing a broadening of the second injection velocity profile. For dwell times longer than 0.5 ms, comparison of the PDA spray results between double and single injection showed no significant changes with similar droplet velocity profiles.
5. The effect of ambient chamber temperature on the double injection spray mean and rms velocities was found to be very small and insignificant up to temperatures of 90°C, but the results at 115°C (close to the boiling temperature of the fuel) showed lower mean velocities, by 10% on average. 6. The droplet size distribution of the double injection spray, in the absence of the pre-spray, did not
show any significant changes relative to that of single injection for the same injector. However, the droplets AMD diameter during the dwell time period with pre-spray was found to be smaller than those without pre-spray, as in the former case a larger number of sample was measured due to the presence of the pre-spray, while the droplets in the latter case were larger in diameters and smaller in number.
ACKNOWLEDGEMENTS
The financial support provided by the Yamaha Motor Corporation and EPSRC under Grant GR/R71740/01 is gratefully acknowledged. The authors would like to thank Tom Fleming and Jim Ford for valuable technical support during the course of this work.
REFERENCES
1. M. Wirth, D. Zimmermann, R. Friedfeldt, J. Caine, A. Schamel, M. Davies, G. Peirce, A. Storch, K. Ries-Müller, K. P. Gansert, G. Pilgram, R. Ortmann, G. Würfel, J. Gerhardt, A Cost Optimised Gasoline Spray Guided Direct Injection System for Improved Fuel Economy, Seminar on Fuel Economy and Engine Downsizing. IMechE, OneBirdcage Walk, London, 13 May 2004.
2. G. Fraidl, W. F. Piock and M. Wirth, The potential of the direct injection gasoline engine, 18th Int. Vienna Motor Symposium, 24-25 April, 1997.
3. I. G. Birth, M. Rechs, U. Spicher and S. Bernhardt, Experimental Investigation of the In-Nozzle Flow of Valve Covered Orifice Nozzle for Gasoline Direct Injection, 7th
Int. Symp. Internal Combustion Diagnostics, pp. 59-78, Kurhaus Baden-Baden, 2006.
4. G. Wigley, G. K. Hargrave and J. Heath, A high power, high resolution LDA/PDA system applied to dense gasoline direct injection spray, 9th Int. Symp. on Applications of Laser Techniques to Fluid Mechanics, 1, Paper 9.4, 1998.
5. M. H. Shelby, B. A. VanDerWege, and S. Hochgreb, Early spray development in gasoline direct-injection spark-ignition engines, SAE Paper 980160, 1998.
6. W. Ipp, H. K. Wagner, M. Wensing, A. Leipertz, S. Arndt and A. K. Jain, Spray formation of high-pressure swirl gasoline injectors investigated by two-dimensional Mie and LIEF techniques, SAE Paper 1999-01-0498, 1999.
7. J. M. Nouri and J. H. Whitelaw, Spray characteristics of a GDI injector with short injection duration, International Journal of Exp. Fluids, Vol. 31, No. 4, pp. 377-383, 2001.
8. M. Gavaises and C. Arcoumanis, Modelling of sprays from high pressure-swirl atomisers, International Journal of Engine Research, Vol. 2, No. 2, 2001.
9. T. Li, K. Nishida and H. Hiroyasu, Characterization of initial spray from a D.I. gasoline injector by holography and laser diffraction method, Journal of Atomization and Sprays, Vol. 14, pp. 477-494, 2004.
11. J. M. Nouri and J.H. Whitelaw, Gasoline sprays in uniform cross-flow, Journal of Atomization and Spray, Vol. 17, No. 7, pp. 621-640, 2007.
12. R. Ortmann, S. Arndt, J. Raimann, R. Grzeszik, and G. Wurfel, Methods and analysis of fuel injection, mixture preparation and charge stratification in different direct-injected SI engines, SAE Paper 2001-01-0970, 2001.
13. S. Arndt, K. Gartung and D. Bruggemann, Influence of ambient temperature on the evaporation rate of hexadecane droplets Proc, ILASS-Europe 2001.
14. A. M. Lippert, S. El Tahry, M. S. Huebler, S. E. Parrish, H. Inoue, T. Noyori, K. Nakama and T. Abe, Development and optimisation of a small-displacement spark-ignition direct-injection engine – Stratified operation, SAE Paper 2004-01-0033, 2004.
15. N. Mitroglou, J. M. Nouri, M. Gavaises and C. Arcoumanis, Spray Characteristics of a multi-hole Injector for Direct-Injection Spark-Ignition Engines, International Journal of Engine Research, Vol. 7, No. 3, pp. 255-270, 2006.
16. N. Mitroglou, C. Arcoumanis, K. Mori and Y. Motoyama, Mixture distribution in a multi-valve twin-spark ignition engine equipped with high-pressure multi-hole injectors, Journal of Physics: Conf. Series; 2nd Int. Conf. Optical and Laser Diagnostics (ICOLAD), Vol. 45, pp. 46-58, 2006.
17. N. Mitroglou, Multihole Injectors for Direct-Injection Gasoline Engines, PhD Thesis, The City University, London, UK, 2006.
18. J. M. Nouri, N. Mitroglou, Y. Yan and C. Arcoumanis, Internal flow and cavitation in a multi-hole injector for gasoline direct injection engines, SAE Paper 2007-01-1405, 2007.
19. N. Mitroglou, J. M. Nouri, Y. Yan, M. Gavaises and C. Arcoumanis, Spray structure generated by multi hole injectors for gasoline direct injection engines, SAE Paper 2007-01-1417, 2007.
20. T. Landenfeld, A. Kufferath and J. Gerhardt, Gasoline Direct Injection - SULEV Emission Concept, SAE Paper 2004-01-0041, 2004.
21. Y. J. Wang, J. X. Wang, S. J. Shuai, X. H. Lei and X. L. An, Study of Injection Strategies of Two-Stage Gasoline Diret Injection (TSGDI) Combustion System, SAE Paper 2005-01-0107, 2005.
22. G. A. Szekely and A. C. Alkidas, Combustion Characteristics of a Spray-Guided Direct-Injection Stratified Charge Engine with a High-Squish Piston, SAE Paper 2005-01-1937, 2005.
23. A. Fath, C. Fettes, A. Leipertz Investigation of Diesel Spray Break-UP Close to the Nozzle at Different Injection Conditions. Fourth International Symposium on Diagnostics and Modeling of Combustion in Internal Combustion Engines, Kyoto, Japan, pp 429-434, 1998
24. C. Soteriou, R. Andrews, N. Torres, M. Smith and R. Kunkulagunta, Through the Diesel Nozzle Hole – a Journey of Discovery. ILASS Americas, 14th Conference on Liquid Atomization and Spray Systems, Dearborn, MI, 2001