1
The contribution of energetically reactive surface features to the dissolution of
1CeO
2and ThO
2analogues for spent nuclear fuel microstructures
2
3
Claire L. Corkhill*1, Emmi Myllykylä2, Daniel J. Bailey1, Stephanie M. Thornber1, Jiahui Qi3, Pablo 4
Maldonado4, Martin C. Stennett1, Andrea Hamilton5 and Neil C. Hyatt*1 5
6
1 Immobilisation Science Laboratory, Department of Materials Science and Engineering, The University of 7
Sheffield, UK. 8
2 VTT Technical Research Centre of Finland, Espoo, Finland. 9
3 Royal School of Mines, Imperial College London, London, UK. 10
4 Department of Physics and Astronomy, Uppsala Universitet, Uppsala, Sweden. 11
5 Department of Civil and Environmental Engineering, The University of Strathclyde, UK. 12
13
*Corresponding authors: 14
Email: [email protected]; [email protected] 15
Tel: +44 (0)1142226036; +44 (0)1142224570 16
Full correspondence address: Department of Materials Science and Engineering, Sir Robert Hadfield 17
Building, Mappin Street, Sheffield, S1 3JD. 18
19
20
21
22
23
2
Abstract
1
In the safety case for the geological disposal of nuclear waste, the release of radioactivity from the 2
repository is controlled by the dissolution of the spent fuel in groundwater. There remain several 3
uncertainties associated with understanding spent fuel dissolution, including the contribution of 4
energetically reactive surface sites to the dissolution rate. In this study, we investigate how surface features 5
influence the dissolution rate of synthesised CeO2 and ThO2, spent nuclear fuel analogues which 6
approximate as closely as possible the mineral structure characteristics of fuel-grade UO2 but are not 7
sensitive to changes in oxidation state of the cation. The morphology of grain boundaries (natural features) 8
and surface facets (specimen preparation-induced features) were investigated during dissolution. The 9
effects of surface polishing on dissolution rate was also investigated. We show that preferential dissolution 10
occurs at grain boundaries, resulting in grain boundary decohesion and enhanced dissolution rates. A 11
strong crystallographic control was exerted, with high misorientation angle grain boundaries retreating 12
more rapidly than those with low misorientation angles, which may be due to the accommodation of 13
defects in the grain boundary structure. The data from these simplified analogue systems support the 14
hypothesis that grain boundaries play a role in the so-called "instant release fraction" of spent fuel, and 15
should be carefully considered, in conjunction with other chemical effects, in safety performance 16
assessements for the geological disposal of spent fuel. Surface facets formed during the sample annealing 17
process also exhibited a strong crystallographic control and were found to dissolve rapidly on initial contact 18
with dissolution medium. Defects and strain induced during sample polishing caused an overestimation of 19
the dissolution rate, by up to 3 orders of magnitude. 20
Key words: Nuclear fuel; dissolution; grain boundaries; faceting; surface; atomic force microscopy 21
22
23
24
25
26
3
1. Introduction
1
Spent nuclear fuel is a heterogeneous material composed primarily of UO2, with a minor component of 2
actinides (e.g. Np and Pu) and fission products (e.g. Sr, Cs and I). The preferred route for disposal of this 3
material is within a geological disposal facility, several hundreds of meters below the ground. In such an 4
environment, the release of radionuclides to the geo- and bio-spheres is controlled by the dissolution of the 5
spent fuel in groundwater, thus it is important to understand the mechanisms and kinetics of dissolution. 6
The dissolution behaviour of spent fuel is dominated by the behaviour of the UO2 matrix and, as such, a 7
simplified system comprising UO2 only is often used in experiments to determine SNF dissolution. Based 8
upon a wide range of dissolution investigations of SNF and UO2 (see reviews1, 2) it has been estimated that 9
the fractional dissolution rate of spent nuclear fuel is in the range of 10-6 to 10-8 per year, indicating that 10
complete dissolution is likely to occur within ~10 million years3. However, natural uraninite (UO2) ores are 11
known to be stable in the earth under reducing conditions for periods of billions of years4, 5 suggesting that 12
laboratory experiments may over-estimate the dissolution rate of UO2 by more than two orders of 13
magnitude. 14
15
It has been demonstrated that experimentally-derived dissolution rates of other minerals, such as quartz 16
and feldspar, are also often found to be higher than the corresponding weathering rate of the rocks they 17
comprise6, 7, 8, 9. One of the causes of this observed behaviour is specimen preparation within the 18
laboratory; the act of crushing generates sharp edges and other surface defects, and the atoms on the 19
surface associated with these features have high surface energy and contain fewer chemical bonds than the 20
atoms on defect-free surfaces, which in turn, contain fewer chemical bonds than atoms within the bulk. 21
Defect surfaces are removed during dissolution, leaving a lower energy surface that dissolves at a slower 22
rate10, 11. Knauss and Wolery6 observed that the dissolution rate of crushed albite decreased during the first 23
20 days by over an order of magnitude in all experimental conditions. Similarly, during sequential leaching 24
from 52 to 114 days, crushed UO2 samples showed progressively decreasing dissolution rates12, 13. Natural 25
4 al.14 found that crystal defects and initial crystallite size of mixed cerium-neodymium oxides influenced the 1
dissolution rate. 2
3
In order to evidence the influence of high surface energy features on the dissolution rate of UO2, CeO2 and 4
ThO2 analogues are investigated. These materials were chosen because they are isostructural to UO2 but 5
are not sensitive to changes in oxidation state of the cation. Previously, we have synthesised CeO2 and ThO2 6
to closely resemble the microstructure of SNF15, 16 therefore, we also make an assessment of how these 7
physical and structural features are likely to influence the dissolution of SNF. Using an integrated approach, 8
applying atomic force microscopy, vertical scanning interferometry, electron backscatter diffraction and 9
aqueous geochemical analysis, we determine how natural and specimen-induced high-energy surface sites 10
(grain boundaries and surface defects, respectively) contribute to measured laboratory dissolution rates. 11
Through this methodology we aim to reduce the uncertainties associated with UO2 dissolution, and thus 12
improve our understanding of the relationship between laboratory studies and the dissolution rates to be 13
expected under geological disposal conditions. 14
15
2. Experimental
16
17
2.1. CeO2 and ThO2 preparation 18
19
Cerium dioxide monoliths were prepared according to Stennett et al15. Monoliths were ground and 20
polished to a 0.05 μm finish using SiC paper and diamond paste. In order to develop a grain boundary 21
structure at the surface of some of the monoliths, thermal annealing was conducted. Monoliths were 22
heated to 1500°C at a ramp rate of 5°C min-1 and held for 1 min to develop a grain boundary texture. The 23
final microstructure (equiaxed grains ranging in size from 10 to 30 μm and randomly orientated) was in 24
good agreement with those published for UO2 and SIMFUEL17, 18. An area was masked with an inert glue to 25
act as a non-reactive reference surface of constant height during the dissolution experiments. 26
5 ThO2 powder (British Drug Houses Ltd., lot number G83757/541012) was used to prepare sintered ThO2 1
monoliths. Briefly, 1g of powder was uniaxially pressed in a 10 mm diameter hardened stainless steel die 2
with a load of 100 MPa. Monoliths were sintered for 4 h at 1750°C in a standard air atmosphere muffle 3
furnace, at a ramp rate of 5°C min-1, which gave a final density of > 94% of the theoretical density of ThO2 4
(10.00 g m-3), determined using the Archimedes method. Monoliths were ground and polished to a 0.25 μm 5
finish using SiC paper and diamond paste. It was found that a final polishing step using a 0.06 μm silica 6
colloid solution was required to obtain surfaces flat enough for analysis by Electron Back Scatter Diffraction 7
(EBSD)19. Grain boundaries were defined by heating to 1500°C at a ramp rate of 5°C min-1. The resulting 8
grains ranged in size from 5 – 30 μm, and grains were found to be randomly orientated, consistent with 9
UO2 and SIMFUEL microstructure. 10
11
2.2. Dissolution experiments 12
13
CeO2 and ThO2 are insoluble materials, hence they are difficult to dissolve without the application of 14
aggressive conditions. As such, dissolution was performed at high temperature (90 and 150°C) and in acidic 15
media. All solutions were prepared using ultra-high quality (UHQ) water (18 MΩ). The following dissolution 16
experiments were conducted: 1) annealed CeO2 and ThO2 dissolution at 90 °C in 0.01M HNO3; 2) annealed 17
CeO2 dissolution at 150 °C in 0.01M HNO3; 3) annealed CeO2 dissolution at room temperature in 0.01M, 18
0.1M, 1.5M, 3M and 15M HNO3; 4) annealed CeO2 dissolution at room temperature in a series of etching 19
solutions (72 hr in UHQ water, 15 hr in 0.001M HCl, 4 hr in 0.01M HCl); and 5) polished (i.e. not annealed to 20
define grain texture) CeO2 dissolution at 90°C and 150°C in 0.01M HNO3. 21
22
Dissolution experiments performed at 90 °C were conducted within 50 mL PTFE vessels, cleaned according 23
to the ASTM PCT standard20. A single monolith of CeO2 or ThO2 was placed into a PTFE basket within the 24
vessel, to allow contact of the whole monolith with the dissolution medium, and 40 mL of 0.01M HNO3 was 25
added. Triplicate samples and duplicate blanks (containing no monolith) were placed in a Carbolite oven at 26
6 removed for aqueous elemental analysis. One monolith from each triplicate experiment was removed for 1
surface characterisation at each sampling point, and returned to the dissolution medium after analysis. 2
Dissolution experiments performed at 150 °C were conducted in customised reactors, consisting of 3 mL 3
PTFE inserts with a PTFE lid (cleaned as above), within a sealed steel pressure vessel. These were placed 4
within a heating block, where the temperature was maintained at 150 (± 1) °C. Monoliths were placed on 5
PTFE inserts to ensure contact of the whole monolith with the dissolution medium, and 2 mL of 0.01M 6
HNO3 was added. Experiments were destructively sampled at 1, 3, 7, 21 and 35 days, at which times the 7
monoliths were subject to surface analysis and aqueous solutions were collected for elemental analysis. 8
Dissolution experiments conducted at room temperature were performed within an Atomic Force 9
Microscopy (AFM) fluid cell containing a fragment of a CeO2 monolith cut using a diamond slow saw, 10
immersed within 3 mL of reaction medium. 11
12
2.3. Surface and aqueous analysis 13
14
Monolith surfaces and cross sections were imaged using a JEOL JSM6400 Scanning Electron Microscope 15
(SEM) operating with an accelerating voltage of 15 kV and a working distance of 18 mm. Analysis of 16
crystallographic orientation was performed using Electron Backscatter Diffraction (EBSD) (Oxford 17
Instruments, Abingdon, Oxfordshire, UK) in conjunction with an FEI Sirion field emission SEM. EBSD maps of 18
100 µm2 were obtained at an accelerating voltage of 20 kV and a 0.25 µm step size, and analysed using HKL 19
Channel 5 software (Oxford Instruments). Surface topography was measured using Vertical Scanning 20
Interferometry (VSI) (Sensofar PLu2300 profilometer) using a confocal lens with 50 and 150 x magnification, 21
a numerical aperture of 0.95 and lateral and vertical resolutions of 111 nm and 1 nm, respectively. Changes 22
in surface morphology during dissolution were also measured using Atomic Force Microscopy (AFM); ex-23
situ measurements were performed using a Veeco Dimension 3100 microscope, operating in tapping mode 24
and using high aspect ratio AFM tips and in-situ measurements were conducted using a Digital Instruments 25
Multimode / Nanoscope IIIa in contact mode. Aqueous elemental analysis of Ce was undertaken by 26
7 of Th was performed using high resolution ICP-MS (Element 2, ThermoScientific). Prior to analyses, all 1
samples were acidified with 20 μL concentrated HNO3 to keep all elements dissolved in solution. Solution 2
data are expressed as the normalised elemental leaching NL(Ce, Th) (g m-2) according to: 3
4
𝑁𝐿(𝐶𝑒, 𝑇ℎ) =𝑚𝑆/𝑉𝐶𝑒,𝑇ℎ (Eqn. 1)
5
6
where mCe, Th is the total amount of Ce or Th released into solution and S/V is the surface area to volume 7
ratio. The normalised element leaching rate RL(Ce, Th) (g m-2 d-1) is determined by: 8
9
𝑅𝐿(𝐶𝑒, 𝑇ℎ) =𝑚𝑆𝐶𝑒,𝑇ℎ 𝑉×∆𝑡
(Eqn. 2) 10
where Δt is the leaching time in days. 11
12
3. Results
13
14
3.1. CeO2 and ThO2 dissolution rate 15
16
The aqueous dissolution rate data derived from all experiments are given in Table 1. The dissolution rate 17
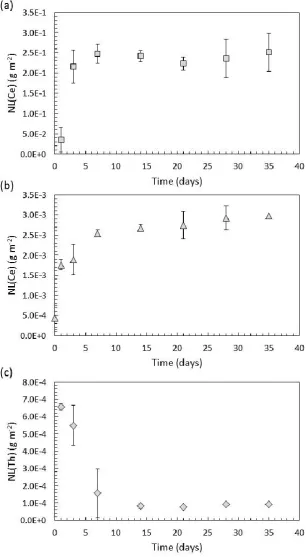
for CeO2 dissolved at 150°C was (6.34 ± 0.1) x 10-3 g m-2 d-1; data are shown in Figure 1a. The initial 18
dissolution rates, between 0 to 7 days, appeared to be more rapid than between 7 and 35 days (Fig. 1a), 19
which may be due to solution saturation effects. Under the same dissolution conditions, but at 90°C, the 20
dissolution rate was significantly lower, at (7.26 ± 0.2) x 10-5 g m-2 d-1, but the same trend was found, with 21
an initial, rapid dissolution followed by a slower dissolution from 7 to 35 days (Fig. 1b, Table 1). Dissolution 22
of ThO2 exhibited very different behaviour to that of CeO2, as shown in Figure 1c. At 90°C, the dissolution 23
was initially rapid (between 0 and 7 days, Fig. 1c) at rate of (6.71 ± 0.5) x 10-5 g m-2 d-1, but subsequently, 24
the dissolution rate significantly decreased, giving an overall rate between 0 and 28 days of (5.23 ± 0.1) x 25
10-7 g m-2 d-1 (Table 1). Rapid dissolution could result from the release of material from high energy surface 26
8 amorphous ThOx(OH)y·H2O or even polynuclear Thx(OH)y species form. These amorphous phases are known 1
to be capable of re-crystallising; for example, Rai et al.21 showed that ThO2(am) converted to crystalline 2
ThO2(cr) upon heating at 90 °C in acidic solution. Therefore, crystalline ThO2 may be able to form a 3
protective layer on the surface of ThO2, providing a barrier to further dissolution and giving rise to the 4
dissolution behaviour observed in Figure 1c. 5
[image:8.595.156.441.263.374.2]6
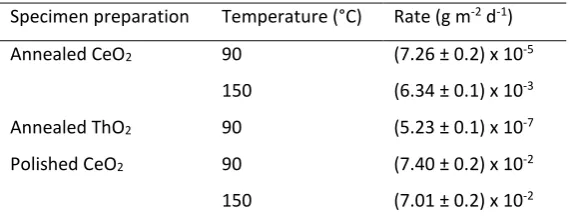
Table 1. Dissolution rates for CeO2 and ThO2 samples dissolved in 0.01M HNO3 as a function of specimen preparation
7
and temperature. Errors given are the standard deviation of triplicate experiments. 8
9
Specimen preparation Temperature (°C) Rate (g m-2 d-1)
Annealed CeO2 90 (7.26 ± 0.2) x 10-5
150 (6.34 ± 0.1) x 10-3
Annealed ThO2 90 (5.23 ± 0.1) x 10-7
Polished CeO2 90 (7.40 ± 0.2) x 10-2
150 (7.01 ± 0.2) x 10-2
9 1
Figure 1. Normalised mass loss data for CeO2 and ThO2 dissolved in 0.01M HNO3:(a)annealed CeO2 at 150°C; (b)
2
annealed CeO2 at 90°C; and (c) annealed ThO2 at 90°C. Errors given are the standard deviation of triplicate
3
experiments. Corresponding dissolution rates are shown in Table 1. 4
5
6
[image:9.595.144.451.63.621.2]10 3.2. Grain boundaries
1
2
Grain boundaries are a well-known feature of SNF; they typically contain volatile fission products (e.g. Cs 3
and I) and alloy particles of Mo, Tc, Ru, Rh and Pd22. The presence of these highly radioactive elements 4
necessitates a careful understanding of how grain boundaries behave during dissolution, and an evaluation 5
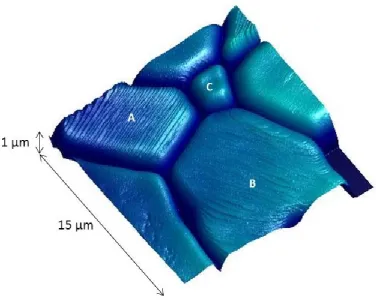
of their contribution to the dissolution rate of spent fuel. Figure 2 shows the typical microstructure 6
obtained for CeO2; annealing conditions were optimised to give grain boundary depths of < 1 μm. 7
8
9
Figure 2. AFM image of CeO2 surface, showing grains, grain boundaries, pores and facets. The labels A, B and C
10
correspond to detailed analysis of grain facets, where A shows facets generated through the intersection of {665}/{-11
111} planes, B shows facets generated through the intersection of {111}/{-111} planes, and C shows no facets. 12
13
The contribution of grain boundary dissolution to the overall dissolution rate of CeO2 and ThO2 was 14
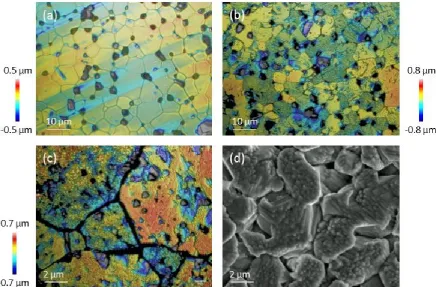
investigated in 0.01M HNO3 at 90°C, and also at 150°C for CeO2. Figure 3 shows VSI images of CeO2 before 15
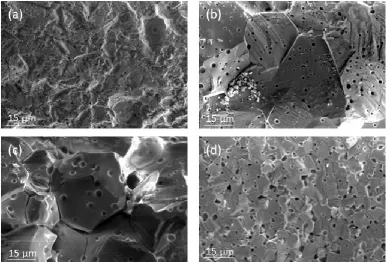
dissolution (Fig. 3a) and after 3 and 7 days of dissolution at 150 °C (Figs. 3b and 3c, respectively). It was 16
[image:10.595.104.481.272.572.2]11 After 7 days, grain boundaries were preferentially dissolved, up to a depth of at least 0.70 μm and the 1
surface of the grains became rough and pitted (Fig. 3c). Some of the grains dissolved at different rates, as 2
evidenced by the height contrast in different grains (Fig. 3b-c). In their analysis of CaF2 dissolution 3
(isostructural to CeO2, ThO2 and UO2) Godinho et al.23 showed that the measured retreat rates of CaF2 4
grains depended upon the crystallographic orientation of the exposed planes. They concluded that the 5
{111} plane is the most stable and dissolved most slowly, while the {112} plane was the least stable, 6
dissolving up to 33 times faster than {111}. First principles calculations have shown that the surface stability 7
of CeO2, from the most to the least stable plane is in the order of {111} > {110} > {100} 24, 25, although it 8
should be noted that the {100} plane in such calculations is modelled and not real, due to the difficulties 9
associated with modelling the dipolar {100} plane. The results presented here are in agreement with these 10
findings; EBSD analysis of the grains in Fig. 3c showed that the most stable grain had a (111) surface. 11
12
Figure 3. Vertical scanning interferometer and SEM images of CeO2 surfaces (a) prior to dissolution and following
13
dissolution for (b) 3 days, (c) 7 days and (d) 21 days in 0.01M HNO3 at 150 °C.
14 15
Figure 3d shows an SEM image of CeO2 after 21 days of dissolution. The grains became entirely detached 16
[image:11.595.79.519.351.638.2]12 compared to an initial size of 10 – 30 μm). The images in Figure 3 indicate that dissolution occurs 1
preferentially along the grain boundaries, such that intergranular bonding becomes weakened with 2
ongoing dissolution, eventually resulting in grain boundary decohesion. It is notable that the detached 3
grains in Figure 3d exhibit triangular facets, indicative of {111} plane terminations, suggesting that surfaces 4
which dissolve more slowly are the most stable, and persist during dissolution. Evidence for grain boundary 5
decohesion in CeO2 under these dissolution conditions was confirmed by SEM analysis of monoliths in cross 6
section, with the surface of the grain just above the field of view. Figure 4a shows the cross section of a 7
pristine, annealed sample of CeO2. Grain boundaries were not observed in the top ~60 μm of the cross 8
section. Monoliths of CeO2 that experienced dissolution for several durations are shown in Figures 4b-d. 9
After 7 days, grains and grain boundaries were clearly visible (Fig. 4b), and after 14 days entire grains 10
appeared to become separated from one another (Fig. 4c). After 21 days of dissolution, the grains 11
decreased considerably in size to ~ 5 μm, in agreement with the surface topography shown in Figure 3d. It 12
is surprising that the material appeared to retain cohesion although the grains appeared to reduce in size 13
(Fig. 4d); close inspection reveals that the grains were fractured between pores, giving rise to apparently 14
smaller grains. These data confirm that grain boundary dissolution in CeO2 is extensive, and that grain 15
boundaries may act as conduits for solution ingress, leading to dissolution and fracturing between pores. 16
This process is expected to contribute substantially to the overall dissolution rate. 17
13 1
Figure 4. SEM images of cross sections through CeO2, with the surface of the sample just above the top of each image:
2
(a) non-dissolved, annealed CeO2; and CeO2 dissolved in 0.01M HNO3 at 150°C for (b) 7 days; (c) 14 days and (d) 21
3
days. 4
5
Analysis of the CeO2 sample used to provide solution data at 90°C, shown in Fig. 1b, was performed using 6
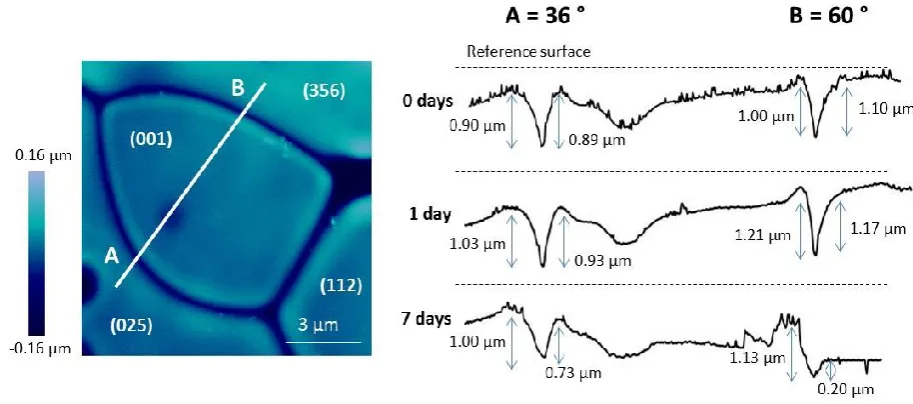
AFM and EBSD. Figure 5 shows the boundaries between several grains of different crystallographic 7
orientation, including grain boundary 'A' between surfaces of (025) and (001), and grain boundary 'B' 8
between surfaces of (001) and (356). EBSD analysis of these boundaries gave mean misorientation angles of 9
36.01° and 59.84°, respectively (Table 2). The dissolution of these boundaries was monitored over a period 10
of 7 days (after which the surface became too rough to accurately measure) with reference to an inert 11
surface mask of constant height. The mean surface retreat rates were measured as 0.001 nm d-1, 0.032 nm 12
d-1 and 5.954 nm d-1 for the (025), (001) and (365) surfaces, respectively, indicating surface stability in the 13
14 1
Figure 5. Atomic force microscopy image and cross sections of CeO2 grains, with grain boundaries of low (A) and high
2
(B) misorientation angles. Grain surfaces are measured against an inert reference surface of constant height. Cross 3
sections show change in depth of the grain boundaries and grain surfaces with time, during dissolution at 90 °C in 4
0.01M HNO3.
5
6
The retreat rates of CeO2 grain boundaries were greater than the surface retreat rates between 0 and 1 7
days, and the retreat rate was different in different grain boundaries. Between 0 and 1 days of dissolution, 8
the measured retreat of grain boundary A was 0.13 µm on the (025) aspect and 0.04 µm on the (001) 9
aspect (Fig. 5). Grain boundary B retreated more rapidly, increasing in depth by 0.21 µm on the (001) 10
aspect, and 0.07 µm on the (356) aspect (Fig. 5). Grain boundaries became deeper during dissolution, 11
suggesting the removal of material from within. Furthermore, the dissolution was greatest for the high 12
misorientation angle boundary, compared to the low misorientation angle grain boundary, giving grain 13
boundary retreat rates of 0.017 µm d-1 and 0.014 µm d-1, respectively (Table 2). After 7 days of dissolution, 14
grain boundaries appeared to become shallower as a result of enhanced grain surface retreat at this time, 15
especially for grain boundary B where the (356) surface dissolved very rapidly (Fig. 5). In summary, when 16
CeO2 samples were contacted with the dissolution medium, a rapid loss of material from grain boundaries 17
occurred, which is in agreement with the enhanced release of Ce into solution during this time (Fig. 1a). 18
Subsequently, surface retreat rates increased and the surface, or matrix, dissolution became the dominant 19
15 dissolution was less rapid after 7 days, confirming that grain boundary dissolution contributes significantly 1
to the initial dissolution rate, while surface controlled dissolution leads to slower dissolution rates. 2
3
Similar experiments were conducted to monitor the dissolution of ThO2 grain boundaries as a function of 4
crystallographic orientation and grain boundary misorientation (Table 2). The dissolution behaviour of ThO2 5
grain boundaries at 90°C in 0.01M HNO3 was comparable to that of CeO2, whereby grain boundaries 6
preferentially dissolved and boundaries withhigh misorientation angles retreated more rapidly than those 7
with low misorientation angles. For example, a grain boundary between two grains with (103) and (506) 8
surfaces had a misorientation angle of 23.91° and a retreat rate of 0.007 µm d-1, while another grain 9
boundary formed between grains with (416) and (506) surfaces with a mean misorientation angle of 56.05° 10
gave a retreat rate of 0.357 µm d-1, more than twice that of the lower misorientation angle grain boundary 11
(Table 2). It should be noted that after 7 days of dissolution it was no longer possible to measure grain 12
boundaries in ThO2 due to the presence of a surface layer, giving further evidence to the hypothesis 13
discussed above, that a dissolution rate drop after 7 days (Fig. 1c) is due to the formation of a protective 14
layer that results from the transformation of amorphous ThOx(OH)y·H2O to ThO2(cr) precipitates. 15
[image:15.595.59.536.515.616.2]16
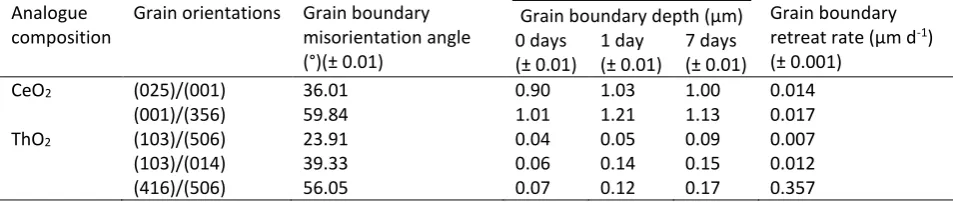
Table 2. Grain boundary depths of CeO2 (corresponding to Figure 5) and ThO2 grains with different grain orientations
17
and grain boundary misorientation angles, as a function of time during dissolution in 0.01M HNO3 at 90 °C.
18
Analogue composition
Grain orientations Grain boundary misorientation angle (°)(± 0.01)
Grain boundary depth (µm) Grain boundary retreat rate (µm d-1)
(± 0.001) 0 days
(± 0.01) 1 day (± 0.01)
7 days (± 0.01)
CeO2 (025)/(001) 36.01 0.90 1.03 1.00 0.014
(001)/(356) 59.84 1.01 1.21 1.13 0.017
ThO2 (103)/(506) 23.91 0.04 0.05 0.09 0.007
(103)/(014) 39.33 0.06 0.14 0.15 0.012
(416)/(506) 56.05 0.07 0.12 0.17 0.357
19
3.2. Surface facets 20
21
Surface facets comprising flat terraces separated by inclined steps were found on annealed grains of CeO2 22
(Fig. 2). These features were not identified on ThO2 as a result of the greater surface roughness, which 23
16 orientations arising from the facetted surfaces, however alternative geometric measurements were used to 1
determine the orientation of the facet features. By measuring the angle, θ, between the facet and the 2
surface, the best combination of planes can be found according to Maldonado et al.25: 3
4
𝜃 = 𝑎𝑟𝑟𝑐𝑜𝑠(|𝑢⃗⃗ ||𝑣⃗ |𝑢⃗⃗ ∙𝑣⃗ ) (Eqn. 3) 5
6
Where 𝑢⃗ and 𝑣 are the normal vectors that define the planes. Godinho et al.23 showed that a dissolution 7
surface is only made of the most stable planes, as the less stable ones are more prone to dissolution. 8
Therefore, if we assume only the most stable planes are present at the surface, this method allows the 9
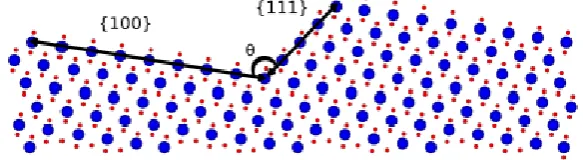
unambiguous definition of the intersection of two distinct planes. Figure 6 illustrates this concept, showing 10
the lateral view of a hypothetical surface comprised of two planes. These planes are the {111} and {100} 11
planes which intersect forming a facet with an angle θ = 70.52/109.48 °. 12
[image:16.595.147.439.418.498.2]13
Figure 6. Lateral view of a hypothetical CeO2 surface (large blue dots are O, small red dots are Ce), composed of the
14
{100} and {111} surfaces, intersecting at an angle, θ of 70.52/109.48° (rendered by VESTA). 15
16
Several different planar orientations of surface facets were observed. Grain 'A' in Figure 2 exhibited 17
regularly stepped facets across the surface of the grain, while Grain 'B' developed facets that increased in 18
height from the centre of the grain to the edge. According to den Brok and Morel26, these ridge and valley 19
features result from elastic strain released during annealing, lowering the surface energy. Some grains, for 20
example, Grain 'C' (Fig. 2), showed no facets. The facets on Grain 'A' enclosed an angle of 106.83 ± 2.1 °, 21
indicative of a {665}/{-111} plane intersection, which is known to have an angle of 107.04 °. The height of 22
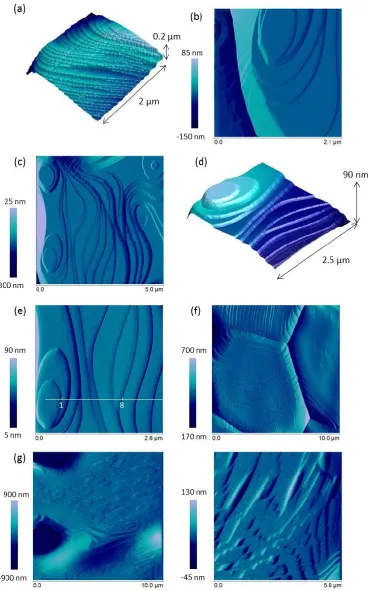
17 separated by distances of 5.74 nm. The facets on Grain 'B' (Fig. 1) had planar orientations that met at an 1
angle of 110.33 ± 1.6 °, indicative of a {111}/{-111} facet orientation, which has a known angle of 109.47 °. 2
These facets ranged in height from 1.50 nm to 6.61 nm and had flat terraces of 24.06 nm (or multiples 3
thereof). These {111}/{-111} facets were themselves facetted, giving rise to a "zig-zag" edge, as shown in 4
Fig. 7a. These "mini-facets" were found to be perpendicular to the {-111} plane, suggestive of the plane 5
{511}. The facet structures were also observed to extend into the grain boundaries (Fig. 7b). Figures 7b - e 6
show detailed AFM images of another grain, which exhibited a ridge and valley-like morphology, with 7
stacked concentric facets, building ridges at the grain edges (giving rise to the "tooth-shaped" grains shown 8
in AFM profiles in Fig. 5) and flat valleys in the centre of the grain. The difference in height between the 9
ridges and valleys for this grain was up to 150.36 nm. The facet heights ranged from 2.50 nm to 58.04 nm, 10
were unevenly spaced at distances <20.02 nm and enclosed an angle 125.43 ± 0.7 °. This is indicative of a 11
{111}/{100} planar orientation, which has a known angle of 125.26 °. It can be noted that that all of the 12
18 1
Figure 7. Atomic Force Microscopy images depicting surface features of CeO2 spent nuclear fuel analogue surfaces; (a)
2
showing {-211} microfacets perpendicular to the plane {-111}; (b) facet structures extending into grain boundaries; (c) 3
ridge and valley structure formed by intersecting {111}/{100} planes; (d and e) intersecting {111}/{100} planes showing 4
cross section for step height measurements in Table 3; (f) {-211}/{-111} surface facets following dissolution in 15M 5
nitric acid at room temperature; and (g and h) etch pattern formed on previously smooth grains following etching in a 6
series of media (UHQ water for 72 hr, 0.001M for 15 hr and 0.01M HCl for 4hr) at room temperature. Images (a), (g) 7
19 In order to understand the dissolution of the CeO2 surface facets, samples were subjected to high acidity 1
(pH <2) dissolution experiments. The surface shown in Figures 7b - e was subject to dissolution at room 2
temperature in increasing concentrations of nitric acid, representing increasingly aggressive dissolution 3
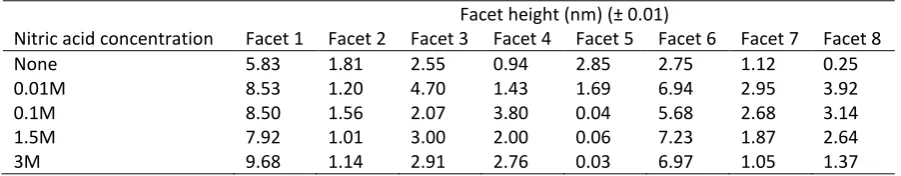
conditions. The resulting facet height measurements, corresponding to the facets between point 1 and 4
point 8, shown in Figure 7e, are given in Table 3. It is clear that the addition of just 0.01M HNO3 resulted in 5
a significant increase in height for most facets, compared to the height prior to dissolution. Facet height 6
increases ranged between 1.30 nm and 3.91 nm. Two facets were observed to become shallower (facets 2 7
and 5, Table 3). With increasing acidity between 0.1M and 3M HNO3, facet height change was variable, with 8
some facets showing little change (Table 3), while others decreased in height and others increased 9
(suggesting addition of material to facets). This variability suggests that these surface sites are highly 10
dynamic, changing in response to the reaction medium, but with little observable trend. However, it is clear 11
that upon initial immersion in the reaction medium, instantaneous dissolution of the facets occurred. 12
[image:19.595.73.524.424.512.2]13
Table 3. Facet heights measured from Figure 2c as a function of HNO3 molarity.
14
Facet height (nm) (± 0.01)
Nitric acid concentration Facet 1 Facet 2 Facet 3 Facet 4 Facet 5 Facet 6 Facet 7 Facet 8
None 5.83 1.81 2.55 0.94 2.85 2.75 1.12 0.25
0.01M 8.53 1.20 4.70 1.43 1.69 6.94 2.95 3.92
0.1M 8.50 1.56 2.07 3.80 0.04 5.68 2.68 3.14
1.5M 7.92 1.01 3.00 2.00 0.06 7.23 1.87 2.64
3M 9.68 1.14 2.91 2.76 0.03 6.97 1.05 1.37
15
16
To investigate the effect of dissolution on the {511} micro-facets perpendicular to the {-111} plane (Grain 17
'B', Fig. 2 and Fig. 7a) a grain with these features was subject to dissolution in a 15 M HNO3 solution at room 18
temperature. The resulting surface is shown in Figure 7f. The effect of dissolution was increased micro-19
facetting in the {511} plane. Even under these aggressive conditions it was not possible to see any change in 20
the smooth grains, therefore the samples were etched in a series of media for a prolonged period (72 hr in 21
UHQ water, 15 hr in 0.001M HCl and 4 hr in 0.01M HCl) at room temperature. The resulting AFM images 22
show that the smooth grain became highly etched, forming "zig-zag" features and triangular points (Figs. 7g 23
20 Triangular facets have been observed previously in etched CaF2 27, forming lightening-shaped arrangements 1
of intersecting (101) and (110) facets. 2
3
3.3. Surface treatment 4
5
High energy surface sites may also be induced through specimen preparation, leading to over-estimated 6
laboratory dissolution rates. Surfaces of CeO2 were polished to a 0.05 μm finish and subject to dissolution 7
at 150°C in 0.01M HNO3. Dissolution data were compared to those for annealed surfaces. Figure 8 shows 8
VSI images of the surface of a polished monolith after 3 and 14 days of dissolution (Fig 8a-b, respectively). 9
During initial dissolution, the surfaces were rough and pitted, and after 14 days exhibited areas of high and 10
low topography, indicating further dissolution had occurred. It was found that the dissolution rate was an 11
order of magnitude greater for the polished surface than for an annealed CeO2 surface under the same 12
conditions (Table 2). At 90°C the effect was similar, however the dissolution rate of the polished surface 13
was found to be 3 orders of magnitude greater than an annealed surface, with rates of (7.40 ± 0.2) x 10 -14
2 g m-2 d-1 and (7.26 ± 0.2) x 10-5 g m-2 d-1 for polished and annealed surfaces, respectively (Table 1). 15
[image:20.595.189.411.460.737.2]16
Figure 8. Polished CeO2 surfaces after dissolution in 0.01M HNO3 at 150°C for (a) 3 days; and (b) 14 days.
17
21
4. Discussion
1
2
In the results presented above, we have observed that surface features act as energetically reactive surface 3
sites that transform during dissolution. These features can be classified into two categories: i) natural 4
surface features, i.e. grain boundaries; and ii) specimen preparation-induced features, i.e. surface facets 5
and polishing defects. The dissolution of these features in CeO2 and ThO2 is discussed below, with 6
comparison to the dissolution behaviour of UO2. It should be noted that while the chemical and redox 7
characteristics of the analogue materials investigated here are simple compared to those of spent fuel, it is 8
possible to draw comparisons between CeO2, ThO2 and spent fuel that focus only on the physical and 9
structural properties that give rise to the dissolution behaviour observed. As such, in the discussion that 10
follows, only microstructural surface features that affect dissolution are described, with a cautious 11
interpretation for the overall behaviour of spent fuel during dissolution. 12
13
4.1 Grain boundary dissolution 14
15
The results presented in this investigation give evidence that UO2 and spent nuclear fuel analogue grain 16
boundaries undergo extensive transformation during dissolution; material is rapidly removed from grain 17
boundaries in both CeO2 and ThO2, corresponding to rapid initial dissolution rates. It is hypothesised that 18
grain boundaries are effective sinks for atomic defect high energy sites28; the greater the number of 19
defects, the greater the proportion of high energy surface sites for dissolution. In CeO2, it has been shown 20
that increasing the density of oxygen vacancy defects results in an increase in the dissolution rate. For 21
example, Horlait et al. 29, 30 showed that for every 10% of Ln3+ cations added to CeO2, for which charge 22
compensation through the formation of Ce3+ occurred, the dissolution rate increased by 1 order of 23
magnitude28. Hojo et al.31 demonstrated an enrichment of Ce3+ in grain boundaries compared to the grain 24
surfaces, indicative of a higher density of oxygen vacancy defects within the grain boundaries compared to 25
the surface. In UO2, evidence for defects within grain boundaries is found in the form of non-stoichiometric 26
22 dissolution of UO2, while O'Neil et al.17 made the observation that grain boundaries in UO2 were highly 1
conductive, which was attributed to a high concentration of oxygen interstitial ions arising from hypo-2
stoichiometric UO2+x. This suggests that defects, and especially those that are concentrated within grain 3
boundaries, may play a key role in the dissolution of UO2 and its analogues. In spent fuel, grain boundaries 4
are expected to contain more defects than laboratory-prepared UO2 or UO2 analogues, primarily due to the 5
accumulation of fission gas bubbles and metallic precipitates33, therefore the effects of such high energy 6
surface sites might be expected to be greater. 7
8
We have observed that crystallographic orientation of the grains plays an important role in the dissolution 9
of the grain boundaries of spent nuclear fuel analogues; grain boundaries with a high misorientation angle 10
were found to dissolve more rapidly than those with a low misorientation angle in the current study. We 11
hypothesise that high misorientation grain boundaries have a higher concentration of defects (or defect 12
clusters) than grain boundaries with low misorientation angles. Indeed, simulations of UO2 grain boundaries 13
have shown that different types of defect structure were present in grain boundaries, depending on the 14
misorientation angle34; in grain boundaries with lower misorientation angles edge dislocations were the 15
most common defect, while in higher misorientation angle boundaries oxygen point defects dominated the 16
grain boundary structure. 17
18
Assessment of the safety of geological disposal of spent nuclear fuel requires detailed information on the 19
rates and mechanism of release of radionuclides. This is hypothesised to occur in two main stages: ii) the 20
so-called "instant release fraction" (IRF), which represents a rapid release of long-lived and geochemically 21
mobile radionuclides (e.g. 129I, 36Cl, 135Cs, 99Tc); and ii) the slow, long-term release of radionuclides from the 22
UO2 matrix35, 36. The IRF is considered to come from two regions of the spent fuel; the gap between the 23
cladding and the fuel, and the grain boundaries. However, the IRF rates are still largely unknown, and the 24
contribution of grain boundary dissolution is not fully understood; in fact there is some controversy in the 25
literature as to whether grain boundaries make any significant contribution to the IRF36, 37. The results 26
23 spent fuel analogues, which is directly linked to grain boundary dissolution, support the hypothesis that 1
grain boundaries contribute to the IRF in spent fuel, and suggest that crystallographic direction of the grains 2
and the density of defects within the grain boundary may play a role. However, it should be noted that the 3
IRF of spent fuel is largely governed by the complicated chemical composition of the grain boundaries; 4
therefore the extent to which structural defects and grain boundary misorientation between adjacent 5
grains contributes to the IRF is unknown in comparison to the chemical effects. Our results are also in 6
agreement with the hypothesis that a second, slower stage of spent fuel dissolution occurs; in both CeO2 7
and ThO2, dissolution rates were lower after the initial release. In ThO2 it was apparent that this second 8
stage of dissolution was impeded by the formation of a protective layer. A similar effect was found in 9
laboratory UO2 dissolution experiments, where secondary U-bearing alteration products formed a 10
protective layer, preventing further dissolution38. On the basis of the data and arguments presented here, it 11
is evident that grain boundary dissolution in spent fuel and spent fuel analogues requires further detailed 12
chemical and physical analysis and that geological disposal safety performance assessment should carefully 13
consider the contribution of grain boundaries to the dissolution rate. 14
15
16
4.2 Dissolution of specimen preparation-induced features 17
18
We show that dissolution occurs at facet edges, especially during initial contact with dissolution medium. 19
With increasingly aggressive dissolution media, the dissolution of these features does not show a particular 20
trend, but instead appears to experience a dynamic process, whereby facet heights constantly change in 21
response to the dissolution medium. We have also shown that each facet contains some aspect of the {111} 22
plane, which is the most stable plane in fluorite-type structures, suggesting that crystallographic 23
orientation also plays an important role in facet formation. 24
25
It is thought that facets form by a dislocation growth mechanism during annealing, where spiral-like 26
24 Each dislocation produces a step as it emerges at the surface39, 40. O'Neil et al.17 and He and Shoesmith40 1
described similar surface morphologies to those identified in the current study in UO2. Current-sensing AFM 2
analysis showed that UO2 grains with facets were highly conducting, while smooth grains were not. Raman 3
and EDX investigation of these features revealed a high degree of non-stoichiometry in the UO2 of facetted 4
grains, attributed to the incorporation of interstitial oxygen atoms to locations in the {110} direction, 5
accompanied by shifts in vacant sites in the {111} direction. It was concluded that these non-stoichiometric, 6
defect-containing features would be more vulnerable to dissolution than defect-free surfaces. Further 7
investigations are currently underway to understand the relative stability of different facet orientations, 8
their degree of non-stoichiometry and defect structures. It is clear that these high energy surface sites play 9
a role in dissolution, but the evidence presented here suggests that the influence on dissolution rate is not 10
as significant as that of grain boundaries. It is important to note that these features are present as a result 11
of specimen preparation and annealing, thus are likely to contribute to the potential over-estimation of 12
dissolution rates in the laboratory. These features are not expected to be present in spent nuclear fuel. 13
14
We found that polished surfaces of spent nuclear fuel analogues gave dissolution rates of up to three 15
orders of magnitude greater than for annealed surfaces. Polishing has been shown to introduce strain and 16
defects into oxide material surfaces, giving rise to high surface energy. For example, diamond paste 17
polishing has been shown to result in the formation of dislocation loops, other lattice defects and also high 18
surface strain41, 42. Thermally annealing the surface of CeO2 allowed the strain and defects to be relaxed due 19
to recovery processes during heating, lowering the surface energy, and thus lowering the dissolution rate. It 20
is possible that defects induced during polishing may act as nucleation sites for the observed facet 21
structures formed during annealing. These results show that the introduction of defects to the surface 22
through polishing can lead to a significant increase in the observed dissolution rate, demonstrating the 23
importance of careful specimen preparation for dissolution rate determination. 24
25
26
25
5. Conclusions
1
2
Dissolution experiments were conducted on non-redox sensitive, isostructural UO2 and SNF analogues, 3
CeO2 and ThO2 to investigate the contribution of energetically reactive surface sites to dissolution, and to 4
determine whether their presence may lead an over-estimation of dissolution rates. Grain boundaries, 5
which are part of the natural texture of SNF, were shown to significantly enhance the dissolution rate, 6
dissolving preferentially in the initial stages of dissolution, supporting hypotheses that grain boundaries 7
contribute to the instant release fraction of spent fuel. A strong crystallographic control was exerted, with 8
high misorientation grain boundaries dissolving more rapidly than those with low misorientation angles in 9
both CeO2 and ThO2. It was hypothesised that different crystallographic directions can accommodate 10
different densities of defects, explaining the observations found. Further investigation is required to 11
ascertain the extent to which structural defects and grain boundary misorientation between adjacent 12
grains contribute to the instant release fraction of SNF, in comparison to the chemical effects. 13
14
In addition to the natural high energy surface sites found in grain boundaries, energetically reactive sites 15
were also found to be formed through sample preparation. Facet structures formed during annealing, likely 16
nucleated on defects sites on polished surfaces, also exhibited a strong crystallographic control (all 17
combined some aspect of the {111} plane), and upon introduction to dissolution media, they experienced 18
instantaneous dissolution. Finally, the effect of surface polishing on the dissolution rate was found to 19
increase dissolution rates by up to three orders of magnitude. This results from induction of strain and 20
defects in the surface during the polishing process. We have shown that defects induced through sample 21
preparation contribute to the dissolution rate; the dissolution from facets is low, therefore not likely to 22
significantly over-estimate long-term dissolution rates, however sample polishing without any further 23
treatment is likely to cause over-estimation of dissolution rates. 24
25
26
26
Acknowledgements
1
The research leading to these results has received funding from the European Atomic Energy Community's 2
Seventh Framework Programme (FP7) under grant agreement No. 269903, The REDUPP (REDucing 3
Uncertainty in Performance Prediction) project. Special thanks to J. Godinho for assistance with vertical 4
scanning interferometry. We are grateful to Dr. Virginia Oversby and Dr. Lena Z. Evins for invaluable 5
discussion and support throughout the project. CLC is grateful to The University of Sheffield for the award 6
of a Vice Chancellor's Fellowship, NCH acknowledges support from the Royal Academy of Engineering and 7
the Nuclear Decommissioning Authority for funding and DJB and SMT acknowledge financial support from 8
the EPSRC Nuclear FiRST Doctoral Training Centre (EP/G037140/1). We are grateful to the anonymous 9
reviewers of this contribution, for their insightful comments and suggestions, which have greatly improved 10
the manuscript. 11
12
13
14
15
16
17
18
19
20
21
22
23
24
25
26
27
References
1
(1) Oversby V. M. Uranium dioxide, SIMFUEL and Spent Fuel Dissolution Rates – A Review Of Published 2
Data. SKB Tech. Rep.1999, TR-99-22. 3
(2) Shoesmith D. W. Used Fuel and Uranium Dioxide Dissolution Studies – A Review. Nucl. Waste Manag. 4
Org. Rep.2007, NMWO TR-2007-03.
5
(3) Fuel and Canister Process Report for the Safety Assessment SR-Site. SKB Tech. Rep.2010, TR-10-46. 6
(4) Smellie J.; Karlson F. A Reappraisal of some Cigar Lake Issues of Importance to Performance Assessment. 7
SKB Tech. Rep.1996, TR 96-08.
8
(5) Gauthier-Lafaye F.; Holliger P.; Blanc P. L. Natural Fission Reactors in the Franceville Basin, Gabon: A 9
Review of the Conditions and Results of a “Critical Event” in a Geologic System. Geochim. Cosmochim. Acta. 10
1996,60, 4831 – 4852. 11
(6) Knauss P.; Wolery T. J. Dependence of Albite Dissolution Kinetics on pH and Time at 25°C and 70°C. 12
Geochim. Cosmochim. Acta. 1986, 50, 2481 - 2497.
13
(7) White A. F.; Bullen T. D.; Schulz M. S.; Blum A. E.; Huntington T. G.; Peters N. E. Differential Rates of 14
Feldspar Weathering in Granitic Regoliths. Geochim. Cosmochim. Acta. 2001, 65, 847 - 867. 15
(8) White A.F.; Brantley S.L. The effect of Time on the Weathering of Silicate Minerals: Why do Weathering 16
Rates Differ in the Laboratory and Field? Chem. Geol.2003, 202, 479 - 506. 17
(9) Zhu C.; Veblen D. R.; Blum A. E.; Chipera S. J. Naturally Weathered Feldspar Surfaces in the Navajo 18
Sandstone Aquifer, Black Mesa, Arizona: Electron Microscopic Characterisation. Geochim. Cosmochim. Acta. 19
2006, 70, 4600 - 4616. 20
(10) Brantley S. L.; Crane S. R.; Creear D.; Hellmann R.; Stallard R. Dissolution at Dislocation Edge Pits in 21
Quartz. Geochim. Cosmochim. Acta.1986, 50, 2349 - 2361. 22
(11) Blum A. E; Lasaga A. C. Monte Carlo Simulations of Surface Reaction Rate Laws. In: Stumm W. (Ed.) 23
Chemical Weathering Rates of Silicate Minerals. Mineralogical Society of America 1987, 31, 291 - 351. 24
(12) Ollila K.; Oversby V. M. Dissolution of Unirradiated UO2 and UO2 Doped with 233U Under Reducing 25
Conditions. SKB Tech. Rep. 2005 TR-05-07. 26
(13) Ollila K. Dissolution of Unirradiated UO2 and UO2 Doped with 233U in 0.01M NaCl Under Anoxic and 27
Reducing Conditions. Posiva Oy Report2006 2006-08. 28
(14) Claparede L.; Clavier N.; Dacheux N.; Moisy N.; Podor R.; Ravaux J. Influence of Crystallisation State and 29
Microstructure on the Chemical Durability of Cerium-Neodymium Mixed Oxides. Inorg. Chem. 2011, 50, 30
9059 - 9072. 31
(15) Stennett M. C.; Corkhill C. L.; Marshall L. A.; Hyatt N. C. Preparation, Characterisation and Dissolution of 32
a CeO2 Analogue for UO2 Nuclear Fuel. J. Nucl. Mater.2013, 432, 182 - 188. 33
(16) Evins L. Z.; Juhola P.; Vahanen M. REDUPP Final Report. Posiva Oy Report2014 2014-12. 34
28 (17) O'Neil K. D.; He H.; Keech P.; Shoesmith D. W.; Semenikhin O. A. Anisotropy of Local Conductivity of 1
Hyper-Stoichiometric Uranium Dioxide Revealed by Current-Sensing Atomic Force Microscopy (CS-AFM). 2
Electrochem. Commun.2008, 10, 1805 - 1808.
3
(18) Lucuta P. G.; Verall V. R.; Maztke Hj.; Palmer B. J. Microstructural Features of SIMFUEL – Simulated 4
High-Burnup UO2-Based Nuclear Fuel. J. Nucl. Mater. 1991, 178, 48 - 60. 5
(19) Papin P.; Chen C-F.; Forsyth R.; Luther E.; Necker C. Surface Preparation for Characterising 6
Microstructure on Transuranic Oxides by Electron Backscatter Spectroscopy and Ion Beam Imaging. 7
Microsc. Microanal.2012, 18, 708.
8
(20) ASTM Standard Test Methods for Determining Chemical Durability of Nuclear, Hazardous and Mixed 9
Waste Glasses and Multiphase Ceramics: The Product Consistency Test (PCT). ASTM C 1285-02, American 10
Society for Testing and Materials, Philadelphia (2008). 11
(21) Rai D.; Moore D. A.; Oakes C. S.; Yui M. Thermodynamic Model for the Solubility of Thorium Dioxide in 12
the Na-Cl-OH-H2O System at 23°C and 90°C. Radiochim. Acta.2000, 88, 297 - 306. 13
(22) Cui D.; Low J.; Spahiu K. Environmental Behaviours of Spent Nuclear Fuel and Canister Materials. 14
Energy. Environ. Sci.2011, 4, 2537 - 2545.
15
(23) Godinho J.; Piazolo S; Evins L. Z. Effect of Surface Orientation on Dissolution Rates and Topography of 16
CaF2. Geochim. Cosmochim. Acta. 2012, 86, 392 - 403. 17
(24) Yang Z.; Woo T. K.; Baudin M.; Hermannsson K. Atomic and Electronic Structure of Unreduced and 18
Reduced CeO2 Surfaces: A First-Principles Study. J. Chem. Phys.2004, 120, 7741 - 7749. 19
(25) Maldonado P.; Godinho J.; Evins L. Z.; Oppeneer P. M. Ab initio Prediction of Surface Stability of 20
Fluorite Materials and Experimental Verification. J. Phys. Chem. C.2013, 117, 6639 - 6650. 21
(26) den Brok S. W. J.; Morel J. The effect of Elastic Strain on the Microstructure of Free Surfaces of Stressed 22
Minerals in Contact with an Aqueous Solution. Geophys. Res. Lett.2001, 28, 603 - 606. 23
(27) Englehardt J. B.; Dabringhaus H.; Wandelt K. Atomic Force Microscopy Study of the CaF2 (111) Surface: 24
From Cleavage via Island to Evaporation topographies. Surf. Sci.2000, 448, 187 – 200. 25
(28) Horlait D.; Claparede L.; Tocino F.; Clavier N.; Ravaux J.; Szenknect S.; Podor R; Dacheux N. 26
Environmental SEM Monitoring of Ce1-xLnxO2-x/2 Mixed-Oxide Microstructural Evolution During Dissolution. 27
J. Mater. Chem. A.2014, DOI:101039/c3ta14623e
28
(29) Horlait, D.; Clavier, N.; Szenknect, S.; Dacheux, N.; Dubois, V. Dissolution of Cerium(IV)- Lanthanide(III) 29
Oxides: Comparative Effect of Chemical Composition, Temperature, and Acidity. Inorg. Chem. 2012, 51, 30
3868 - 3878. 31
(30) Horlait, D.; Tocino, F.; Clavier, N.; Dacheux, N.; Szenknect, S. Multiparametric Study of Th(1-x)Ln(x)O(2-x/2) 32
Mixed Oxides Dissolution in Nitric Acid Media. J. Nucl. Mater.2012, 429, 237-244. 33
(31) Hojo H.; Mizoguchi T.; Ohta H.; Findlay S. D.; Shibata N.; Yamamoto T.; Ikuhara Y. Atomic Structure of a 34
CeO2 Grain Boundary: The Role of Oxygen Vacancies. Nanolett.2010, 10, 4668 - 4672. 35
29 (32) Une K.; Kashibe S. Corrosion Behaviour of Irradiated Oxide Fuel Pellets in High Temperature Water. J. 1
Nucl. Mater.1996, 232, 240 - 247.
2
(33) Marchetti I.; Carbol P.; Himbert J.; Belloni F.; Fanghanel T. Room-Temperature Diffusion Coefficients 3
for Oxygen and Water in UO2 Matrices: A SIMS Study. Surf. Interface. Anal. 2013, 45, 360 - 363. 4
(34) Van Brutzel L.; Vincent-Aublant E. Grain Boundary Influence on Displacement Cascades in UO2: A 5
Molecular Dynamics Study J. Nucl. Mater.2008, 377, 522 - 527. 6
(35) Johnson L. H.; Tait J. C. Release of Segregated Radionuclides from Spent Fuel. SKB Tech. Rep.1997 TR-7
97-18. 8
(36) Johnson L.; Gunther-Leopold I.; Kobler Waldis J.; Linder H. P.; Low J.; Cui D.; Ekeroth E.; Spahiu K; Evins 9
L. Z. Rapid Aqueous Release of Fission Products from High Burn-Up LWR Fuel: Experimental Results and 10
Correlations with Fission Gas Release. J. Nucl. Mater.2012, 420, 54-62. 11
(37) Serrano-Purroy D.; Clarens F.; Gonzalez-Robles E.; Glatz J. P.; Wegen D. H.; de Pablo J.; Casas I.; 12
Gimenez J.; Martinez-Esparza A. Instant Release Fraction and Matrix Release of High Burn-Up UO2 Spent 13
Nuclear Fuel: Effect of High Burn-Up Structure and Leaching Solution Composition. J. Nucl. Mater. 2012, 14
427, 249 – 258. 15
(38) Wronkiewicz D. J.; Buck E. C.; Bates J. K. Grain Boundary Corrosion and Alteration Phase Formation 16
During the Oxidative Dissolution of UO2 Pellets. Mater. Res. Soc. Symp. Proc.1997, 465, 519. 17
(39) Schick M.; Dabringhaus H.; Wandelt K. Macrosteps on CaF2 (111). J. Phys.: Condens. Matter. 2004, 16, 18
L33 – L37. 19
(40) He H.; Shoesmith D. W. Raman Spectroscopic Studies of Defect Structures and Phase Transition in 20
Hyper-Stoichiometric UO2+x. Phys. Chem. Chem. Phys.2010, 12, 8108 - 8117. 21
(41) Johansson S.; Schweitz J.; Lagerlof K. P. D. Surface Defects in Polished Silicon Studies by Cross-Sectional 22
Transmission Electron Microscopy. J. Am. Ceram. Soc.1989, 72, 1136 - 1139. 23
(42) Saito T.; Hirayama T.; Yamamoto T.; Ikuhara Y. Lattice Strain and Dislocations in Polished Surfaces on 24
Sapphire. J. Am. Ceram. Soc.2005, 88, 2277 - 2285. 25
26
27
28
29
30
31
32
33 34
30
Graphical abstract:
1
2
3
4
5
6
7