City, University of London Institutional Repository
Citation
:
Pharoah, C. and Keiden, C. (2010). Family Foundation Giving Trends 2010.
London: Alliance Publishing Trust.
This is the published version of the paper.
This version of the publication may differ from the final published
version.
Permanent repository link:
http://openaccess.city.ac.uk/16857/
Link to published version
:
Copyright and reuse:
City Research Online aims to make research
outputs of City, University of London available to a wider audience.
Copyright and Moral Rights remain with the author(s) and/or copyright
holders. URLs from City Research Online may be freely distributed and
linked to.
City Research Online:
http://openaccess.city.ac.uk/
publications@city.ac.uk
Family Foundation
Giving Trends 2010
Cathy Pharoah
with Charles Keidan
Just as we are experiencing severe reductions in public expenditure,and the wealthy are being urged to give more back to society, this report provides timely data on the charitable giving and activities of major family foundations. It attempts to draw the ‘big picture’ of family foundation giving in the 21st century.
Family Foundation Giving Trends 2010 is a collaboration between academics and practioners in philanthropy, and the third report in a new annual series. It updates figures for the giving of the UK’s family foundations in 2008/09, providing a table of the largest 100, analysing the impact of recent economic turbulence and comparing trends with those in the US.
With many new family foundations established by the successful entrepreneurs of an era of expanding global markets and capital flows, including, for example, the Waterloo Trust, set up by the founders of Admiral Insurance, and the Volant Trust, set up by J K Rowling, the research shows that family foundation giving has been remarkably resilient in recent difficult times.
The report provides many examples of foundations, founders and funding awards, revealing significant national investment in education, science, culture and the environment. It shows foundation leadership and innovation in approaches to some of society’s most intractable problems, and highlights how foundations mobilize resources by working in partnership with civil society, government and business.
Giving, however, is often driven by personal vision and thinly stretched over a breath-takingly wide range of need. In showing how much has been attempted with limited resources, the report aims to encourage others to give more, and give effectively.
WWW.AllIAncepUblIShInG.oRG ISbn 978 1 907376 08 5 About the authors
Cathy Pharoah is professor of charity Funding and co-Director of the eSRc Research centre for charitable Giving and philanthropy, cass business School.
Charles Keidan is the Director of pears Foundation, a family foundation based in london.
F A m Il y F o u n d A T Io n G Iv In G T r e n d s 2 0 1 0
Family Foundation
Giving Trends 2010
Cathy Pharoah
Published by Alliance Publishing Trust
Copyright © 2010 ESRC Research Centre for Charitable Giving and Philanthropy, Cass Business School
All rights reserved.
ISBN 978 1 907376 08 5
Alliance Publishing Trust 1st Floor, 25 Corsham Street London N1 6DR
UK
publishing@alliancemagazine.org www.alliancepublishing.org
Registered charity number: 1116744 Company registration number: 5935154
A catalogue record for this book is available from the British Library.
Typeset in Akzidenz Grotesque Design by Benedict Richards
Printed and bound by Hobbs the Printers, Totton, Hampshire, UK
This book is printed on FSC approved paper.
Paper from responsible sources FSC® C020438
MIX
: : : : : : : : : : : : : : : : : : : : : : : : : : : : : : : : : : : : : : : : : : : : : : : : : : : : : : : : : : : : : : : : : : : : : : : : : : : : : : : : : : : : : : : : : : : : : : : : : : : : : : : : : : : : : : : : : : : : : : : : : : : : : : : : : : : : : : : : : : : : : : : : : : : :
Contents
Acknowledgements 5
About the authors 5
Foreword 7
Findings in brief 9
1
Introduction –family giving through foundations 111.1 Context of the report 11
1.2 Why focus on giving through family foundations? 11
1.3 Aims and objectives of the research 11
1.4 Summary of the methodology 13
2
Results – UK family foundation giving 2008/09 142.1 Family foundation giving 2008/09 14
2.2 Trends in UK family foundation giving 15
2.3 Comparative annual growth rates in giving and GDP 15
2.4 Assets and resilience in giving 16
2.5 Dominance of a few large family foundations 17
2.6 Family foundations operating internationally 19
2.7 Other family foundation resources 19
2.8 Can foundations provide ‘future‑proof’ funding? 19
2.9 Table of largest 100 family foundations (by giving) 2005/06 to 2008/09 20
3
UK and US comparison: family foundation giving 2008/09 243.1 Comparing the UK with the US 24
3.2 Level and share of giving in the US 24
3.3 Trends in US family foundation giving 25
3.4 Impact of Gates on the data 26
3.5 Comparison of four‑year trends in UK and US 26
3.6 Giving as a share of Gross Domestic Product 27
3.7 Comparison of trends in UK and US family foundation assets 27
3.8 Strength in UK and US family foundation giving 28
3.9 Family foundations in other European countries 28
4
Contribution of UK family foundation philanthropy 324.1 A 21st‑century philanthropy? 32
4.2 Approach to profiling 32
4.3 Strong individual interests, collective diversity 32
4.4 Responsiveness 33
4.5 Leadership and innovation 34
4.6 Global issues 34
4.7 Education 35
4.8 Arts and the major cultural institutions 36
4.9 Faith 36
4.10 Family foundations and founders today – an illustration 37
4.11 Overview – independence with collaboration, responsiveness with leadership 42
5
Conclusions and forward look 43Appendix 1 Historical background, scale and scope
of charitable foundations today 45
Appendix 2 Definitional note 48
About CGAP 50
About Pears Foundation 50
5
: : : : : : : : : : : : : : : : : : : : : : : : : : : : : : : : : : : : : : : : : : : : : : : : : : : : : : : : : : : : : : : : : : : : : : : : : : : : : : : : : : : : : : : : : : : : : : : : : : : : : : : : : : : : : : : : : : : : : : : : : : : : : : : : : : : : : : : : : : : : : : : : : : : :
Acknowledgements
This research project is a collaboration between academics and practitioners in the philanthropy field. It developed from the initial vision of Pears Foundation, which has been a partner since the study’s inception in 2008.
We would like to express our great appreciation to Ian Mocroft for extensive help in compiling the data for the report.
We thank the Foundation Center in New York for continued help in obtaining US foundation data.
All reasonable care has been taken to ensure the accuracy of the publication at the time of going to print. The publishers cannot accept responsibility for any errors or omissions.
About the authors
Cathy Pharoah is Professor of Charity Funding and Co‑Director of the ESRC Research
Centre for Charitable Giving and Philanthropy, Cass Business School.
7
: : : : : : : : : : : : : : : : : : : : : : : : : : : : : : : : : : : : : : : : : : : : : : : : : : : : : : : : : : : : : : : : : : : : : : : : : : : : : : : : : : : : : : : : : : : : : : : : : : : : : : : : : : : : : : : : : : : : : : : : : : : : : : : : : : : : : : : : : : : : : : : : : : : :
Foreword
Our family foundation has supported this research project since its inception. We felt that it was important to produce a report, without sensation, that established an accurate and transparent indicator of current giving trends.
We did so in the firm belief that philanthropy and family giving have a long and proud tradition in the UK but that, sadly, this sort of positive news is rarely highlighted.
We hope that the report will encourage greater thinking about, and possibly an increase in, philanthropy and the creation of family foundations.
As one of three brothers I have always felt very privileged to hold the position of Executive Chair of our foundation. In our case we have a small professional team to help the family focus and bring greater impact to our giving.
I have found that a family foundation can be more than simply a vehicle through which to channel money. It has helped us to develop a strategic approach to our philanthropy. We have been able to ask important questions and find some answers too. We commission research in areas of interest and try to evaluate our work. We have learnt to adopt a long‑term perspective, sometimes taking what might be perceived as risks.
I believe that family foundations can also play an important role in debates on public policy. In most cases we do not purport to be experts in the areas in which we work. However, we do believe that we have developed some expertise in how best to fund these areas. Family foundations are fully independent, can take risks that neither government nor the wider voluntary sector always feel able to take, and also have a voice that can challenge established thinking free from fear or favour.
With the state currently in retreat, I think family foundations can play an even more important role in pointing the way towards tackling social issues in the UK and beyond.
I believe that everyone wants to ‘make a difference’ in the world. I also believe that anyone can. For our family, its foundation has helped bring some meaning to this term.
Trevor Pears
9
: : : : : : : : : : : : : : : : : : : : : : : : : : : : : : : : : : : : : : : : : : : : : : : : : : : : : : : : : : : : : : : : : : : : : : : : : : : : : : : : : : : : : : : : : : : : : : : : : : : : : : : : : : : : : : : : : : : : : : : : : : : : : : : : : : : : : : : : : : : : : : : : : : : :
Findings in brief
Background to the report
Family Foundation Giving Trends 2010 is the third in a series of annual reports tracking
trends in the giving of the largest 100 UK family foundations, comparing them with the US. Amidst increasing interest in the role of philanthropy in building a better society as public expenditure reduces, this report highlights major family giving through foundations.
Many new family foundations have been established over the last couple of decades, largely funded by the successful entrepreneurs of an era of expanding global markets and capital flows. They include the Waterloo Trust, set up by owners of Admiral Insurance; the Volant Trust, set up by J K Rowling; the Foyle Foundation; the Martin Smith Foundation; and the Children’s Investment Fund Foundation. This report looks at the scope of family foundations’ activities, and the role that they play in addressing social issues in the UK and abroad today.
Financial results
UK The results show that the largest 100 family foundations are making a substantial and growing contribution. Family foundation giving has shown resilience in the face of the economic downturn.
–Family foundations gave around £1.4 billion to charitable causes in 2008/09.
–Their giving represented 9% of all private giving.
–Between 2005/06 and 2008/09 the amount given increased by 40%.
–This represented an average 9% per year in real terms, significantly outpacing growth in the economy.
–While family foundations’ asset values fell by a real 12% in 2008/09, their giving fell by just 0.2%.
US/ UK comparison Similar trends were found in US family foundation giving. In both countries, family
foundation giving grew strongly in the years of economic growth, and fell significantly less than other forms of giving when the economic crisis hit markets.
Other indicators also showed the strength of family foundation giving in both countries.
–Their share of all foundation giving went up over the period from 2005/06 to 2008/09 by 4% in the UK and 6% in the US.
10 FAMILY FOUNDATION GIVING TRENDS 2010
Behind the numbers – a 21st‑century philanthropy?
Behind the numbers for family giving through foundations lies the story of their contribution. The report asks how family foundations are responding to the major challenges of society today. What ‘big picture’ of 21st‑century philanthropy is emerging from this £1.4 billion of giving?
Looking at a sample of the activities of 16 of the newer family foundations in detail, it is found that family foundation philanthropy is spread over a breath‑takingly wide range of issues and areas.
A huge diversity of interests emerges, driven by the varied interests and experience of the founders. Responsiveness to those with the greatest needs, or those who have been marginalized, is shown in the wide range of groups who receive help, including women in prison, bullied children, the elderly, and disaffected young people.
Help is often extremely localized, but foundations also work on a global scale, aiming to make demonstrable and measurable improvements in issues such as the health and education of children in developing countries.
Imagination and leadership is shown through some foundations’ attempts to take innovative approaches to society’s more intractable problems. These include the
development of enterprise and entrepreneurial skills in areas of deprivation, new centres for research and policy development in environmental issues, and use of new forms of social investment.
Family foundations are significant investors in education and science, and make a huge contribution to maintaining and developing the cultural and environmental heritage. They can mobilize powerful networks, contacts and other non‑financial resources to bear on the problems they tackle, and develop partnerships at all levels of society.
Family foundations provide highly important public and philanthropic partnership funding. But their resources are very thinly stretched. The data shows the heavy dependence on a small number of large foundations in the UK. While representing just 0.1% of the economy, they appear spread over a field of need and opportunity as wide as – if not wider than – that of government.
11
: : : : : : : : : : : : : : : : : : : : : : : : : : : : : : : : : : : : : : : : : : : : : : : : : : : : : : : : : : : : : : : : : : : : : : : : : : : : : : : : : : : : : : : : : : : : : : : : : : : : : : : : : : : : : : : : : : : : : : : : : : : : : : : : : : : : : : : : : : : : : : : : : : : :
Introduction – giving through
1
family foundations
1.1
Context and purpose of the report
Family Foundation Giving Trends 2010 is the third in a new series of annual updates which
track trends in family giving through foundations, aiming to provide a key benchmark on its value and growth.1
Amid growing awareness of the important role that philanthropy can play in today’s social wellbeing, both local and global, and in the government’s vision of a ‘Big Society’,2
this report aims to highlight major giving through family foundations.
From the multi‑million‑dollar global philanthropy of Gates and Buffett, and the huge contributions of the Sainsbury family to UK science and culture, to J K Rowling’s support for one‑parent families, family foundations are making a vital but under‑explored contribution to society.
1.2
Aims and objectives of the research
The overarching aims of the study are to:
–encourage the transparency and accessibility of information on family foundation giving;
–enable more informed public discussion about the role of philanthropy in society;
–encourage more and effective giving through access to information and example.
The specific objectives of the research are to:
–track accurate annual levels and growth in family foundation giving;
–monitor longer‑term trends;
–compare patterns in the UK with those in the US;
–profile the range, scope and contribution of family foundation giving.
1.3
Why focus on giving through family foundations?
Family foundations are only one vehicle for family giving, so why does the report take them as its focus? A main reason lies in the difficulty of getting accurate data on major giving in the UK. The last few decades have seen escalating private wealth built on the success of global markets and capital flows, but there is no hard data on the value or growth of major new philanthropy that has resulted from it. Though there are many individual examples of major giving, government tax‑related data on giving is generic and does not, for example, publish a breakdown of tax reclaimed by size of gifts. Published figures for giving in the UK are generally derived from a number of fragmented government, third sector and market
1 C Pharoah (2008) Family
Foundation Philanthropy 2008
Centre for Charity Effectiveness, Cass Business School; Cathy Pharoah (2009) Family Foundation Philanthropy 2009 Alliance Publishing Trust, London.
2 Cabinet Office (2010), Big
12 FAMILY FOUNDATION GIVING TRENDS 2010
sample surveys, which provide only partial data as they do not have sufficiently robust samples of high net worth donors and gifts to assess major giving accurately.
An accurate annual benchmark
Because of the difficulty of getting data on major giving in the UK, this report focuses on providing one accurate and reasonably measurable annual indicator of trends: the actual annual charitable spending of family foundations. There are two reasons for taking this approach. One is that reliable and consistent data on giving can be derived from figures published annually in the audited and mandatory regulatory reports that foundations submit to the Charity Commission. This approach does, however, present its own methodological challenges, and these are summarized briefly below and explained more fully in Appendix 2.
The second reason is the evidence that, just as at the turn of the 20th century when Carnegie and Rockefeller in the US, Joseph Rowntree in the UK, and Robert Bosch in Germany were established, family foundations are playing an important role in philanthropy today. New charitable family foundations have been emerging across the globe, within countries of very different political, fiscal and regulatory regimes, and evidence on the creation of many new family and other foundations is set out below. Research has suggested that foundations are the most popular vehicle for philanthropic giving among the wealthiest European high net worth donors.3
It is difficult to predict how such activity will be affected by recent economic turbulence. Without an accurate and transparent measure of major philanthropy, it is difficult to know how generous we are, what we might aspire to, and whether our philanthropy punches above or below its weight.
Current surveys and indexes
Regular general population surveys such as UK Giving, published annually by the National Council for Voluntary Organisations (NCVO) and the Charities Aid Foundation (CAF), provide a valuable and consistent series of data, but lack a sufficiently robust sample of high net worth major donors to capture their giving accurately. Such a survey would be both difficult and expensive and, according to research commissioned by HMRC, may not even be feasible.4
Other data collection exercises, such as the Sunday Times Giving Index in its annual Rich List or the Coutts Million Pound Donor project,5 also provide useful information.
These do not provide an annual benchmark, variously combining data in any one year from one‑off direct annual gifts, gifts into new or existing foundations to be spent later, gifts from foundation income derived from past gifted endowments and, in some cases, pledges for the future.
3 P Lomax (2007) Advice needed.
Philanthropy amongst ultra high net worth individuals and family offices in Europe New Philanthropy Capital, London.
4 J Taylor, C Webb, D Camerson
(2007) Charitable Giving by Wealthy People Ipsos Mori for HMRC. www.hmrc.gov.uk/ research/report29‑giving‑by‑ wealthy.pdf
5 B Breeze (2009) The Million
INTRODUCTION –FAMILY GIVING THROUGH FOUNDATIONS 13
1.4
Summary of the methodology
Data Data collection focused mainly on the largest 100 charitable family foundations in the
UK and the US, for two reasons. First, a restriction to the largest 100 organizations in each country made the project feasible. There are no pre‑existing databases of family foundations, and each foundation has to be individually identified using a number of criteria – a resource‑intensive task. Second, these organizations provide a substantial sample of all charitable family foundation spending by value because of the financial dominance of a small number of very large foundations in each country (see figures in Chapter 2).
Timescale It was decided to include family foundations generally established in the latter part of the 19th century, a great era in the history of family foundations, and onwards.
Sources6 The report is based almost entirely on secondary analysis of published charities’ accounts
data for the period 2005–2009.
Reporting year Foundations, in common with other charities, adopt different ‘year‑end’ months for their annual reporting, and the time they take to publish reports also varies considerably. This means that in a ‘snapshot’ study like this, which aims to compile the best data available at a certain point of time, the charity accounts used are not all standardized to the same year. Wherever it is felt that this influences the general findings in some way, it is noted in the text. It should be noted that while tables are labelled 2005/06 to 2008/09, in practice some charity accounts vary.
Financial indicator Family foundations work in financial and non‑financial ways, but the focus of this research is to identify annual levels of family foundation charitable expenditure or ‘spending’ (also referred to as ‘giving’ or ‘philanthropy’ in this report); the figure includes their charitable expenditure on grants to organizations and individuals, as well as any operating programmes such as, for example, in the large scientific and medical research foundations. The bulk of UK foundation activity involves making grants to partners, sometimes referred to as grantees, but around 8% of their charitable expenditure is devoted to their own programmes.7 Support and governance costs of charitable spending are excluded, to make
UK data more comparable with the available US data.
Definitions and typology Charitable family foundations are a type of charitable foundation and have a centuries‑old
history, emerging within all the world’s major cultures and regions. Generally they are independently governed institutions, with large private assets, often in the form of
permanent endowments, which they use to promote public good. They are private, funded principally by the personal gift of a family business or family member(s), often with the donor or family members having a position on their board of directors. Their main, but not sole, activity in recent years includes making grants to charities, individuals and other public benefit institutions for which they provide sustainable and independent support.
6 Main data sources include the
Charity Commission Register, England and Wales; Top 3000 Charities, CaritasData; Charity Market Monitor, CaritasData (2006, 2008, 2009 and 2010
editions); charities’ own websites and reports; Foundation Center statistics. Detailed regulatory data on foundations is available in the US and UK, but the Office of the Scottish Charity Regulator (OSCR)
publishes less detail, and the Charity Commission for Northern Ireland was only established in 2009.
7 C Pharoah (2010) Charity Market
14
: : : : : : : : : : : : : : : : : : : : : : : : : : : : : : : : : : : : : : : : : : : : : : : : : : : : : : : : : : : : : : : : : : : : : : : : : : : : : : : : : : : : : : : : : : : : : : : : : : : : : : : : : : : : : : : : : : : : : : : : : : : : : : : : : : : : : : : : : : : : : : : : : : : :
UK family foundation giving 2008/09
2
This chapter presents updated annual figures and analysis of UK family foundation giving.8
2.1
Family foundation giving 2008/09
The largest 100 family foundations in the UK gave a total of £1.4 billion to charitable causes in 2008/09.
The top 5 by charitable expenditure were the Wellcome Trust (£681 million), the Gatsby Charitable Foundation (£50 million), the Leverhulme Trust (£45 million), the Wolfson Foundation (£39 million) and the Monument Trust (£35 million). The full table can be seen in section 2.9, page 20.
This represented a substantial share of all UK private charitable giving, which amounts to an estimated annual £15.4 billion.9 The contribution of family giving through
foundations was:
–9% of all private giving, whether through foundations, individual giving, legacies or companies (including tax reclaimed by charities);
–46% of all giving through foundations.10
In spite of the economic turbulence, family foundation giving fell by just 0.2% in real terms, as foundations drew on reserves to maintain their spending.
Figure 1
Share of UK family foundation giving by foundation type
Big Lottery Fund
19%
Family foundations
46%
Other foundations
35%
8 While every effort was made to
achieve accurate data, two points to note are: a) a small amount of double‑counting may have occurred where foundations fund other foundations in the table; and b) it was not always possible to
identify amounts given in any one year where the spending was to be spread over a number of years. It is not considered that these considerations affect the results in any material way.
9 C Pharoah (2010) Charity Market
Monitor 2010 CaritasData, London.
10 Figures for UK foundations as a
RESULTS – UK FAMILY FOUNDATION GIVING 2008/09 15
2.2
Trends in UK family foundation giving
As this is the third annual report in the series on family giving through foundations, it has been possible for the first time to track the giving of the largest 100 givers from 2005/06 to 2008/09 and plot a trend‑line.
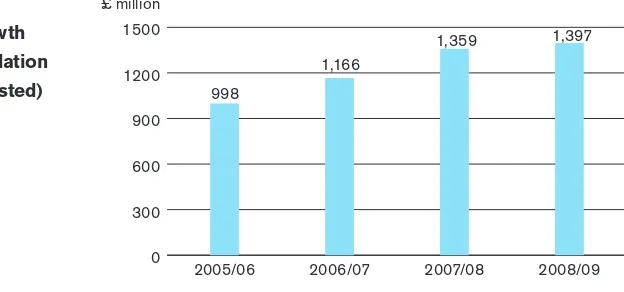
Results show that between 2005/06 and 2008/09, the value of family foundation giving in this panel has grown steadily, from £998 million to £1.4 billion.
This means that, after adjusting for inflation, its value grew by a real 28% in total over the period.
Several trusts grew their charitable spending by considerably more than this over the period, including the Wellcome Trust, the Maurice Wohl Charitable Foundation, the Monument Trust, the Martin Smith Foundation and the Lewis Family Charitable Trust. The newcomer to the table was the Waterloo Trust,11 which was only set up in December 2006
but came straight into the table in 42nd place in 2008/09, giving £4.8 million.
Figure 2
Four‑year growth in family foundation
giving (unadjusted) 998
1,166
1,359 1,397
0 300 600 900 1200 1500
2008/09 2007/08
2006/07 2005/06
£ million
2.3
Comparative annual growth rates in giving and GDP
These results show that until the period of economic turbulence that began in the autumn of 2007, family foundation giving was growing substantially in value, and only showed a slight fall after adjusting for inflation when markets plunged in 2008/09.
It grew by a substantial 13.4% (in real terms) in 2006/07, followed by 13.2% the next year. It almost maintained its value in 2008/09, falling by just 0.2%.
Family foundation giving appears to have been particularly resilient throughout the recent times of economic uncertainty. Over the period shown, growth in its value outstripped that of the general economy (in Gross Domestic Product, GDP) substantially until 2008/09, when its growth fell by a similar amount as GDP (see Figure 3).
11 As the Waterloo Trust did not
[image:17.595.120.432.262.408.2]16 FAMILY FOUNDATION GIVING TRENDS 2010
Figure 3
Annual real growth rate (%) in family foundation giving and GDP
13.4
2.8 2.7 13.2
–0.2 –0.1 -1
1 3 5 7 9 11 13 15
2008/09 2007/08
2006/07
2005/06 Family foundation giving
GDP %
2.4
Assets and resilience in giving
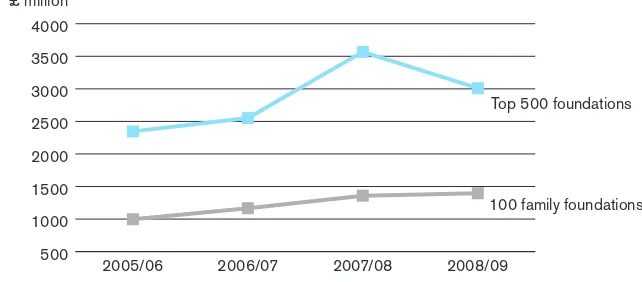
Giving among family foundations also grew faster and maintained its value better than that of charitable foundations generally. This is shown in the graph below, which compares trends in the annual value of family foundation giving with that of the largest 500 foundations (by giving) as a whole. Absolute family foundation giving grew faster in the early period, and maintained its value better in 2008/09.
Figure 4
Four‑year trends in giving by family foundations and by top 500 foundations (unadjusted)
500 1000 1500 2000 2500 3000 3500 4000
Top 500 foundations
100 family foundations 2008/09
2007/08 2006/07
2005/06 £ million
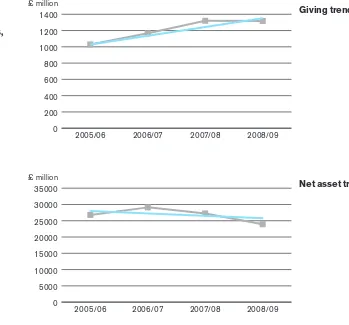
Assets One explanation for the greater resilience of family foundations is that they hold a very large share of total charitable foundation assets. Figure 13 in the next section shows that they own almost three quarters, at 71%. In contrast, corporate and fundraising foundations tend to have fewer assets, and depend on annual funding donations. (Big Lottery Fund was excluded from the figures below.)
[image:18.595.69.523.52.203.2] [image:18.595.180.501.358.499.2]RESULTS – UK FAMILY FOUNDATION GIVING 2008/09 17
Figure 5
Four‑year trends in giving and assets, largest 100 family foundations
0 200 400 600 800 1000 1200 1400
2008/09 2007/08
2006/07 2005/06
£ million
Giving trends
0 5000 10000 15000 20000 25000 30000 35000
2008/09 2007/08
2006/07 2005/06
£ million
Net asset trends
2.5
Dominance of a few large family foundations
There is a heavy skew in UK family foundation givingtowards a few very large organizations. The Wellcome Trust is in a class of its own, with charitable expenditure of around £681 million in 2008/09. This is 13 times the spending of its next nearest neighbours, the large Gatsby, Leverhulme and Wolfson trusts.
[image:19.595.142.491.51.376.2]18 FAMILY FOUNDATION GIVING TRENDS 2010
Figure 6
Largest 10 family foundations 2008/09 Name Giving £ million Net Assets £ million Fiscal Year
1 Wellcome Trust 680.6 11,949.0 Sep 09
2 The Gatsby Charitable Foundation 50.0 465.9 Apr 09
3 The Leverhulme Trust 45.1 1,256.1 Dec 08
4 The Wolfson Foundation 39.2 560.9 Apr 09
5 The Monument Trust 35.2 207.6 Apr 09
6 The Sigrid Rausing Trust 28.8 30.2 Dec 08
7 Garfield Weston Foundation 25.3 2,894.8 Apr 09
8 The Children’s Investment Fund Foundation
23.1 1,440.2 Aug 09
9 Esmée Fairbairn Foundation 21.5 724.8 Dec 08
10 The Tudor Trust 16.8 204.8 Mar 09
Top 10 share increasing The growth and trends in family foundation giving noted above did not depend on the
dominant Wellcome Trust, which represents 40% of family foundation giving, and held when it was excluded from the data.
Figure 7 Share of giving, Wellcome and other family foundations
Other 100 family foundations 60% Wellcome Trust
40%
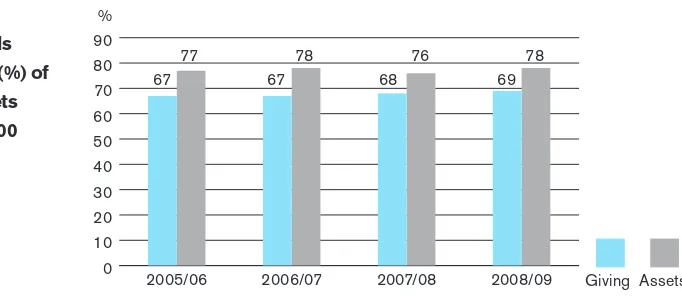
Overall, however, the largest 10 family foundations appear to be slowly increasing their share of giving, which went up steadily from 67% in 2005/06 to 69% in 2008/09. (This trend also persists if Wellcome is excluded.) This finding has two implications. One is that at a time of economic uncertainty, the large trusts appear to be carrying an increasing burden for funding. The second is that grant‑seekers may become increasingly dependent on a narrower set of funders; this might affect their diversity, and would merit further research.
Figure 8
Four‑year trends in top 10 share (%) of giving and assets of the largest 100
[image:20.595.68.541.266.717.2] [image:20.595.138.479.561.709.2]RESULTS – UK FAMILY FOUNDATION GIVING 2008/09 19
2.6
Family foundations operating internationally
The data in this report does not provide a full account of the total spending of family foundations in the UK. A number of family foundations not listed in the table – including the Calouste Gulbenkian Foundation (UK branch), the Oak Foundation, the Atlantic Philanthropies, the Ariane de Rothschild Foundation and the Adessium Foundation – have their headquarters or main office registered in other countries, but spend some of their resources in the UK.
2.7
Other family foundation resources
Some major family foundation giving is carried out through intermediary donor
organizations, and data is not available to include them in the table. This means that, for example, the funding of Arcadia, the conservation trust set up by Lisbet Rausing and managed through the Charities Aid Foundation, is not included.
There are also many sizeable new and other family foundations whose giving was just below the lower end of the table of the largest 100 in 2008/09, but which make a significant philanthropic contribution in the UK. Some of these, such as the Rayne Foundation, have been featured in this report. If all trusts that give over £1 million per annum were included, this would add another £50 million or so to the total figure for family foundation giving. They include, for example, the Charles Hayward Foundation, the Lempriere Pringle Charitable Trust, the Porter Foundation, the Rayne Foundation, The True Colours Trust, the A M Qattan Foundation, the Vardy Foundation and the Ormiston Trust.
2.8
Can foundations provide ‘future‑proof’ funding?
The family foundations table shows that while there are many new family foundations, the funding capacity of major family foundations today is still in large part due to the generosity of past family donors, and the assets which have been inherited and grown.
Research elsewhere suggests that, albeit with some fluctuations, there has been a generally upward trend in the real value of charitable endowment assets over the last decade, until they were hit by the recent economic turbulence.12 The conflicting trends are
prompting some divergent thinking about foundation endowments. On the one hand it has encouraged more foundations to think about spending out their funds (see for example,
Spend‑Out Trusts and Foundations in the UK, Institute of Philanthropy); on the other it has
led policymakers to look at the scope for new endowments to ensure there is a funding base for the future.13 Some major family foundations, such as the Atlantic Philanthropies,
have decided to spend out their resources during their founder’s lifetime.
12 C Pharoah (2010) ‘Now and
forever . . .’ Caritas, issue 34, September 2010. London.
13 DCMS (2010) Strategic Reform
20 FAMILY FOUNDATION GIVING TRENDS 2010
2.9
Table of the largest 100 UK family foundations (by giving) 2005/06–2008/09
Name 2008/09 (or most recent) 2007/08 (or previous) 2006/07 (or previous) 2005/06 (or previous)
Rank Charitable Exp £m Net Assets £m Fiscal year end Rank Charitable Exp £m Net Assets £m Fiscal year end Rank Charitable Exp £m Net Assets £m Fiscal year end Rank Charitable Exp £m Net Assets £m Fiscal year end
Wellcome Trust 1 680.6 11,949.0 Sep 09 1 657.8 12,031.7 Sep 08 1 472.7 14,364.8 Sep 07 1 444.2 12,683.1 Sep 06
The Gatsby Charitable Foundation 2 50.0 465.9 Apr 09 7 30.8 464.7 Apr 08 2 117.2 380.4 Apr 07 2 53.8 386.6 Apr 06
The Leverhulme Trust 3 45.1 1,256.1 Dec 08 3 40.4 1,532.4 Dec 07 3 41.8 1,205.1 Dec 06 6 29.6 1,079.8 Dec 05
The Wolfson Foundation 4 39.2 560.9 Apr 09 4 33.8 638.5 Apr 08 5 35.5 678.0 Apr 07 3 38.0 668.4 Apr 06
The Monument Trust 5 35.2 207.6 Apr 09 12 16.3 215.1 Apr 08 66 2.5 131.8 Apr 07 46 3.4 118.1 Apr 06
The Sigrid Rausing Trust 6 28.8 30.2 Dec 08 11 17.0 60.3 Dec 07 13 14.5 70.1 Dec 06 10 12.8 80.4 Dec 05
Garfield Weston Foundation 7 25.3 2,894.8 Apr 09 2 51.7 3,720.6 Apr 08 4 39.5 3,688.3 Apr 07 4 37.8 3,511.4 Apr 06
The Children’s Investment Fund Foundation 8 23.1 1,440.2 Aug 09 5 33.5 1,555.1 Aug 08 14 10.2 801.7 Aug 07 27 5.1 362.5 Aug 06
Esmée Fairbairn Foundation 9 21.5 724.8 Dec 08 8 23.3 937.8 Dec 07 6 27.3 916.9 Dec 06 5 29.6 825.6 Dec 05
The Tudor Trust 10 16.8 204.8 Mar 09 10 19.7 273.2 Mar 08 9 17.2 307.1 Mar 07 8 17.5 295.7 Mar 06
The Jack Petchey Foundation 11 15.7 –2.4 Dec 08 16 12.4 5.1 Dec 07 16 8.4 8.6 Dec 06 20 5.9 3.1 Dec 05
The Atlantic Charitable Trust 12 14.8 58.7 Dec 08 15 12.6 66.1 Dec 07 11 16.0 62.1 Dec 06 14 7.0 73.1 Dec 05
Paul Hamlyn Foundation 13 13.4 466.3 Mar 09 13 14.5 513.5 Mar 08 12 19.1 548.5 Mar 07 11 12.8 502.2 Mar 06
Christian Vision 14 13.2 187.5 Dec 08 14 13.3 200.3 Dec 07 8 15.9 187.0 Dec 06 9 9.5 32.6 Dec 05
De Haan Charitable Trust 15 11.5 45.8 Apr 09 18 10.5 58.3 Apr 08 20 7.0 63.5 Apr 07 59 2.7 66.7 Apr 06
Khodorkovsky Foundation 16 10.6 289.4 Dec 08 26 6.8 317.2 Dec 07 44 4.1 298.7 Dec 06 45 3.4 313.0 Dec 05
The Maurice and Vivienne Wohl Philanthropic Foundation 17 10.3 56.1 Apr 09 36 5.3 48.8 Apr 08 99 0.0 4.5 Apr 07 99 0.0 1.3 Apr 06
The Robertson Trust 18 9.6 340.4 Apr 09 21 8.1 320.5 Apr 08 18 8.1 274.5 Apr 07 13 8.0 257.6 Apr 06
Nuffield Foundation 19 9.5 191.8 Dec 08 19 9.9 254.7 Dec 07 15 8.6 250.0 Dec 06 15 6.9 230.3 Dec 06
Mayfair Charities Ltd 20 8.6 51.0 Mar 09 22 7.8 65.7 Mar 08 23 6.5 83.4 Mar 07 12 8.4 66.2 Mar 06
The Prince’s Charities Foundation 21 7.9 2.5 Mar 09 9 22.8 2.1 Mar 08 48 3.4 5.6 Mar 07 48 3.2 5.2 Mar 06
The Rank Foundation Limited 22 7.4 189.5 Dec 08 30 6.1 243.7 Dec 07 37 4.9 241.8 Dec 06 16 6.8 221.0 Dec 05
Maurice Wohl Charitable Foundation 23 7.2 72.0 Apr 09 20 9.8 63.8 Apr 08 98 0.1 17.7 Apr 07 96 0.2 17.8 Apr 06
The Peter Moores Charitable Trust 24 6.9 45.4 Apr 09 32 5.8 55.4 Apr 08 7 19.7 59.0 Apr 07 7 26.4 74.9 Apr 06
Keren Association Limited 25 6.8 15.1 Mar 09 27 6.5 19.3 Mar 08 33 5.5 17.8 Mar 07 31 4.9 17.3 Mar 06
The Pears Family Charitable Foundation 26 6.5 15.1 Mar 09 31 6.1 13.9 Mar 08 42 4.4 13.4 Mar 07 53 3.1 11.6 Mar 06
The Lancaster‑Taylor Charitable Trust 27 6.0 9.5 Mar 09 60 3.0 12.0 Mar 08 50 3.3 9.2 Mar 07 19 6.0 10.5 Mar 06
The Joseph Rowntree Charitable Trust 28 6.0 117.0 Dec 08 41 4.6 191.1 Dec 07 24 6.4 193.7 Dec 06 32 4.9 169.8 Dec 05
The Hunter Foundation 29 5.9 3.4 Mar 09 17 11.9 1.1 Mar 08 19 8.0 0.2 Mar 07 35 4.7 0.9 Mar 06
The Eranda Foundation 30 5.7 87.0 Apr 08 79 2.3 67.8 Apr 07 64 2.7 59.3 Apr 06 77 1.8 51.5 Apr 05
The Linbury Trust 31 5.5 159.4 Apr 08 51 3.9 219.9 Apr 07 26 6.0 153.7 Apr 06 34 4.7 139.2 Apr 05
The Rufford Maurice Laing Foundation 32 5.3 60.8 Apr 09 6 31.5 64.8 Apr 08 29 5.9 93.1 Apr 07 41 4.0 96.1 Apr 06
The Rhodes Trust 33 5.2 103.7 Jun 09 37 5.3 141.4 Jun 08 40 4.5 155.3 Jun 07 25 5.2 143.6 Jun 06
Stewards Company Ltd 34 5.2 104.5 Jun 09 29 6.1 121.1 Jun 08 32 5.6 131.8 Jun 07 33 4.7 122.7 Jun 06
Edward James Foundation Limited 35 5.2 50.2 Sep 09 39 4.9 49.7 Sep 08 38 4.7 51.9 Sep 07 37 4.5 50.0 Sep 06
Lewis Family Charitable Trust 36 5.1 4.4 May 09 96 1.4 7.9 May 08 85 1.8 6.2 May 07 95 0.4 5.4 May 06
The Bowland Charitable Trust 37 5.1 10.0 Dec 08 88 2.0 13.7 Dec 07 10 17.2 8.0 Dec 06 87 1.3 23.8 Dec 05
The Foyle Foundation 38 5.0 73.0 Jun 09 34 5.6 68.5 Jun 08 28 5.9 81.4 Jun 07 30 5.0 77.0 Jun 06
Kay Kendall Leukaemia Fund 39 5.0 36.2 Apr 09 87 2.0 50.1 Apr 08 70 2.3 57.6 Apr 07 80 1.7 50.6 Apr 06
The Henry Moore Foundation 40 5.0 81.0 Mar 09 38 4.9 101.0 Mar 08 35 5.4 108.0 Mar 07 38 4.4 106.9 Mar 06
Peter Harrison Foundation 41 4.9 30.2 May 09 69 2.6 30.3 May 08 84 1.8 30.7 May 07 39 4.3 30.8 May 06
The Waterloo Foundation 42 4.8 95.1 Dec 08 92 1.6 107.3 Dec 07
The Clore Duffield Foundation 43 4.7 76.8 Dec 08 40 4.8 83.3 Dec 07 27 6.0 68.8 Dec 06 40 4.0 68.3 Dec 05
The Helen Hamlyn Trust 44 4.7 4.3 Mar 09 58 3.1 5.9 Mar 08 91 1.2 5.0 Mar 07 71 2.1 3.7 Mar 06
The Thomas Baily Thomas Charitable Fund 45 4.7 72.0 Sep 09 48 4.1 71.0 Sep 08 39 4.6 87.8 Sep 07 47 3.3 82.7 Sep 06
The 29th May 1961 Charitable Trust 46 4.6 82.7 Apr 09 53 3.7 82.7 Apr 08 45 4.0 113.0 Apr 07 51 3.1 106.2 Apr 06
Cosmon (Belz) Limited 47 4.5 0.8 Mar 09 28 6.3 0.7 Mar 08 21 7.0 0.8 Mar 07 21 5.8 0.4 Mar 06
The Charles Wolfson Charitable Trust 48 4.4 127.3 Apr 09 25 7.1 152.9 Apr 08 25 6.3 160.2 Apr 07 18 6.1 144.8 Mar 06
The Hintze Family Charitable Foundation 49 4.4 1.5 Dec 08 70 2.5 2.0 Dec 07 90 1.3 1.2 Dec 06 29 5.1 1.2 Dec 06
RESULTS – UK FAMILY FOUNDATION GIVING 2008/09 21
2.9
Table of the largest 100 UK family foundations (by giving) 2005/06–2008/09
Name 2008/09 (or most recent) 2007/08 (or previous) 2006/07 (or previous) 2005/06 (or previous)
Rank Charitable Exp £m Net Assets £m Fiscal year end Rank Charitable Exp £m Net Assets £m Fiscal year end Rank Charitable Exp £m Net Assets £m Fiscal year end Rank Charitable Exp £m Net Assets £m Fiscal year end
Wellcome Trust 1 680.6 11,949.0 Sep 09 1 657.8 12,031.7 Sep 08 1 472.7 14,364.8 Sep 07 1 444.2 12,683.1 Sep 06
The Gatsby Charitable Foundation 2 50.0 465.9 Apr 09 7 30.8 464.7 Apr 08 2 117.2 380.4 Apr 07 2 53.8 386.6 Apr 06
The Leverhulme Trust 3 45.1 1,256.1 Dec 08 3 40.4 1,532.4 Dec 07 3 41.8 1,205.1 Dec 06 6 29.6 1,079.8 Dec 05
The Wolfson Foundation 4 39.2 560.9 Apr 09 4 33.8 638.5 Apr 08 5 35.5 678.0 Apr 07 3 38.0 668.4 Apr 06
The Monument Trust 5 35.2 207.6 Apr 09 12 16.3 215.1 Apr 08 66 2.5 131.8 Apr 07 46 3.4 118.1 Apr 06
The Sigrid Rausing Trust 6 28.8 30.2 Dec 08 11 17.0 60.3 Dec 07 13 14.5 70.1 Dec 06 10 12.8 80.4 Dec 05
Garfield Weston Foundation 7 25.3 2,894.8 Apr 09 2 51.7 3,720.6 Apr 08 4 39.5 3,688.3 Apr 07 4 37.8 3,511.4 Apr 06
The Children’s Investment Fund Foundation 8 23.1 1,440.2 Aug 09 5 33.5 1,555.1 Aug 08 14 10.2 801.7 Aug 07 27 5.1 362.5 Aug 06
Esmée Fairbairn Foundation 9 21.5 724.8 Dec 08 8 23.3 937.8 Dec 07 6 27.3 916.9 Dec 06 5 29.6 825.6 Dec 05
The Tudor Trust 10 16.8 204.8 Mar 09 10 19.7 273.2 Mar 08 9 17.2 307.1 Mar 07 8 17.5 295.7 Mar 06
The Jack Petchey Foundation 11 15.7 –2.4 Dec 08 16 12.4 5.1 Dec 07 16 8.4 8.6 Dec 06 20 5.9 3.1 Dec 05
The Atlantic Charitable Trust 12 14.8 58.7 Dec 08 15 12.6 66.1 Dec 07 11 16.0 62.1 Dec 06 14 7.0 73.1 Dec 05
Paul Hamlyn Foundation 13 13.4 466.3 Mar 09 13 14.5 513.5 Mar 08 12 19.1 548.5 Mar 07 11 12.8 502.2 Mar 06
Christian Vision 14 13.2 187.5 Dec 08 14 13.3 200.3 Dec 07 8 15.9 187.0 Dec 06 9 9.5 32.6 Dec 05
De Haan Charitable Trust 15 11.5 45.8 Apr 09 18 10.5 58.3 Apr 08 20 7.0 63.5 Apr 07 59 2.7 66.7 Apr 06
Khodorkovsky Foundation 16 10.6 289.4 Dec 08 26 6.8 317.2 Dec 07 44 4.1 298.7 Dec 06 45 3.4 313.0 Dec 05
The Maurice and Vivienne Wohl Philanthropic Foundation 17 10.3 56.1 Apr 09 36 5.3 48.8 Apr 08 99 0.0 4.5 Apr 07 99 0.0 1.3 Apr 06
The Robertson Trust 18 9.6 340.4 Apr 09 21 8.1 320.5 Apr 08 18 8.1 274.5 Apr 07 13 8.0 257.6 Apr 06
Nuffield Foundation 19 9.5 191.8 Dec 08 19 9.9 254.7 Dec 07 15 8.6 250.0 Dec 06 15 6.9 230.3 Dec 06
Mayfair Charities Ltd 20 8.6 51.0 Mar 09 22 7.8 65.7 Mar 08 23 6.5 83.4 Mar 07 12 8.4 66.2 Mar 06
The Prince’s Charities Foundation 21 7.9 2.5 Mar 09 9 22.8 2.1 Mar 08 48 3.4 5.6 Mar 07 48 3.2 5.2 Mar 06
The Rank Foundation Limited 22 7.4 189.5 Dec 08 30 6.1 243.7 Dec 07 37 4.9 241.8 Dec 06 16 6.8 221.0 Dec 05
Maurice Wohl Charitable Foundation 23 7.2 72.0 Apr 09 20 9.8 63.8 Apr 08 98 0.1 17.7 Apr 07 96 0.2 17.8 Apr 06
The Peter Moores Charitable Trust 24 6.9 45.4 Apr 09 32 5.8 55.4 Apr 08 7 19.7 59.0 Apr 07 7 26.4 74.9 Apr 06
Keren Association Limited 25 6.8 15.1 Mar 09 27 6.5 19.3 Mar 08 33 5.5 17.8 Mar 07 31 4.9 17.3 Mar 06
The Pears Family Charitable Foundation 26 6.5 15.1 Mar 09 31 6.1 13.9 Mar 08 42 4.4 13.4 Mar 07 53 3.1 11.6 Mar 06
The Lancaster‑Taylor Charitable Trust 27 6.0 9.5 Mar 09 60 3.0 12.0 Mar 08 50 3.3 9.2 Mar 07 19 6.0 10.5 Mar 06
The Joseph Rowntree Charitable Trust 28 6.0 117.0 Dec 08 41 4.6 191.1 Dec 07 24 6.4 193.7 Dec 06 32 4.9 169.8 Dec 05
The Hunter Foundation 29 5.9 3.4 Mar 09 17 11.9 1.1 Mar 08 19 8.0 0.2 Mar 07 35 4.7 0.9 Mar 06
The Eranda Foundation 30 5.7 87.0 Apr 08 79 2.3 67.8 Apr 07 64 2.7 59.3 Apr 06 77 1.8 51.5 Apr 05
The Linbury Trust 31 5.5 159.4 Apr 08 51 3.9 219.9 Apr 07 26 6.0 153.7 Apr 06 34 4.7 139.2 Apr 05
The Rufford Maurice Laing Foundation 32 5.3 60.8 Apr 09 6 31.5 64.8 Apr 08 29 5.9 93.1 Apr 07 41 4.0 96.1 Apr 06
The Rhodes Trust 33 5.2 103.7 Jun 09 37 5.3 141.4 Jun 08 40 4.5 155.3 Jun 07 25 5.2 143.6 Jun 06
Stewards Company Ltd 34 5.2 104.5 Jun 09 29 6.1 121.1 Jun 08 32 5.6 131.8 Jun 07 33 4.7 122.7 Jun 06
Edward James Foundation Limited 35 5.2 50.2 Sep 09 39 4.9 49.7 Sep 08 38 4.7 51.9 Sep 07 37 4.5 50.0 Sep 06
Lewis Family Charitable Trust 36 5.1 4.4 May 09 96 1.4 7.9 May 08 85 1.8 6.2 May 07 95 0.4 5.4 May 06
The Bowland Charitable Trust 37 5.1 10.0 Dec 08 88 2.0 13.7 Dec 07 10 17.2 8.0 Dec 06 87 1.3 23.8 Dec 05
The Foyle Foundation 38 5.0 73.0 Jun 09 34 5.6 68.5 Jun 08 28 5.9 81.4 Jun 07 30 5.0 77.0 Jun 06
Kay Kendall Leukaemia Fund 39 5.0 36.2 Apr 09 87 2.0 50.1 Apr 08 70 2.3 57.6 Apr 07 80 1.7 50.6 Apr 06
The Henry Moore Foundation 40 5.0 81.0 Mar 09 38 4.9 101.0 Mar 08 35 5.4 108.0 Mar 07 38 4.4 106.9 Mar 06
Peter Harrison Foundation 41 4.9 30.2 May 09 69 2.6 30.3 May 08 84 1.8 30.7 May 07 39 4.3 30.8 May 06
The Waterloo Foundation 42 4.8 95.1 Dec 08 92 1.6 107.3 Dec 07
The Clore Duffield Foundation 43 4.7 76.8 Dec 08 40 4.8 83.3 Dec 07 27 6.0 68.8 Dec 06 40 4.0 68.3 Dec 05
The Helen Hamlyn Trust 44 4.7 4.3 Mar 09 58 3.1 5.9 Mar 08 91 1.2 5.0 Mar 07 71 2.1 3.7 Mar 06
The Thomas Baily Thomas Charitable Fund 45 4.7 72.0 Sep 09 48 4.1 71.0 Sep 08 39 4.6 87.8 Sep 07 47 3.3 82.7 Sep 06
The 29th May 1961 Charitable Trust 46 4.6 82.7 Apr 09 53 3.7 82.7 Apr 08 45 4.0 113.0 Apr 07 51 3.1 106.2 Apr 06
Cosmon (Belz) Limited 47 4.5 0.8 Mar 09 28 6.3 0.7 Mar 08 21 7.0 0.8 Mar 07 21 5.8 0.4 Mar 06
The Charles Wolfson Charitable Trust 48 4.4 127.3 Apr 09 25 7.1 152.9 Apr 08 25 6.3 160.2 Apr 07 18 6.1 144.8 Mar 06
The Hintze Family Charitable Foundation 49 4.4 1.5 Dec 08 70 2.5 2.0 Dec 07 90 1.3 1.2 Dec 06 29 5.1 1.2 Dec 06
22 FAMILY FOUNDATION GIVING TRENDS 2010
Name 2008/09 (or most recent) 2007/08 (or previous) 2006/07 (or previous) 2005/06 (or previous)
Rank Charitable
Exp £m Net Assets £m Fiscal year end Rank Charitable Exp £m Net Assets £m Fiscal year end Rank Charitable Exp £m Net Assets £m Fiscal year end Rank Charitable Exp £m Net Assets £m Fiscal year end
The Gannochy Trust 51 4.2 107.1 May 09 33 5.8 104.4 May 08 22 6.8 136.3 May 07 49 3.2 104.4 May 06
The Gertner Charitable Trust 52 4.1 5.8 Mar 09 23 7.7 6.8 Mar 08 17 8.1 –2.7 Mar 06 22 5.6 2.3 Mar 05
The Rothschild Foundation (Europe) 53 4.0 60.2 Dec 08 52 3.9 72.2 Dec 07 47 3.5 68.2 Dec 06 63 2.2 67.2 Dec 05
The Tubney Charitable Trust 54 3.9 28.0 Mar 09 24 7.4 29.4 Mar 08 31 5.6 36.1 Mar 07 36 4.6 37.5 Mar 06
The Sutton Trust 55 3.9 1.4 Dec 08 81 2.2 0.8 Dec 07 88 1.3 1.6 Dec 06 81 1.7 1.2 Dec 05
The Parthenon Trust 56 3.9 0.3 Dec 08 50 4.0 1.6 Dec 07 34 5.5 0.4 Dec 06 17 6.4 0.2 Dec 05
The Smith Martin Smith Foundation 57 3.8 0.2 Apr 09 97 1.1 3.2 Apr 08 97 0.2 0.2 Apr 07 97 0.2 0.1 Apr 06
The Alan Howard Charitable Trust 58 3.8 3.0 Apr 09 94 1.6 0.0 Apr 08 80 2.0 –0.1 Apr 07 98 0.2 1.1 Apr 06
The Allan and Nesta Ferguson Charitable Trust 59 3.8 23.3 Dec 08 55 3.5 39.5 Dec 07 30 5.7 46.9 Dec 06 23 5.4 42.2 Dec 05
Volant Charitable Trust 60 3.7 38.4 Apr 09 42 4.5 49.0 Apr 08 67 2.5 41.1 Apr 07 28 5.1 33.2 Mar 06
The Hobson Charity Limited 61 3.7 0.1 Mar 09 49 4.1 0.6 Mar 08 46 3.7 0.8 Mar 07 44 3.6 0.1 Mar 06
A W Charitable Trust 62 3.6 61.7 Jun 09 47 4.1 54.5 Jun 08 75 2.2 49.0 Jun 07 55 3.1 45.6 Jun 06
Joseph Rowntree Foundation 63 3.5 201.7 Dec 08 35 5.4 269.8 Dec 07 36 5.4 265.3 Dec 06 26 5.2 243.1 Dec 05
The Dulverton Trust 64 3.4 58.5 Mar 09 65 2.9 79.7 Mar 08 57 3.0 86.6 Mar 07 42 3.9 83.5 Mar 06
The Ernest Cook Trust 65 3.3 75.8 Mar 09 56 3.3 82.2 Mar 08 63 2.7 82.8 Mar 07 58 2.8 67.1 Mar 06
The Raphael Freshwater Memorial Association Ltd 66 3.2 58.9 Mar 09 85 2.1 38.5 Mar 08 51 3.2 47.8 Mar 07 86 1.4 41.0 Mar 06
M & R Gross Charities Limited 67 3.2 0.0 Mar 09 57 3.1 26.0 Mar 08 53 3.2 24.8 Mar 07 24 5.3 23.5 Mar 06
Rachel Charitable Trust 68 3.2 11.4 Jun 08 63 2.9 8.6 Jun 07 73 2.2 10.5 Jun 06 69 2.1 5.1 Jun 05
The Dyna & Fala Weinstock Charitable Trust 69 3.1 8.9 Apr 08 98 1.1 10.0 Apr 07 96 0.6 9.8 Apr 06 91 1.1 7.8 Apr 05
The Barrow Cadbury Trust 70 3.1 59.6 Jul 09 76 2.4 80.2 Jul 08 87 1.4 83.2 Jul 07 56 3.0 77.8 Jul 06
The Sir Jules Thorn Charitable Trust 71 3.1 79.9 Dec 08 74 2.4 107.6 Dec 07 68 2.4 101.3 Dec 06 68 2.1 92.8 Dec 05
The Dunhill Medical Trust 72 3.1 74.6 Mar 09 59 3.1 86.1 Mar 08 52 3.2 89.6 Mar 07 57 2.9 87.8 Mar 06
Shlomo Memorial Fund Limited 73 3.1 35.2 Sep 08 66 2.8 41.5 Sep 07 61 2.8 38.4 Sep 06 72 2.1 32.7 Sep 05
The Buttle Trust 74 3.1 34.2 Mar 09 61 3.0 45.5 Mar 08 62 2.8 48.3 Mar 07 66 2.2 45.9 Mar 06
J Paul Getty Jnr General Charitable Trust 75 3.0 44.4 Dec 08 71 2.5 57.2 Dec 07 86 1.8 54.8 Dec 06 70 2.1 50.1 Dec 05
The Wates Foundation 76 3.0 20.1 Mar 09 64 2.9 32.3 Apr 08 69 2.4 35.3 Apr 07 75 2.0 36.9 Apr 06
P F Charitable Trust 77 2.9 80.2 Mar 09 68 2.7 100.0 Mar 08 41 4.5 101.4 Mar 07 50 3.2 101.2 Mar 06
The Headley Trust 78 2.9 61.5 Dec 08 44 4.4 78.9 Dec 07 54 3.2 76.8 Dec 06 65 2.2 67.8 Dec 05
The Peter De Haan Charitable Trust 79 2.9 16.3 Apr 09 91 1.9 23.3 Apr 08 65 2.6 24.5 Apr 07 78 1.7 26.4 Apr 06
The Gosling Foundation Limited 80 2.8 17.6 Mar 09 89 1.9 92.4 Mar 08 56 3.1 94.6 Mar 07 52 3.1 90.8 Mar 06
The David & Elaine Potter Charitable Foundation 81 2.8 22.1 Dec 08 100 0.2 18.2 Dec 07 92 1.1 16.4 Dec 06 93 0.7 17.6 Dec 05
The Childwick Trust 82 2.6 57.7 Apr 09 62 3.0 68.9 Apr 08 58 2.9 73.6 Apr 07 61 2.4 70.2 Apr 06
Clydpride Limited 83 2.6 11.7 Dec 08 95 1.5 11.0 Dec 07 93 1.0 9.7 Jun 06 62 2.3 7.4 Jun 05
Samuel Sebba Charitable Trust 84 2.6 41.8 Apr 09 75 2.4 56.3 Apr 08 55 3.1 54.9 Apr 07 83 1.6 50.5 Apr 06
Four Acre Trust 85 2.5 6.3 Mar 09 77 2.3 9.7 Mar 08 78 2.2 2.2 Mar 07 89 1.1 12.2 Mar 06
Bernard Sunley Charitable Foundation 86 2.5 58.5 Mar 09 84 2.2 76.0 Mar 08 81 1.9 84.6 Mar 07 82 1.6 77.9 Mar 06
The Michael Uren Foundation 87 2.5 40.6 Apr 09 82 2.2 56.3 Apr 08 95 0.6 65.0 Apr 07 92 1.0 11.3 Apr 06
The Sobell Foundation 88 2.4 49.1 Apr 09 45 4.2 59.4 Apr 08 59 2.8 63.7 Apr 07 54 3.1 59.0 Apr 06
David & Frederick Barclay Foundation 89 2.3 0.0 Dec 08 99 0.3 0.2 Dec 07 94 0.9 0.5 Dec 06 90 1.1 0.5 Dec 05
Eveson Charitable Trust 90 2.3 50.8 Mar 09 72 2.5 71.8 Mar 08 76 2.2 74.1 Apr 07 64 2.2 71.2 Apr 06
Jerusalem Trust 91 2.3 67.1 Dec 08 90 1.9 85.3 Dec 07 79 2.0 80.5 Dec 06 67 2.2 70.0 Dec 05
The Pilgrim Trust 92 2.3 47.5 Dec 08 54 3.6 61.9 Dec 07 82 1.9 60.7 Dec 06 84 1.6 56.4 Dec 05
The Carnegie UK Trust 93 2.3 28.8 Dec 08 73 2.4 41.0 Dec 07 72 2.2 44.1 Dec 06 85 1.5 38.4 Dec 05
Samworth Foundation 94 2.3 4.1 Apr 09 67 2.7 5.1 Apr 08 89 1.3 3.9 Apr 07 94 0.6 3.9 Apr 06
The Botnar [Camelia] Foundation 95 2.2 62.3 Dec 08 83 2.2 67.2 Dec 07 49 3.3 65.0 Dec 06 74 2.0 64.5 Dec 05
The Joseph Rank Trust 96 2.2 61.9 Dec 08 80 2.3 78.1 Dec 07 74 2.2 78.6 Dec 06 76 1.8 71.8 Dec 05
The Zochonis Charitable Trust 97 2.2 76.3 Apr 09 86 2.1 92.3 Apr 08 83 1.9 87.4 Apr 07 79 1.7 71.0 Apr 06
Hadley Trust 98 2.2 62.2 Mar 09 78 2.3 69.4 Mar 08 77 2.2 69.2 Mar 07 73 2.0 64.4 Mar 06
Lancaster Foundation 99 2.2 50.5 Mar 09 46 4.2 50.7 Mar 08 60 2.8 53.4 Mar 07 60 2.6 53.0 Mar 06
RESULTS – UK FAMILY FOUNDATION GIVING 2008/09 23
Name 2008/09 (or most recent) 2007/08 (or previous) 2006/07 (or previous) 2005/06 (or previous)
Rank Charitable
Exp £m Net Assets £m Fiscal year end Rank Charitable Exp £m Net Assets £m Fiscal year end Rank Charitable Exp £m Net Assets £m Fiscal year end Rank Charitable Exp £m Net Assets £m Fiscal year end
The Gannochy Trust 51 4.2 107.1 May 09 33 5.8 104.4 May 08 22 6.8 136.3 May 07 49 3.2 104.4 May 06
The Gertner Charitable Trust 52 4.1 5.8 Mar 09 23 7.7 6.8 Mar 08 17 8.1 –2.7 Mar 06 22 5.6 2.3 Mar 05
The Rothschild Foundation (Europe) 53 4.0 60.2 Dec 08 52 3.9 72.2 Dec 07 47 3.5 68.2 Dec 06 63 2.2 67.2 Dec 05
The Tubney Charitable Trust 54 3.9 28.0 Mar 09 24 7.4 29.4 Mar 08 31 5.6 36.1 Mar 07 36 4.6 37.5 Mar 06
The Sutton Trust 55 3.9 1.4 Dec 08 81 2.2 0.8 Dec 07 88 1.3 1.6 Dec 06 81 1.7 1.2 Dec 05
The Parthenon Trust 56 3.9 0.3 Dec 08 50 4.0 1.6 Dec 07 34 5.5 0.4 Dec 06 17 6.4 0.2 Dec 05
The Smith Martin Smith Foundation 57 3.8 0.2 Apr 09 97 1.1 3.2 Apr 08 97 0.2 0.2 Apr 07 97 0.2 0.1 Apr 06
The Alan Howard Charitable Trust 58 3.8 3.0 Apr 09 94 1.6 0.0 Apr 08 80 2.0 –0.1 Apr 07 98 0.2 1.1 Apr 06
The Allan and Nesta Ferguson Charitable Trust 59 3.8 23.3 Dec 08 55 3.5 39.5 Dec 07 30 5.7 46.9 Dec 06 23 5.4 42.2 Dec 05
Volant Charitable Trust 60 3.7 38.4 Apr 09 42 4.5 49.0 Apr 08 67 2.5 41.1 Apr 07 28 5.1 33.2 Mar 06
The Hobson Charity Limited 61 3.7 0.1 Mar 09 49 4.1 0.6 Mar 08 46 3.7 0.8 Mar 07 44 3.6 0.1 Mar 06
A W Charitable Trust 62 3.6 61.7 Jun 09 47 4.1 54.5 Jun 08 75 2.2 49.0 Jun 07 55 3.1 45.6 Jun 06
Joseph Rowntree Foundation 63 3.5 201.7 Dec 08 35 5.4 269.8 Dec 07 36 5.4 265.3 Dec 06 26 5.2 243.1 Dec 05
The Dulverton Trust 64 3.4 58.5 Mar 09 65 2.9 79.7 Mar 08 57 3.0 86.6 Mar 07 42 3.9 83.5 Mar 06
The Ernest Cook Trust 65 3.3 75.8 Mar 09 56 3.3 82.2 Mar 08 63 2.7 82.8 Mar 07 58 2.8 67.1 Mar 06
The Raphael Freshwater Memorial Association Ltd 66 3.2 58.9 Mar 09 85 2.1 38.5 Mar 08 51 3.2 47.8 Mar 07 86 1.4 41.0 Mar 06
M & R Gross Charities Limited 67 3.2 0.0 Mar 09 57 3.1 26.0 Mar 08 53 3.2 24.8 Mar 07 24 5.3 23.5 Mar 06
Rachel Charitable Trust 68 3.2 11.4 Jun 08 63 2.9 8.6 Jun 07 73 2.2 10.5 Jun 06 69 2.1 5.1 Jun 05
The Dyna & Fala Weinstock Charitable Trust 69 3.1 8.9 Apr 08 98 1.1 10.0 Apr 07 96 0.6 9.8 Apr 06 91 1.1 7.8 Apr 05
The Barrow Cadbury Trust 70 3.1 59.6 Jul 09 76 2.4 80.2 Jul 08 87 1.4 83.2 Jul 07 56 3.0 77.8 Jul 06
The Sir Jules Thorn Charitable Trust 71 3.1 79.9 Dec 08 74 2.4 107.6 Dec 07 68 2.4 101.3 Dec 06 68 2.1 92.8 Dec 05
The Dunhill Medical Trust 72 3.1 74.6 Mar 09 59 3.1 86.1 Mar 08 52 3.2 89.6 Mar 07 57 2.9 87.8 Mar 06
Shlomo Memorial Fund Limited 73 3.1 35.2 Sep 08 66 2.8 41.5 Sep 07 61 2.8 38.4 Sep 06 72 2.1 32.7 Sep 05
The Buttle Trust 74 3.1 34.2 Mar 09 61 3.0 45.5 Mar 08 62 2.8 48.3 Mar 07 66 2.2 45.9 Mar 06
J Paul Getty Jnr General Charitable Trust 75 3.0 44.4 Dec 08 71 2.5 57.2 Dec 07 86 1.8 54.8 Dec 06 70 2.1 50.1 Dec 05
The Wates Foundation 76 3.0 20.1 Mar 09 64 2.9 32.3 Apr 08 69 2.4 35.3 Apr 07 75 2.0 36.9 Apr 06
P F Charitable Trust 77 2.9 80.2 Mar 09 68 2.7 100.0 Mar 08 41 4.5 101.4 Mar 07 50 3.2 101.2 Mar 06
The Headley Trust 78 2.9 61.5 Dec 08 44 4.4 78.9 Dec 07 54 3.2 76.8 Dec 06 65 2.2 67.8 Dec 05
The Peter De Haan Charitable Trust 79 2.9 16.3 Apr 09 91 1.9 23.3 Apr 08 65 2.6 24.5 Apr 07 78 1.7 26.4 Apr 06
The Gosling Foundation Limited 80 2.8 17.6 Mar 09 89 1.9 92.4 Mar 08 56 3.1 94.6 Mar 07 52 3.1 90.8 Mar 06
The David & Elaine Potter Charitable Foundation 81 2.8 22.1 Dec 08 100 0.2 18.2 Dec 07 92 1.1 16.4 Dec 06 93 0.7 17.6 Dec 05
The Childwick Trust 82 2.6 57.7 Apr 09 62 3.0 68.9 Apr 08 58 2.9 73.6 Apr 07 61 2.4 70.2 Apr 06
Clydpride Limited 83 2.6 11.7 Dec 08 95 1.5 11.0 Dec 07 93 1.0 9.7 Jun 06 62 2.3 7.4 Jun 05
Samuel Sebba Charitable Trust 84 2.6 41.8 Apr 09 75 2.4 56.3 Apr 08 55 3.1 54.9 Apr 07 83 1.6 50.5 Apr 06
Four Acre Trust 85 2.5 6.3 Mar 09 77 2.3 9.7 Mar 08 78 2.2 2.2 Mar 07 89 1.1 12.2 Mar 06
Bernard Sunley Charitable Foundation 86 2.5 58.5 Mar 09 84 2.2 76.0 Mar 08 81 1.9 84.6 Mar 07 82 1.6 77.9 Mar 06
The Michael Uren Foundation 87 2.5 40.6 Apr 09 82 2.2 56.3 Apr 08 95 0.6 65.0 Apr 07 92 1.0 11.3 Apr 06
The Sobell Foundation 88 2.4 49.1 Apr 09 45 4.2 59.4 Apr 08 59 2.8 63.7 Apr 07 54 3.1 59.0 Apr 06
David & Frederick Barclay Foundation 89 2.3 0.0 Dec 08 99 0.3 0.2 Dec 07 94 0.9 0.5 Dec 06 90 1.1 0.5 Dec 05
Eveson Charitable Trust 90 2.3 50.8 Mar 09 72 2.5 71.8 Mar 08 76 2.2 74.1 Apr 07 64 2.2 71.2 Apr 06
Jerusalem Trust 91 2.3 67.1 Dec 08 90 1.9 85.3 Dec 07 79 2.0 80.5 Dec 06 67 2.2 70.0 Dec 05
The Pilgrim Trust 92 2.3 47.5 Dec 08 54 3.6 61.9 Dec 07 82 1.9 60.7 Dec 06 84 1.6 56.4 Dec 05
The Carnegie UK Trust 93 2.3 28.8 Dec 08 73 2.4 41.0 Dec 07 72 2.2 44.1 Dec 06 85 1.5 38.4 Dec 05
Samworth Foundation 94 2.3 4.1 Apr 09 67 2.7 5.1 Apr 08 89 1.3 3.9 Apr 07 94 0.6 3.9 Apr 06
The Botnar [Camelia] Foundation 95 2.2 62.3 Dec 08 83 2.2 67.2 Dec 07 49 3.3 65.0 Dec 06 74 2.0 64.5 Dec 05
The Joseph Rank Trust 96 2.2 61.9 Dec 08 80 2.3 78.1 Dec 07 74 2.2 78.6 Dec 06 76 1.8 71.8 Dec 05
The Zochonis Charitable Trust 97 2.2 76.3 Apr 09 86 2.1 92.3 Apr 08 83 1.9 87.4 Apr 07 79 1.7 71.0 Apr 06
Hadley Trust 98 2.2 62.2 Mar 09 78 2.3 69.4 Mar 08 77 2.2 69.2 Mar 07 73 2.0 64.4 Mar 06
Lancaster Foundation 99 2.2 50.5 Mar 09 46 4.2 50.7 Mar 08 60 2.8 53.4 Mar 07 60 2.6 53.0 Mar 06
24
: : : : : : : : : : : : : : : : : : : : : : : : : : : : : : : : : : : : : : : : : : : : : : : : : : : : : : : : : : : : : : : : : : : : : : : : : : : : : : : : : : : : : : : : : : : : : : : : : : : : : : : : : : : : : : : : : : : : : : : : : : : : : : : : : : : : : : : : : : : : : : : : : : : :
UK and US comparison:
3
family foundation giving 2008/09
This chapter presents updated annual figures for US giving, and compares results with those for the UK.
3.1
Comparing the UK with the US
In order to establish whether UK trends in family foundation giving are unique or part of a more general pattern, this chapter provides some comparison between UK and US family giving through foundations.
Data was drawn from figures for 2008/09 specially supplied by the Foundation Center, and from the very comprehensive reports and analyses of all types of foundation giving published by the Foundation Center itself.
The US has seen the emergence of a very thriving family foundation sector over the last two decades. There are approximately 38,000 family foundations in the US,14 and around
a third of those were created after 2000. There are no figures for the total number of family foundations in the UK, but estimates indicate there are probably around 10,000 general foundations altogether.15
3.2
Level and share of
giving in the US
The amount given in 2008/09 by the largest 100 US family foundations (by giving) was around three times the UK level, at $8.2 billion.
In spite of this contrast, the largest 100 family foundations represent a smaller share of all giving in the US than in the UK. US family foundations represent:
–19% of all foundation giving, compared with 46% in the UK (the main reason for this difference is the higher contribution of corporate foundations in the US);
–3% of all private giving, compared with 9% in the UK.
However, when all US family foundations are taken into consideration, their giving represents around 7% of all private giving.
These results show how UK philanthropy depends more heavily on the contribution of a small population of the largest family foundations than US philanthropy: in the US the
14 Foundation Center (2010),
http://foundationcenter.org/ findfunders/statistics
15 Although it is possible to
get figures from the Charity Commission Register on the number of charities who make grants as part of their operating
activity, there are no figures for the number of UK foundations whose principal activity is grantmaking. Using figures first compiled in
Charity Trends 1997, compiled
UK AND US COMPARISON: FAMILY FOUNDATION GIVING 2008/09 25
burden of supporting charitable activities appears more evenly shared by smaller family foundations, other independent and corporate foundations.
Figure 9 Share of all US foundation giving by foundation type
Gates
9%
Other top 100 family foundations 17% All other
foundations
74%
3.3
Trends in US family foundation giving
In spite of differences of scale between the US and the UK family foundation giving, there are similarities in the pattern of recent trends.
2006/07 As in the UK, there was a very large growth in family foundation giving between 2005/06
and 2006/07. In both countries this was due to the boom in the markets before the 2007 crash.
2007/08 Data on the largest 100 foundations for 2007/08 is not included in the study, but the Foundation Center has reported that US family foundation giving in general continued to grow in 2008, at about 10% in real terms. The largest 100 in the UK grew by 13%.
It has been noted that general family foundation growth far surpassed the rate for all US foundations in that year.16
A reason for this continuing 2008 growth might be that strong giving in one year in the US generally reflects the strength of the markets of the previous year, and the value of 5% of assets in that previous year.17 Similarly in the UK there is a time‑lag between changes in
investment income and charitable spending.
2008/09 Figures are not available yet that can show exactly what happened to the largest 100 US
family foundations in 2008/09, as many of the accounts in the table cover only part of this year. However, a drop of 8.4% (unadjusted) in general foundation giving was reported,18
and it is likely that family foundations will also have seen something of a fall. Several foundations had to close their funding programmes in this year because of investment losses resulting from the Bernard Madoff fraud.
This drop in all US foundation giving in 2008/09 echoed a drop experienced by foundations in the UK19 (8.4% and 1.2 % respectively, unadjusted).
16 Foundation Center (2010),
http://foundationcenter.org/ findfunders/statistics
17 J McLeod (2008) Recession
Giving: US v Australia F&P. http:// ozco.sendemail.com.au/download/
files/10465/573158/John+McLeo d_+Recession+giving+US+vs+ Australia.pdf
18 Foundation Center (2010),
http://foundationcenter.org/ findfunders/statistics
19 This result excluded the Big
Lottery Fund, whose spending patterns had been distorted by an unusually high level of dispersion the previous year, creating what looked like an exponential fall.
26 FAMILY FOUNDATION GIVING TRENDS 2010
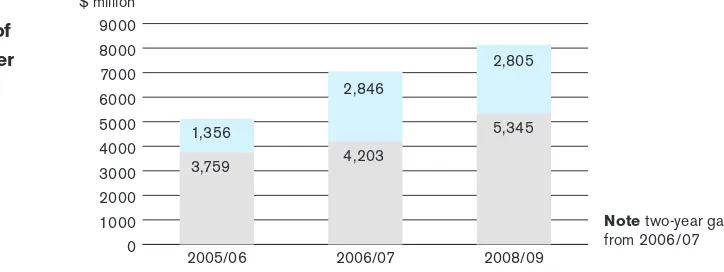
Figure 10
Trends in giving of Gates and of other top 100 family foundations
0 1000 2000 3000 4000 5000 6000 7000 8000 9000
2008/09 2006/07
2005/06 1,356
3,759
2,846
4,203
2,805
5,345
Note two-year gap
from 2006/07 $ million
3.4
Impact of Gates on the data
As in UK foundation figures, one trust – in this case the Bill & Melinda Gates Foundation – has a disproportionate effect.
Gates accounts for over a third of the giving of the largest 100 family foundations. Its giving more than doubled between 2005/06 and 2006/07, as it absorbed the huge additional assets donated by Warren Buffett, and this fuelled the rise recorded above in US family foundation giving that year.
Giving by the Gates Foundation levelled off in 2008, while other family foundation giving continued to grow. Gates increased its giving again in 2009, mitigating some of the loss experienced from other foundations,20 and its wealth is set to have a major impact in years to
come. It reports that:
‘For the next couple of years, we’ll continue on a steep climb to ramp up our grantmaking. Beginning in 2009 and continuing through the next decade, the payout target will be more than $3 billion per year, tightly focused on our major areas of investment – including global health, global development, and improving access to a great education and to technology in public libraries here in the United States.’21
3.5
Comparison of four‑year trends in UK and US
In both the UK and the US there was markedly higher real growth in the giving of family foundations over the four‑year study period than in other foundations. In the UK, real family foundation giving growth was 28%, compared with 15% for all foundations.
In both countries, family foundations’ share of all foundation giving increased over the period, by 4% in the UK and 6% in the US.
20 Foundation Center (2010),
http://foundationcenter.org/ findfunders/statistics
21 Bill & Melinda Gates Foundation,
[image:28.595.145.507.53.189.2]UK AND US COMPARISON: FAMILY FOUNDATION GIVING 2008/09 27
Figure 11 Four‑year comparative trends in giving, largest 100 UK and US
family foundations, 2005/2006 to 2008/09 UK
£ million
US $ million
Giving 2005/06 2008/09 real change 2005/06 2008/09 real change
Largest 100 family
foundations 998 1,397 28% 5,115 8,150 47%
All foundations 2,371* 3,010 15% 39,000 42,900 1.2%
Family foundations
as % of all 42% 46% 13% 19%
*Estimated
3.6
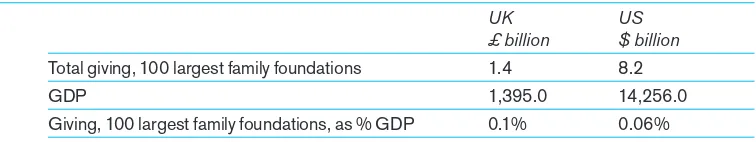
Giving as a share of Gross Domestic Product
This growth in family foundation giving appears to be reflected in its value as a percentage of GDP in both the UK and US.22
In the UK it went up to 0.1%, from 0.09% in one year. In the US, it went up from 0.05 to 0.06% over two years.
Figure 12 Giving as a proportion (%) of GDP
UK
£ billion US $ billion
Total giving, 100 largest family foundations 1.4 8.2
GDP 1,395.0 14,256.0
Giving, 100 largest family foundations, as % GDP 0.1% 0.06%
3.7
Comparison of trends in UK and US family foundation assets
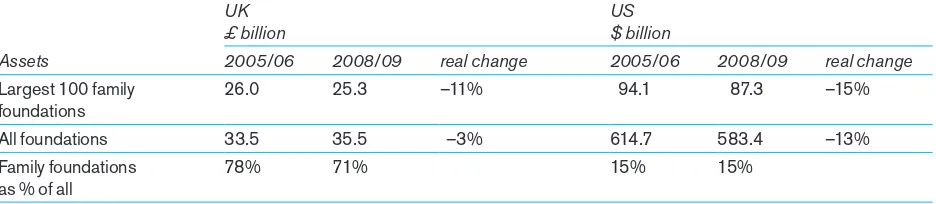
The largest 100 US family foundations have twice the assets of those in the UK.In both countries, however,the value of assets among this group appeared to take a much bigger knock over the four‑year period than those of other foundations. These figures may partly reflect the fact that family foundations in both countries rely more heavily than other foundations on invested endowments for their income.
In the UK the dependence is heavier than in the US. UKfamily foundation assets represented 78% of all foundation assets, compared with 15% in the US.
The findings suggest that family foundations in both countries were more able or willing to draw on their resources to maintain stability in their giving.While in both countries asset values were markedly down at the end of the four‑year period (Figure 13), giving showed an overall growth (Figure 11).
22 GDP data from International