LOW-COST WIRELESS SURFACE EMG SENSOR USING THE MSP430
MICROCONTROLLER
A. Beneteau
2, G. Di Caterina
1, L. Petropoulakis
1and J. J. Soraghan
11Department of Electrical and Electronic Engineering, University of Strathclyde, Glasgow, UK 2Institut National des Sciences Appliqu´ees, Rennes, France
ABSTRACT
Electromyography is the study of the voltage polarisation signals generated during body muscle contractions. Surface EMG is non-invasive and is ideal for applications such as training, rehabilitation and active prosthesis control. De-spite the progress in technology, myoelectric prostheses cur-rently on the market still adopt simple analog sensors. Digi-tal EMG acquisition is now common practice in research and academic institutions, but it involves fairly expensive pieces of equipment. This paper describes the implementation of a low-cost wireless surface EMG digital sensor based on the MSP430 microcontroller from Texas Instruments. The pro-posed acquisition system fully exploits the capabilities of the eZ430-RF2500 Development Tool to digitise surface EMG signals, transmit them wirelessly between nodes and finally read them into a PC for further processing. Experimental results demonstrate the effectiveness of the proposed system in acquiring sEMG signals for pattern recognition and real-time control.
1. INTRODUCTION
In physiology it is a well-known fact that body muscle con-tractions are associated with the generation of voltage po-larisation signals, travelling along the muscle fibres, from the muscle belly towards the extremities. Electromyography (EMG) is the study of such signals, which are generally re-ferred to as myoelectric or EMG signals [1].
There are two ways to record EMG signals from a mus-cle: one is to insert wired needles within the muscle (intra-muscular EMG); the other is to apply surface electrodes to the skin above the muscle (surface EMG - sEMG). The first option is usually used in medical and scientific studies, where highly accurate details of the physiology of the muscle are required, at a fibre-level. The second one instead is usually used in all those applications where just the presence and ba-sic characteristics of EMG signals (amplitude, shape) are of interest, as for example in sport training, rehabilitation and control.
Due to the non-invasive nature, surface EMG signals have been used to control active upper limb prostheses since 1960s [2, 3]. However the control strategy used was very basic: two analog electrodes were places on a pair of an-tagonistic muscles on the residual limb, and when the am-plitude recorded at one of the sensors was higher than the other, the myoelectric prosthesis would perform the function associated with the electrode, i.e. either open or close the fingers/gripper.
In the last decade, progress in mechanics and elec-tronics has allowed the manufacturing of smaller, lighter, faster and more human-resembling myoelectric prostheses,
PCB board Electrodes
MSP430
End Device
MSP430
Access
Point UART/USB
Computer
sEMGsensor
[image:1.595.315.539.208.339.2]MATLAB
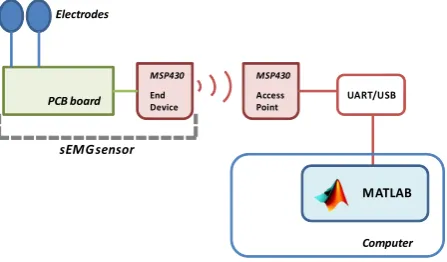
Figure 1: Wireless sEMG acquisition system.
wherein hand digits are individually powered. Nonentheless, the control mechanism in the majority of the commercially available myoelectric prostheses is still based on the ampli-tude of signals recorded from analog electrodes.
Only in more recent years digital acquisition of EMG sig-nals has become common practice in the research commu-nity. However, this involves sophisticated and fairly expen-sive pieces of equipment, making practical social use diffi-cult or prohibitive. To overcome this issue, researchers have started to build their own digital sensors for EMG acquisition [4, 5].
This paper describes the implementation of a low-cost wireless surface EMG digital sensor based on the MSP430 microcontroller from Texas Instruments [6]. Compared with similar work, the acquisition system described in this paper fully exploits the capabilities of the eZ430-RF2500 Devel-opment Tool [7] to first digitise the sensed analog sEMG signals, then to wirelessly transmit them to a central access point, and finally to easily read them into a PC for further processing. The only extra hardware needed consists of few inexpensive analog components for signal conditioning be-fore digitisation.
The rest of this paper is organised as follows. In section 2 implementation details of the proposed system are described. Experimental results are reported in section 3, while section 4 concludes the paper.
2. SYSTEM DESCRIPTION
Figure 2: Custom-made PCB for signal conditioning.
through the SimpliciTI protocol from TI [8]. The access point streams the received samples through the USB-based MSP430 Application UART to a PC, for further data pro-cessing.
2.1 Surface EMG acquisition
[image:2.595.57.282.72.155.2]The sEMG sensors has two main parts, namely a custom-made PCB for signal conditioning, and the MSP430 target board, where the conditioned analog EMG is digitised and wirelessly transmitted. A close-up of the PCB is shown in Figure 2.
As a surface EMG signal usually has very low amplitude, it is easily influenced by external noise and other artifacts, as for example the 50Hz interference from the power line. To reduce external influences, the bipolar, or differential, config-uration is usually used [1]. In this case two surface electrodes are placed on the muscle belly, while a reference electrode is placed on an EMG-inactive region, such as the elbow for ex-ample. This is the configuration used in the sEMG sensor described in this paper.
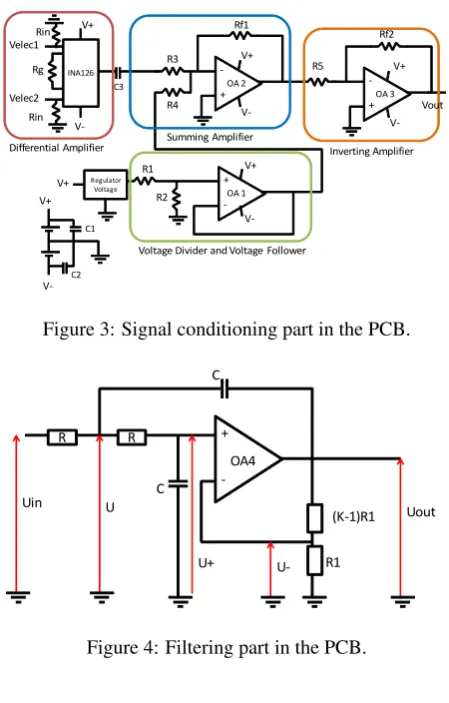
Concerning the common mode rejection, one could use the op-amp available on the MSP430 processor. However, as the ADC on the microcontroller can only digitase posi-tive voltages, some signal conditioning is required before the ADC stage. For this reason a custom-made PCB has been developed. The PCB has a signal conditioning part, as illus-trated in Figure 3, and a filtering part, as in Figure 4. The first block in Figure 3 is an INA126 differential amplifier from Texas Instruments, with a gainG=2000. The two resistors
Rinare required to avoid floating offsets present at the inputs
of the differential amplifier.
The positive offset required by the ADC is added to the EMG signal by the summing amplifier (OA2), while the volt-age follower (OA1) permits to have an output voltvolt-age with minimum current. Here the voltage regulator is an L78L33 from ST Microelectronics. Finally the inverting amplifier (OA3) corrects the sign of the signal in output from OA2. All the op-amps in th PCB are TL072’s from Texas Instru-ments. The capacitor C3 is added to remove the unwanted offset in output from the differential amplifier.
With regard to filtering, the bandwidth of a surface EMG signal is between 15−20 and 500Hz. Frequencies lower than 15Hz relate to motion artifacts due to the motion of the electrodes on the skin and the muscle underneath. On the other side, frequencies above 500Hz must be deleted, to avoid aliasing. Therefore, assuming a maximum frequency of fmax=500Hz, a sampling frequency of 1kHz is required.
To fulfill these bandwidth requirements, the PCB con-tains also high-pass (HP) and low-pass (LP) filters. The HP filter is represented by the capacitor C3 in Figure 3 and its value is such to have a cut-off at 15Hz. The LP filter is a 2nd
C1
C2
INA126
Regulator Voltage
V+ V+
V+
V+
V+
V+
V-Velec2 Velec1
+
+
+
-Rg
R1
R2 R3
R4
Rf1
Rf2
R5
C3
OA 1 OA 2
OA 3
Vout
Differential Amplifier Summing Amplifier Inverting Amplifier
Voltage Divider and Voltage Follower Rin
Rin
Figure 3: Signal conditioning part in the PCB.
C
(K-1)R1
R R +
-C
OA4
Uin U
U+
U-Uout
[image:2.595.314.538.73.231.2]R1
Figure 4: Filtering part in the PCB.
order Butterworth filter implemented with an op-amp (OA4) and resistors and capacitors only. A diagram of such a filter is illustrated in Figure 4. Also in this case the values of R and C in the LP filter are such that the cut-off frequency is
fc=450Hz.
Finally the filtered sEMG signal in input to the MSP430 target board is quantised into discrete levels by the ADC on the microcontroller. As the ADC uses 10 bits and its voltage references areVR−=0V andVR+=3.3V, the quantisation levels for the input signalVinare calculated as in (1):
VADC= (210−1)×
Vin−VR− VR+−VR−
(1)
On the MSP430, Timer A and the ADC are set to sample
Vinat fs=2fc=900. As a visual feedback to the user, the
green LED on the target board lights up as soon as the sensor is switched on, while the red LED instead light up when the digitised signal is higher than 75% or lower than 25% of the ADC scale range.
2.2 Data communication
The communication between the sEMG sensor and the access point uses the built-in wireless capability of the ez430-RF2500 Development Tool, which is equipped with a CC2500 wireless transceiver. This allows a maximum trans-mission rate of 500kBaud. At software level, the communi-cation relies on the TI proprietary SimpliciTI protocol [8], which is a low-power RF protocol ideal for small networks, i.e. less than 100 nodes.
[image:2.595.314.536.241.373.2]device is established, the sEMG sensor starts transmitting the digitised samples into packets of 10 bytes. As the ADC on the MSP430 uses 10 bits, it would be inefficient to transmit two bytes (16 bits) for each digitised sample (10 bits). There-fore, to optimise the transmission rate and at the same time to avoid complex data packing operations, only the 8 left-most bits of each 10-bit sample are transmitted, therefore using just 1 byte per sample. This implies a double bit-wise right shift of each sample value. Although some precision is lost, calculations confirm that the maximum error introduced is 12.88mV, which is negligible compared to the output signal voltage (0−3.3V). On the PC, a simple multiplication by 4 of each received sample restores the data to its original scale. The access point receives data packets via wireless and retransmit them over the USB-based serial port. For each byte the MSP430 Application UART adds 1 stop bit, so the total bit rate on the serial port is 8100bps, which is below the hardware limit of 9600bps of the ez430-RF2500 Devel-opment Tool. As results reported in section 3 demonstrate, this setup allows to transmit data from a wireless sEMG sen-sor to the access point and then to a PC-based application, with a negligible loss of samples. This loss is caused by the single thread nature of the current implementation of the ac-cess point, as it can be proved that there is no packet loss in the wireless link between end device and access point.
2.3 Extension for multiple electrodes
In order to simultaneously record from multiple sEMG sen-sors, no changes are required in the end device described above. Instead, the implementation of the access point re-quires some modification, in order to correctly separate wire-less packets coming from different sensors.
When a packet is received, the access point adds to it a 2-byte header, where the first byte is a simple “0” character, acting as a delimiter to transmit the data to the PC over the serial port; instead the second byte is the ID of the sensor which transmitted the packet. However, to prevent confusion between the “0” in the header and possible “0” values in the data field of the packet, each “0” representing EMG data is replaced with a “1”. As “0” in the data is the negative satu-ration value of the recorded EMG signal, replacing “0” with “1” has the mere effect of slightly increasing the negative sat-uration threshold. Nonetheless, as a “0” represents data that has already been clipped, a further clipping of 1 step does not introduce significant new distortion in the EMG.
With respect to packet separation, there is no risk of los-ing or misinterpretlos-ing “0” delimiters, as transmission errors over the serial connection are highly unlikely. Indeed, if any problem occurs on the serial port, the serial communication is interrupted altogether.
At PC side, the serial data read from the USB port is di-vided into separate packets, based on “0” delimiters. Finally, packets are sorted upon their sensor ID, in order to correctly reassemble data streams coming from different sEMG sen-sors.
Some experiments have been carried out to test the cor-rectness of the multi-sensor communication protocol, as re-ported in section 3. However, due to the hardware limita-tion of 9600bps in the ez430-RF2500 Development Tool, the sampling frequency in such experiments has been decreased to fs0=300Hz, in order to have two sensors transmitting at the same time. The reported results again show that data is
0 0.02 0.04 0.06 0.08 0.1
2 2.2 2.4 2.6
seconds
Volts
Time domain
(a)
0 200 400 600 800
0 0.2 0.4 0.6 0.8 1
X: 209.5 Y: 1
Hertz
Normalised amplitude
Frequency domain
[image:3.595.309.545.72.172.2](b)
Figure 5: Recorded test sinusoid at f1=210Hz (a) and its
spectrum (b).
0 0.5 1 1.5 2
0 0.5 1 1.5 2 2.5 3 3.5
seconds
Volts
Time domain
(a)
0 100 200 300 400
0 0.2 0.4 0.6 0.8 1
Hertz
Normalised amplitude
Frequency domain
(b)
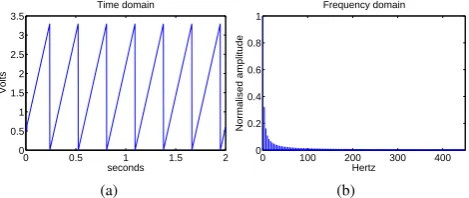
Figure 6: Artificial sawtooth signal (a) and its spectrum (b).
correctly sent from both end devices to the PC-based appli-cation, through the access point, with a sample loss of less than 1%. It is expected that an implementation of the ac-cess point using a different version of the MSP430 micro-controller, with higher UART bit rate allowance, would be able to record from multiple sEMG sensors simultaneously, at full sampling frequency (fs=900Hz).
3. EXPERIMENTAL RESULTS
As first experiment, a single sinusoid at f1=210Hz from a
signal generator is fed into the sEMG sensor through the PCB board. This analog signal is digitised in the end device (ED) and transmitted wirelessly to the access point (AP), which in turn streams the data to Matlab, through the USB. Time and frequency plots of the sinusoid are illustrated in Figure 5. Here it can be seen that no major distortion is introduced in the signal, as its frequency spectrum contains basically only one significant component, indeed located at 210Hz. The other components in Figure 5b are the 50Hz interference and its harmonics. These can easily be removed in software with a comb filter.
To try and quantify the loss of samples, if any, within the recording chain ED-AP-Matlab, an artificial sawtooth signal is generated within the ED, using a single byte counter, from 0 to 255 and wrapping around (Figure 6). This signal is again transmitted to the AP, and from there to Matlab. It has been found that no packets are lost over the wireless link, while a very small number of samples (<0.1%) is lost in the serial port communication. Nonetheless, such a loss is so small that it can be comfortably considered as negligible.
[image:3.595.311.546.221.320.2]pres-(a) (b)
Figure 7: Surface electrodes on the muscle belly (a) and ref-erence electrode on EMG-inactive region (b).
10 20 30 40
2 2.1 2.2 2.3 2.4 2.5 2.6
seconds
Volts
Time domain
(a)
0 100 200 300 400
0 0.2 0.4 0.6 0.8 1
Hertz
Normalised amplitude
Frequency domain
[image:4.595.309.525.71.285.2](b)
Figure 8: Recorded surface EMG signal (a) and its spectrum (b).
(a) (b) (c) (d)
Figure 9: Recorded gestures: CLOSE (a), FLEXION (b), PINCH (c), PINKY (d).
ence of the 50Hz interference.
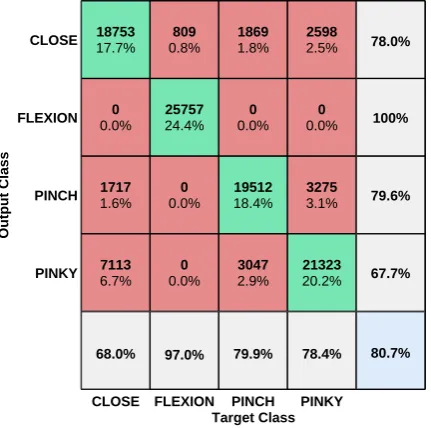
To demonstrate that the recorded EMG signals do carry useful information, pattern recognition has been used in or-der to classify four gestures performed by a volunteer. Such gestures are CLOSE, FLEXION, PINCH and PINKY, and they are illustrated in Figure 9. For this experiment, the part of the signal corresponding to each repeat (5 in this case) of a gesture is divided into blocks of 300ms, with 50% overlap. Then features are extracted from each block. Such features are Mean Absolute Value, Sign Slope Change, Waveform Length and Zero Crossings [9]. The extracted feature vec-tors are divided, gesture-wise, into training (80%) and test-ing (20%) data, and Linear Discriminant Analysis (LDA) is used as classifier. The selection of training and testing data is random and it is repeated 1000 times, so the average of the 1000 classification percentages obtained is the final score for the classification process. The value of 1000 has been chosen experimentally, as it has been noticed that the clas-sification percentages tend to converge to the average score, between 500 and 1000 iterations. The confusion matrix for this experiment is reported in Figure 10, with an overall score of 80.7%. Although this value may seem low, it should be
CLOSE FLEXION PINCH PINKY CLOSE
FLEXION
PINCH
PINKY 18753
17.7%
0
0.0%
1717
1.6%
7113
6.7%
68.0% 809
0.8%
25757
24.4%
0
0.0%
0
0.0%
97.0% 1869
1.8%
0
0.0%
19512
18.4%
3047
2.9%
79.9% 2598
2.5%
0
0.0%
3275
3.1%
21323
20.2%
78.4%
78.0%
100%
79.6%
67.7%
80.7%
Target Class
[image:4.595.54.291.220.321.2]Output Class
Figure 10: Confusion matrix.
0 0.02 0.04 0.06 0.08 0.1
1.8 2 2.2 2.4 2.6 2.8
seconds
Volts
Time domain (signal 1)
(a)
0 100 200 300
0 0.2 0.4 0.6 0.8 1
X: 121.9 Y: 1
Hertz
Normalised amplitude
Frequency domain (signal 1)
(b)
0 0.02 0.04 0.06 0.08 0.1
1.8 2 2.2 2.4 2.6 2.8
seconds
Volts
Time domain (signal 2)
(c)
0 100 200 300
0 0.2 0.4 0.6 0.8 1
X: 121.9 Y: 1
Hertz
Normalised amplitude
Frequency domain (signal 2)
[image:4.595.310.544.307.516.2](d)
Figure 11: Test sinusoid recorded with two channels: chan-nel one (a-b) and chanchan-nel two (c-d).
noted that only one channel, i.e. one sEMG sensor, has been used. It is expected that using two or more channels can con-siderably increase the classification score. Nonetheless, this experiment demonstrates that the sEMG signal recorded with the sensor described in this paper contain useful information, which can be used as control mechanism in human-machine interfaces.
[image:4.595.50.287.370.459.2]the time domain are not identical, obviously due to unsyn-chronised sampling and to intrinsic differences in the PCB. However, the frequency spectra are very similar, apart from a negligile difference in the relative amplitude of the 122Hz sinusoid compared to the other interference components in the signals. This proves that the sEMG recording system de-scribed in this paper is suitable also for multi-channel acqui-sition.
4. CONCLUSION
In this paper a low-cost wireless sEMG digital sensor based on ez430-RF2500 Development Tool version of the MSP430 microcontroller has been implemented and tested, to trans-mit lower arm EMG signals for the purpose of performing a pattern recognition. Using just one surface EMG sensor an overall score of over 80% was recorded. The results illus-trate that this low-cost wireless implementation of EMG sig-nal acquisition and processing can provide substantially good results. Despite EMG signals have been recorded from a sin-gle channel, indications have been given on how to expand the system to accommodate recording from multiple chan-nels; experimental results concerning this aspect suggest the feasibility of the proposed approach. Plans for future work include the computation of EMG features within the end de-vice, to avoid sending all the acquired sample and therefore to save bandwidth on the wireless link and on the serial port. Another future work direction is to replace the current im-plementation of the access point based on the ez430-RF2500 Development Tool, with one using a device with less strin-gent hardware limitation in terms of bit rate, as for example the MSP430FG4618/F2013 Experimenter Board. This is to allow simultaneous multi-channel sEMG recording.
REFERENCES
[1] R. Merletti and P. Parker, Electromyography: physiol-ogy, engineering, and non-invasive applications. Wiley-IEEE Press, 2004.
[2] N. Jiang, S. Dosen, K.-R. Muller, and D. Farina, “My-oelectric control of artificial limbs - is there a need to change focus?,” IEEE Signal Processing Magazine, vol. 29, no. 5, pp. 152–150, 2012.
[3] A. Fougner, O. Stavdahl, P. J. Kyberd, Y. G. Losier, and P. A. Parker, “Control of upper limb prostheses: termi-nology and proportional myoelectric control - a review,”
IEEE Transactions on Neural Systems and Rehabilita-tion Engineering, vol. 20, no. 5, pp. 663–677, 2012. [4] R. Naima and J. Canny, “The berkeley tricorder:
Ambu-latory health monitoring,” inWearable and Implantable Body Sensor Networks, 2009. BSN 2009. Sixth Interna-tional Workshop on, pp. 53–58, June 2009.
[5] K. M. Chang, S. H. Liu, and X. H. Wu, “A wireless sEMG recording system and its application to muscle fa-tigue detection,”Sensors, vol. 12, pp. 489–499, 2012. [6] Texas Instruments, “SLAU144E - MSP430x2xx Family
User’s Guide,” 2008.
[7] Texas Instruments, “SLAU227B - eZ430-RF2500 De-velopment Tool User’s Guide,” April 2008.
[8] Texas Instruments, “SimpliciTI - RF Software protocol.” http://www.ti.com/corp/docs/landing/simpliciTI/. [9] B. Hudgins, P. Parker, and R. N. Scott, “A new strategy