Regulation of ethanol metabolism in isolated rat hepatocytes : a thesis presented in partial fulfilment of the requirements for the degree of Doctor of Philosophy at Massey University
163
0
0
Full text
(2) REGULATION OF ETHANOL MET ABOLIS M IN ISOLATED RAT HEPATOCYTES. A thesis presented in partial fulfilment of the. requirements for the degree of Doctor of Philosophy C at Massey University. RACHELAUDREYPAGE 1990.
(3) }{;} !:> s ey U n i v er s i t y Title. of. ..: -a=ry...L:. =L i:.:b::.r. .. i-"-'g.cc:. Lh:...t_F C_ ..o-'p�ycr:::. _o_ro_ .: s. _ :... :::. ....i ..e_.. s Th :... __.=...c.. thesis: tl?. (l). (n). give permission for my .thesis to be made <lV<liL::ll.>le eo readers in the Hassey University LibrarJ under cotH.ii tionc; determined by t he Librarian.. I. I do not �ish WJ thesis to be made available to rc�dcrs months. ____.. �ichout my vritten consent for. (2). (a). � (3). (a). �. r·agree that my thesis, or a copy, may be sent to a n o t h e r institution under conditions de termincd .. _b the Libr�rian.. Y. do not �ish my thesis, or a copy, to be sent to another institution �ithout my vritten consent for month:.:. -I. I agree that my thesis may be copied I. do. not. for Libn.ry. vish my thesis to be copied for L i br a ry own ths. '•. u�e. U!.ie. I. copyright of this thesis belongs to the author. Rcaclcrs �ust sign their nat::JC in the spncc belo\.1 to sho\.1 thnt they recognise this. They are asked to add their penn.anent nddrcss.. The. DATE. NAHE MID ADDRESS. ,.. : �.: .'i. .--· -� - ..... h:Ji S: ....... 0. w t::-t:t.L.�.liLL •••. for.
(4) 11. ABSTRACT. The importance of an individual step in the regulation of a metabolic pathway can be quantitatively defined by determining a global coefficient called the flux control coefficient. (�i).. The coefficient. can be evaluated by altering the pathway flux in small increments using an enzyme-specific inhibitor. This modulation approach was applied to the study of the regulation of ethanol metabolism in isolated rat hepatocytes.. A procedure was developed for using isolated hepatocytes to measure the small decreases in rates of ethanol oxidation produced by increasing concentrations of inhibitor. The method, termed the two time point method, involved the incubation of replicate 1 ml or 2 ml samples in 10. ml. erlenmeyer flasks containing cells, medium and substrates with varying inhibitor concentrations (including zero to provide a control rate).. Using this method, the apparent flux control coefficient of. ADH in hepatocytes isolated from. starved rats was determined using two inhibitors, tetramethylene sulphoxide (TMSO) and isobutyrarnide (IsB).. Using the initial slope of the flux inhibition curve and the appropriate. inhibition constant determined for isolated. ADH, the apparent. cinH was calculated to be 0.37 ±. 0.09 (from inhibition by TMSO) or 0.43 ± 0.10 (from inhibition by IsB). The good agreement in the value obtained for the flux control coefficient of. ADH, using two different inhibitors, showed. that the method developed for measuring small changes in ethanol clearance rates was providing accurate, reproducible results.These flux control coefficients were calculated on the assumption that the. ADH reaction is a one substrate, one product reaction.. coefficient of acetaldehyde. apparent. The apparent flux control. ADH was then corrected for the concentration effect of NAD+, NADH and When substrate and product concentrations were considered, the value of the. cinH increased to a maximum of 0.53 (for TMSO inhibition) or 0. 63 (for IsB. inhibition). These results indicate that in starved rats the activity of the enzyme alcohol dehydrogenase is one of the major factors involved in regulation of ethanol metabolism.. The importance of. ADH in fed rats was determined using TMSO. A range of values for the flux. control coefficient of of. ADH was obtained with varying concentrations of acetaldehyde.. The value. �H was dependent on the concentration of acetaldehyde present in the isolated rat. hepatocytes. For example the apparent flux control coefficient of. ADH was about 0.02. when. the acetaldehyde concentration was 138 J..LM and was approximately 0.5 when the concentration of acetaldehyde was 6. J..LM , which is analogous to conditions in starved rats.. When the apparent. cl.oH was corrected for the effect of substrate and product concentration the trend of decreasing.
(5) 111. cinH with increasing acetaldehyde concentration was still observed.. This indicates that the. importance of alcohol dehydrogenase in regulation of ethanol metabolism, in hepatocytes isolated from fed rats, decreases with increasing acetaldehyde concentration. Obviously, as the significance of ADH in regulation of ethanol oxidation decreases, other enzymes in the ethanol pathway become more important. The most likely enzyme to have an increasing importance in the regulation of ethanol elimination, with increasing concentrations of acetaldehyde, is aldehyde dehydrogenase (AIDH). Preliminary inhibitor studies were carried out on AIDH in hepatocytes isolated from starved rats, using the irreversible inhibitor disulfiram. The flux control coefficient of aldehyde dehydrogenase was calculated to be about 0.1. However, because of the problems encountered with the preparation of disulfiram stock solutions, an alternative inactivator of aldehyde dehydrogenase was required for the inhibitor titration experiments. Diethyldithiocarbamate (DDC), a metabolite of disulfiram, was used. The results showed that inhibition of AIDH occurred in the presence of DDC and that the minimum amount of DDC required for total inhibiton of aldehyde dehydrogenase was in the concentration range of 300 �M to 500 �· Further studies should be carried out for determination of the initial slope of the flux inhibition curve, using DDC, so that the flux control coefficient of AIDH may be calculated. In chapter 6, a theoretical approach for determining the importance of the shuttle systems and electron transport chain in regulation of ethanol oxidation in rat hepatocytes is discussed. A literature search on possible inhibitors for the malate-aspartate shuttle, a-glycerophosphate shuttle and electron transport chain was carried out The results from this study show that it is possible to evaluate the importance of some of the individual steps in the ethanol pathway by using the modulation approach devised by Kacser and Burns. However the two time point method developed for measuring the small decreases in flux through the ethanol pathway imposed by increasing concentrations of inhibitor is only sensitive . enough to detect changes in flux as low as 8.0%. Enzymes that have low flux control coefficients will produce changes in flux of about 8.0%. Thus, the development of a more sensitive method for measuring the small changes in flux through the ethanol pathway is needed, or a method other than the modulation approach for calculating the flux control coefficient is required..
(6) lV. ACKNOWLEDGEMENTS. I would like to thank my supervisors, Dr K. E. Crow and Dr M. J. Hardman for their invaluable advice and encouragement when times were rough. Iwould like to say that I was lucky in having two very good supervisors. They were not only interested in the results produced during the course of my work but cared about my well being. Thanks Kathy and Mike.. I also wish to thank all my friends, especially Kathryn and John, for making my PhD years enjoyable.. Finally, I would like to thank my family, for their loving support, encouragement and help over the years. I could not have finished this thesis without it..
(7) V. Table of Contents. PAGE 11. ABSTRACT. IV. ACKNOWLEDGEMENTS. V. TABLE OF CONTENTS L IST OF FIGUR ES L IST OF TABLES CHAPIER 1. INT RO DUCTION 1.1. Metabolism of Ethanol. 1. 1.2. Regulation of Ethanol Metabolism. 3. 1.3. Theoretical Frameworks for the Study of Metabolic Control. 1.4. 7. 1.3.1. Biochemical Systems Theory ( BST ). 7. 1.3.2. Metabolic Control Theory ( MCI' ). 8. 1.3.3. Flux Oriented Theory ( POT ). 10. 1.3.4. Comparison of Theories. 11. Determination of Flux Control Coefficients. 13. CHAPI ER 2. MATERIALS AND METHODS. 2.1. Source of Materials and Reagents. 18. 2.2. Hydrolytic Enzymes. 18. 2.2.1. Collagenase. 18. 2.2.2. Hyaluronidase. 20. 2.3. Krebs-Henseleit (K-H) Buffer. 20. 2.3.1. Perfusion Medium. 20. 2.3.2. Cell Suspension Medium. 21.
(8) Vl. PAGE 2.4. 2.5. Bovine Serum Albumin (BSA) For Hepatocytes. 21. 2.4.1. Dialysis of BSA. 21. 2.4.2. Determination of Protein Concentration. 22. Preparation of Isolated Hepatocytes. 22. 2.5.1. Rats. 23. 2.5.2. Operative Technique. 23. 2.5.2.1 Surgical Procedure. 23. 2.5.3. Perfusion. 25. 2.5.4. Collection of Hepatocytes. 25. 2.5.5. Vena Cava Cannula. 26. 2.5.6. Perfusion L ung. 26. 2.5.7. Nylon Gauze Sieve. 27. 2.6. Cell Wet Weight. 27. 2.7. Criteria For Cell Integrity. 27. 2.7.1. Trypan Blue Exclusion Test. 28. 2.7.2. ATP Content. 28. 2.8. Incubation of Isolated Hepatocytes. 28. 2.9. Ethanol Assay. 29. 2.10. Acetaldehyde Assay. 29. 2.11. 2.10.1. Standard Acetaldehyde Solutions. 30. 2.10.2. Assay Reagents. 30. 2.10.3. Measurement. 30. 2.10.4. Maintenance of Apparatus. 31. ATP Assay. 31.
(9) vii. PAGE CHAPTER 3. DEVELOPMENT OF A METHOD FOR MEASUREMENT O F SMALL CHANGES IN RATES O F ETHANOL OXIDATION. 3.1. Background to Present Work. 32. 3.2. Two Time Point Method. 35. 3.2.1 3.2.2 3.3. 3.4. Procedure for Addition of Cell Suspension to Flasks and Incubation of Isolated Hepatocytes. 35. Calculation of Ethanol Clearance Rates. 37. Development of the Two Time Point Method. 42. 3.3.1. Incubation Mixture and Cell Suspension. 42. 3.3.1.1 Lactate and Pyruvate. 42. 3.3.1.2 Ethanol. 43. 3.3.1.3 Cell Content. 46. 3.3.2. Transfer of Cells to the Incubation Vessel. 47. 3.3.3. Cell Suspension Transfer and Gassing Procedure. 49. 3.3.4. Incubation Vessel. 50. 3.3.5. Incubation Vessel - Experimental Loss of Ethanol. 52. Conclusion. 55. CHAPTER 4. ALCOHOL DEHYDROGENASE. 4.1. Introduction. 59. 4.2. Tetramethylene Sulphoxide and Isobutyram:ide. 66. 4.3. 4.2.1. Type of Inhibition. 66. 4.2.2. Determination of Flux Control Coefficient. 68. The Use of Isolated Hepatocytes From Fed and Starved Rats. 69.
(10) vili. PAGE 4.4. 4.5. Experimental Results and Discussion. 69. 4.4.1. Starved Rats. 69. 4.4.2. Fed Rats. 78. Substrate and Product Concentration Effect on the Flux Control Coefficient. 83. 4.5.1. Correction of the Apparent. 4.5.2. Conclusion. c!ADH. 83 97. CHAP1ER 5. ALDEHYDE DEHYDROGENASE 5.1. Introduction. 98. 5.2. Experimental Results and Discussion. 100. CHAP1ER 6. S HUTTLE SYSTEMS AND ELECTRON TRANSPORT CHAIN 6.1. Shuttle Systems. 110. 6.2. Electron Transport Chain. 116. 6.3. Conclusion. 117. CHAP'IER 7. D IS C U S S I O N 7.1. Summary of Results. 119. 7.2. Problems. 122. 7.3. Future Work. 124.
(11) IX. PAGE 7.4. Conclusion. 126. REFERENCES. 127. APPENDIX. 143.
(12) X. List of Figures TITLE. FIGURE 1.1. PAGE. Schematic Diagram of the Interactions Between the Metabolism of Ethanol, Shuttle Systems, and Respiratory Chain. 4. 1.2. Steps in the Metabolism of Ethanol. 6. 2.1. Perfusion Apparatus. 24. 3.1. Graph of Expected Results Using the Two Time Point Method. 34. 3.2. Experimental Procedure for the Two Time Point Method. 36. 3.3. Extrapolation of Control Rate For Determination of the True Zero Time Ethanol Concentration. 39. 3.4. Graph of Ethanol Concentration vs Time for a TMSO Experiment. 56. 4.1. Ordered Bi-Bi Mechanism For Rat Liver ADH. 61. 4.2. Steady State Rate Equation For An Ordered Bi-Bi Mechanism. 63. 4.3. Dixon Plot for Tetramethylene Sulphoxide. 73. 4.4. Dixon Plot for Isobutyramide. 74. 4.5. Flux Inhibition Curve For Tetramethylene Sulphoxide. 75. 4.6. Flux Inhibition Curve For Isobutyramide. 76. 4.7. Flux Inhibition Curve For Tetramethylene Sulphoxide when [AcH] is low (11.3 �M). 4.8. Flux Inhibition Curve For Tetramethylene Sulphoxide when [AcH] is high (80.6 �M). 4.9. 79. 80. Graph of Flux Control Coefficient of ADH vs Acetaldehyde Concentration. 82. 5.1. Flux Inhibition Curve for Data of Crow et al. (1977a). 103. 5.2. Flux Inhibition Curve for Cell Preparation 3. 104. 5.3. Graph of Normalised Flux vs Diethyldithiocarbamate Concentration. 107. 6.1. Schematic Diagram of the a-Glycerophosphate Shuttle. 111. 6.2. Schematic Diagram of the Malate-Aspartate Shuttle. 112.
(13) XI. List of Tables TABLE. TITLE. PAGE. 1.1. Terminology in BST, MCT and FOT for Control Parameters. 11. 2.1. Materials and their Source. 19. 3.1. Percentage Inhibition of Ethanol Clearance Using Varying Concentrations of Tetrarnethylene Sulphoxide. 3.2. Amount of Ethanol Present in Control and Inhibitor Samples Incubated for the same Time. 3.3. 45. Results of Ethanol Utilisation for Incubation Mixtures Containing 50 or 60 % of the Original Hepatocyte Suspension. 3.8. 44. Ethanol Content Present Before and After Incubation Using Method 1 and 2 for Ethanol Transfer. 3.7. 41. The Viability of Cells Suspended With or Without Lactate and Pyruvate. 3.6. 40. Comparison of the % Inhibition Results Obtained Using the Averaged and Extreme Extrapolated True Zero Time Samples. 3.5. 38. Comparison of the Experimental and Extrapolated Ethanol Concentrations at True Zero Time. 3.4. 33. 48. Metabolic Viability and Cell Integrity For Cells Transferred by a Pwoo Gilson Pipetman or 2 ml Detipped Glass Pipette. 49. 3.9. Loss of Ethanol During the 20 second Gassing Step. 50. 3.10. Comparison of Ethanol Disappearance Rates and Percentage Inhibition Results With Plastic or Balsa Cork Stoppers. 51. 3.11. ATP Content of Hepatocytes Incubated in Flasks and Test Tubes. 53. 3.12. Ethanol Concentration Present in Flasks for Different Periods of Incubation. 54.
(14) Xll. TITLE. TABLE 3.13. Percentage Inhibition of Ethanol Clearance for the Two Time Point and Repeated Sampling Methods. 3.14. PAGE. 57. Advantages of the Two Time Point Method Compared to the Repeated Sampling Method. 58. 4.1. Characterisation of Rat Alcohol Dehydrogenase Isoenzymes. 60. 4.2. Kinetic Constants of Rat Liver Alcohol Dehydrogenase. 61. 4.3. The Relative Importance(. �. ) of Horse Liver ADH Isoenzymes. and the Mitochondrial and Cytosolic AIDH Isozymes in the Metabolism of Ethanol. 64. 4.4. Kinetic Constants for Inhibition of Alcohol Dehydrogenase. 67. 4.5. Combined Results for Inhibition by Tetramethylene Sulphoxide. 70. 4.6. Combined Results for Inhibition by Isobutyramide. 71. 4.7. Flux Control Coefficient of ADH and Inhibition Constant Determined Using the Combined Results for Inhibition by Tetramethylene Sulphoxide and Isobutyramide. 4.8. Table of Flux Control Coefficient of ADH with their Corresponding Acetaldehyde Levels. 4.9. Derived Equations For Substrate and Product Effect J on the. GillH. 4.10. Substrate (A,B) and Product(Q) Concentrations of ADH Reaction. 4.11. Effect of Both Substrates and Changing NADH Concentration on the Apparent. 81. 85 86. CADH Determined from Liver Cells Isolated from. Starved Rats. 4.12. 77. 88. Effect of Both Substrates and Changing Product Concentrations on the. CADH Evaluated from Liver Cells Isolated from Starved Rats. Assuming TMSO and IsB are Uncompetitive Inhibitors. 89.
(15) Xlll. TABLE 4. 1 3. TITLE. PAGE. Effect of Both Substrates and Changing Product Concentrations on the. CADH Evaluated from L iver Cells Isolated from Starved Rats. Assuming TMSO and IsB are Noncompetitive Inhibitors. 4.1 4. Effect of Both Substrates i n the Absence of Products o n the. 90. cinH. Evaluated from liver Cells Isolated from Fed Rats. 4.1 5. 91. Effect of Both Substrates and Changing NADH Concentration on the. cinH Evaluated from Liver Cells Isolated from Fed Rats Assuming TMSO is an Uncompetitive Inhibitor. 4.1 6. 92. Effect of Both Substrates and Changing NADH Concentration on the. cinH Evaluated from Liver Cells Isolated from Fed Rats Assuming TMSO is a Noncompetitive Inhibitor. 4.1 7. 93. Effect of Both Substrates and Changing Product Concentrations on the. cinH Evaluated from Liver Cells Isolated from Fed Rats Assuming TMSO is an Uncompetitive Inhibitor. 4.1 8. 94. Effect of Both Substrates and Changing Product Concentrations on the. cinH Evaluated from Liver Cells Isolated from Fed Rats Assuming TMSO is a Noncompetitive Inhibitor. 5.1. % Inhibition and Acetaldehyde Concentration with Increasing. Concentrations of Disulfiram in Hepatocytes from Starved Rats. 5.2. 1 02. The % Inhibition and Acetaldehyde Concentrations Obtained Using a Range of Diethyldithiocarbamate Concentrations. 7.1. 101. Flux Control Coefficient of AlDH in Hepatocytes Isolated from. Starved Rats. 5.3. 95. 106. Acetaldehyde Concentrations and Flux Control Coefficients of Alcohol Dehydrogenase for Hepatocytes Isolated from Fed and Starved Rats. 1 20.
(16) 1. CHAPTER!. INTRODUCTION. 1. 1. METABOLISM OF ETHANOL The main site of ethanol metabolism is the liver, although some other tissues such as. kidney, muscle, lung, intestine and possibly even the brain may metabolise ethanol to a small extent (Pawan,. 1 97 2). Ethanol elimination involves the oxidation of ethanol to acetaldehyde,. which in turn is oxidised to acetate. This last product enters the general metabolic pool through conversion to acetyl CoA.. Three different reaction mechanisms have been described for the first step in oxidation of ethanol in the liver. These are, the pathway catalysed by the NAD+-dependent alcohol dehydrogenase (Theorell & Bonnichsen, Hartree,. 1951), the pathway involving hydrogen peroxide and catalase (Keilin &. 1945; Rouch et al. , 1969; Isselbacher & Carter, 1 970) and the microsomal ethanol. oxidising system (MEOS) involving NADPH and cytochrome P-450 (Orme-Johnson & Ziegler,. 1965; Lieber & DeCarli, 1968, 1 970). Alcohol dehydrogenase, localised in the cytosolic compartment of the liver cell, is predominantly responsible for the transformation of ethanol to acetaldehyde (Hawkins & Kalant,. 1972; Rognstad. & Grunnet, 1 979; Cederbaum, 1980). The combined contribution of the non-ADH pathways to the metabolism of ethanol appears to be less than Rognstad & Grunnet,. 10% under normal conditions (Higgins, 1979;. 1979; Williamson & Tischler, 1 979). However, the role of the catalase and. :MEOS systems in the oxidation of ethanol is still the subject of debate.. Because :MEOS has a relatively high Km for ethanol of compared to. 8 to 10 mM (Lieber & DeCarli, 1972),. 0.5 to 2.0 mM for ADH (Comell et al., 1 979; Crabb et al., 1983), it may have a. significant role in ethanol oxidation at high levels of ethanol or after chronic ethanol consumption (Lieber & DeCarli,. 1968, 1 970). Inhibitor studies have supported this idea (Lieber & DeCarli,. 1970, 1 97 2; Grunnet et al., 1973; Matsuzaki et al., 198 1 ) but the evidence is not conclusive because the inhibitors used were not sufficiently specific. For example, the ADH inhibitor pyrazole will also inhibit :MEOS (Teschke et al.,. 1976; Takagi et al., 1986).. The availability of a mutant deermouse strain that lacks ADH (ADH- )but nevertheless actively oxidises ethanol (Bumett & Felder,. 1 978, 1 980; Shigeta et al., 1 984) has stimulated research into. the respective roles of catalase and :MEOS in non-ADH mediated ethanol metabolism (Shigeta et al.,. 1984 ; Takagi et al., 1986; Handler et al., 1986)..
(17) 2. Intrinsic isotope effects (Cronholm, 1985) were used to calculate flux through the ADH, MEOS, and catalase pathways (Tak:agi et al., 1986; Alderman et al., 1987). When ADH- deermice were treated with the catalase inhibitor 3-amino-1,2,4-triazole, there was no significant change in the rate of ethanol oxidation. This indicated that MEOS was the principal pathway for ethanol oxidation in vivo in ADH- deeimice. Even when ADH was present (ADH+ strain) , the results showed that non-ADH pathways (mostly MEOS) participated significantly in ethanol metabolism at all concentrations tested and played a major role at high levels. In rats, Vind and Grunnet (1985) determined the fate of 3H from [ 1_3H] ethanol and found that non-ADH pathways (primarily cyt P-450 dependent) made a significant contribution to hepatic ethanol oxidation, even in the presence of ADH.. From the above studies the involvement of catalase in hepatic ethanol metabolism appears to be minor. This can be attributed to the limited intracellular production of H20:2 (Boveris et al., 1972). However it has been demonstrated recently that ADH- deermice metabolise ethanol via catalase-H20:2 (Handler et al., 1986; Handler & Thurman, 1988) in addition to the dehydrogenase systems present in both ADH+ and ADH- deermice (Norsten et al., 1989).. The contradictions represented in the above studies concerning the importance of non-ADH pathways in ethanol oxidation, heighten the uncertainty of the physiological significance of MEOS and catalase pathways in the metabolism of ethanol. In view of this the quantitative importance of non-ADH pathways in the regulation of ethanol metabolism was not considered in this study.. The second step of ethanol elimination, which involves the conversion of acetaldehyde to acetate, is primarily catalysed by the NAD+- dependent aldehyde dehydrogenases (Tottmar & Marchner, 1976; Svanas & Weiner, 1985; Harrington et al., 1988). Depending on the species of animal, aldehyde dehydrogenases differ in their subcellular location, relative activity and kinetic constants (Sheppard et al., 1970; Feldman & Weiner, 1972; Tottmar et al., 1973; Crow et al., 1974; Koivula & Koivusula, 1975; Greenfield & Pietruszk:o, 1977; Leicht et al. , 1978). In rat liver, acetaldehyde is oxidised predominantly in the matrix space of the mitochondria. This is because of the relatively high activity and very low Km for acetaldehyde of the isozyme localised in this compartment (Eriksson et al., 1975; Higgins, 1979; Weiner, 1979; Williamson & Tischler, 1979; Svanas & Weiner, 1985; Harrington et al., 1988).. Acetaldehyde can be oxidised to acetate by aldehyde oxidase and xanthine oxidase (Rajagopalan, 1980). However these enzymes have Km's for acetaldehyde in the order of 1-10 mM (Weiner,. 1980) and are therefore unlikely to be of physiological significance in acetaldehyde metabolism.
(18) 3. where concentrations of acetaldehyde reach maximum levels of 200 JlM during ethanol oxidation (Braggins & Crow, 1981; Braggins et al., 1980).. Ethanol metabolism to acetate is associated with the production of NADH in the cytosol (ADH reaction) and mitochondria( AlDH reaction ), with a consequent decrease in the free cytosolic. [N�2]. ratio (Veech et al., 1972). To sustain ethanol oxidation, NADH must be reoxidised.. Although some NADH may be oxidised directly in the cytosolic compartment, the majority of oxidation must occur in the mitochondria Because the mitochondrial membrane is impermeable to NADH(Lehninger, 1951), reducing equivalents of NADH must be transferred into the mitochondria for eventual oxidation by the respiratory chain. This transfer is mediated by substrate shuttles, the malate-aspartate(Bucher & Klingenberg, 1958; Borst, 1963) and the a. -glycerophosphate (Sactor & Dick, 1960; Klingenberg & Bucher, 1961) shuttles being. proposed as the major pathways(Cederbaum et al., 1977; Dawson, 1979; Williamson & Tischler, 1979).. Figure 1.1 shows the interactions between ethanol metabolism, the shuttle systems and the electron transport chain.. 1.2. REGULATION OF ETHANOL METABOLISM Over the past 20 years, two opposing views have arisen as to how the rate of ethanol. metabolism is regulated. One hypothesis states that the rate of ethanol oxidation is determined by the rate at which NADH is reoxidised to NAD+(Hawkins & Kalant, 1972; Khanna & Israel, 1980). This was supported by experiments showing increased rates of ethanol clearance in the presence of substrates that increased the rate of NADH reoxidation(Israel & Khanna, 1970; Meijer et al., 1975; Krebs & Stubbs, 1975). The observation that the free cytosolic. ���]. ratio in. liver cells decreases during ethanol metabolism(Christensen & Higgins, 1979) implied that either ADH activity was becoming limited by the supply of NAD+ or ADH was being inhibited by NADH.. The second theory, stating that the amount of alcohol dehydrogenase is the crucial factor in regulation of ethanol metabolism(Crow et al., 1977a,b; Cornell et al., 1979) arose from the following findings:. 1). Rat liver ADH operates at 50 to 80% of its maximum velocity during ethanol oxidation in vivo (Crow et al., 1977a,b); therefore alcohol dehydrogenase is not in excess as assumed in the first theory(Hawkins & Kalant, 1972)..
(19) "<:j". CYTOS OL. EtOH. =. =. MITOCHONDRIA. mitochondrial membrane. ');. AcH. Aspartate. --'. AcH. I. Aspartate. aKG .....---�. NAD+. a KG. 1>-. NAD+. _,/. '�. Ma1 ate. Acetate. OAA. Malate-Aspartate S h$ttle Malate. NAD+. X. NADHJW. NAD+ ATP. ·. NADHJW. NAD+ Figure 1.1 :. DHAP. a GP. --< r----.... .. DHAP. a-Glycer op hospate Shuttle I 1. .,._. a GP. ·. �. electron. reduced flavoprotein. flow. ELECTRON TRANSPORT CHAIN. oxidised flavoprotein ATP. Schematic Diagram of the Interactions between the Metabolism of Ethanol, Shuttle Systems and Respiratory Chain.. ATP. Abbreviations: a-ketoglutarate ( a-KG), oxaloacetate (OAA), glutamate (Glut) , dihydroxyacetone phosphate (DHAP), a-glycerophosphate (a-GP).. 1/2. �. H2 0.
(20) 5. 2). The liver cell does not become depleted of NAD+ during ethanol metabolism (Crow et al, 1983a); hence the activity of ADH is not restricted by the availability of NAD+.. This is explained by referring to the actual concentrations of the metabolites (NAD+ and NADH) in the liver cell and the change in the free cytosolic. m��. ratio (Crow,. 1985). The free cytosolic [NAD+] is about 0.5 mM (Bucher et al., 1972). During ethanol oxidation the ratio of free cytosolic [NAD+] to [NADH] drops from 1000 to 200-500 (Veech et al., 1972). This drop can best be explained by an increase in [NADH] from 0.5 to 1-5 J.LM. The cytosolic NAD+ concentration essentially remains unchanged during ethanol oxidation (Crow et al., 1983a).. 3). The concentrations of NADH occurring during ethanol oxidation in vivo will inhibit rat liver ADH by approximately 10-20% (Cornell et al., 1979); therefore the rate of ethanol metabolism could only be increased by a maximum of 20% if the rate of NADH reoxidation was increased. Such an increase has not been demonstrated in vivo .. 4). The change in cytosolic redox state may be explained by the kinetic properties of cytosolic malate dehydrogenase (Crow et al., 1982, 1983b). Malate dehydrogenase (MDH) is not saturated with NADH at physiological concentrations and therefore the rate of oxidation of NADH by MDH rises with increasing [NADH] until it equals the rate of production of NADH and a new steady state is achieved.. The above experimental evidence has made the second theory more attractive. However, from the existing evidence, we can not state definitely that the level of ADH is the principal factor in regulation of the rate of ethanol oxidation.. A theoretical framework developed by Kacser and Burns (1973) and Heinrich and Rapoport (1974), called the metabolic control theory (see sections 1.3.2 and 1.4), discounts the idea that one particular element (enzyme or transport protein) in a metabolic pathway must be the only rate controlling step. Thus, metabolic control in a pathway is shared by the enzymes, rather than confined to one rate-limiting enzyme per pathway. Therefore the assumption that the rate-limiting step for ethanol metabolism must be either the ADH level or rate of NADH reoxidation, is incorrect. Figures 1.1 and 1.2 illustrate the possible sites of control in the metabolism of ethanol. These are the enzymes alcohol dehydrogenase (ADH) and aldehyde dehydrogenase (AlDH) and the reoxidation of NADH which involves the transfer of cytosolic NADH across the mitochondrial membrane (shuttle systems) and the oxidation of NADH by the electron transport chain..
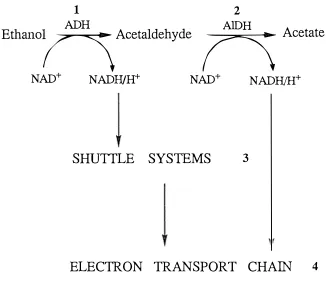
(21) 6. Ethano. 1 ADH. h. NAD+. Acetaldehyde. NADH/H+. SHUTTLE. � 2 AIDH. NAD+. SYSTEMS. Acetate. NADH/H+. 3. ELECTRON TRANSPORT CHAIN. Figure 1.2:. 4. Steps in the Metabolism of Ethanol.. 1. Ethanol oxidised to acetaldehyde by the enzyme alcohol dehydrogenase. 2. Acetaldehyde oxidised to acetate by the enzyme aldehyde dehydrogenase. 3. Transfer of cytosolic NADH into the mitochondria by shuttle pathways. 4. Oxidation of NADH via the electron transport chain. (ADH). (AIDH).
(22) 7. By applying the metabolic control theory, quantitative assessment of the relative importance of each potential control step in the regulation of ethanol metabolism may be achieved. This involves determining the flux control coefficients of all factors (enzymes and transport proteins) involved in the metabolism of ethanol.. 1.3. THEORETICAL FRAMEWORKS FOR THE STUDY OF METABO LIC C ONTROL In recent years there has been a shift of interest from the qualitative concept of a "rate. limiting step " and one "controlling enzyme", to obtaining quantitative information concerning the control structure of a metabolic pathway. Higgins (1965) was one of the first investigators to propose a quantitative expression for the influence of an enzyme on the flux through a pathway. This expression was termed the control strength. There have been several theoretical frameworks developed during the past two decades for the study of metabolic controL Following is a brief synopsis of the three main theories,. biochemical systems theory (BST), metabolic control theory (MCf) and flux oriented theory (FOT), in chronological order of development. 1.3.1 B i ochemical Systems Theory (BST) This theory was formulated in the late 1960's by Michael Savageau (Savageau, 1969a,b, 1970, 1971a,b, 1972) and has been extended by the same author (Savageau, 1974, 1976, 1979; Voit & Savageau, 1986; Sorribas & Savageau, 1989c). The theory provides a general approach that takes into account the nonlinear dynamics of the metabolic system being analysed. In BST the fundamental equations that describe biochemical systems are written explicitly in terms of the Power-Law Formalism (Savageau, 1969b; Voit & Savageau, 1987). There are several levels at which biochemical systems can be described by this formalism (Savageau, 1969a,b, 1979; Voit & Savageau, 1987). The representation that was explicitly selected for the development of biochemical systems theory (BST) was designated the S-systems variant (Savageau, 1969; Savageau et al., 1987a,b). This variant results when one aggregates rate laws to obtain two functions, one representing the sum of the rate processes that lead to an increase (Vi) in a given system constituent CXi ) and the other representing the sum of the rate processes that lead to a decrease (V_i) in a given system constituent (Xi). Each of these aggregate.
(23) 8. rate laws is then represented as a single product of power law functions (equation 1.1).. dXi dt. n+m =. Vi- Y-i. =. oc· 1. rr. j=l. x·gij J. n+m -. �i. rr. j=l. x·hij J. i. =. 1, .... n. (1.1). The dependent variables (n) may be thought of as variables "internal" to the system and the independent variables (m) may be considered external variables that are determined by factors outside the system of interest ( e.g. by the experimentalist, the environment, or other systems within the same organism). These variables typically refer to concentrations, but may also refer to. O:.i is the rate constant (enzyme level) for the net increase (synthesis, import, concentration, etc) of Xi and gij is the kinetic order for the net any other physical or chemical quantities. The symbol. increase of Xi with respect to variation in Xj- The symbol. �i. is the rate constant (enzyme level). for the net decrease (degradation, export, dilution, etc) of Xi and hij is the kinetic order for the net decrease of Xi with respect to variation in Xj.. The steady state solution derived from equation (1.1) relates each concentration variable and flux within an arbitrary system to external concentration variables and parameters associated with the individual enzymes and processes of the system (Savageau, 1969b). This allows the complete characterisation (determination of logarithmic gains and parameter sensitivities) of the relationships between systemic and molecular properties in the system's steady state behaviour.. Many different types of biochemical systems have been analysed using the S-system representation of BST. These include feedback and feedforward mechanisms of control in biosynthetic pathways (Savageau, 1972, 1974, 1975, 1976), network regulation of iinmune responses (Irvine & Savageau, 1985a,b) and enzyme-enzyme interactions (Sorribas & Savageau, 1989a,b).. 1. 3 . 2. Metabolic Control Theory (MCT). The metabolic control theory was developed approximately 16 years ago by two independent research groups (Kacser & Burns, 1973; Heinrich & Rapoport, 1974). This theory provided the theoretical framework for understanding the steady state behaviour of biochemical processes in living organisms as well as the experimental strategy required for its analysis.. The main concept of Mer is that metabolic control is shared by all enzymes in the metabolic system and there is rarely (or probably never) a single enzyme that is truly "rate-limiting". The two important parameters of Mer are the control coefficients and elasticity coefficients. These.
(24) 9. coefficients define how metabolic control is distributed in the system and may be calculated indirectly by using the summation (Kacser & Burns, 1973; Heinrich & Rapoport, 1974) and connectivity (Kacser & Burns, 1973; Westerhoff et al., 1984) theorems.. The elasticity coefficient. (E) defines the response of the rate of the 'isolated' species to changes in. the concentration of metabolite that directly affects the response (Westerhoff et al., 1984; Burns et al., 1985a,b). The mathematical formula for the elasticity coefficient is given in equation 1.2.. '!_ P'"M = where:. dv/V dM/M. (1.2). v represents the rate of any functional entity 'isolated' from the system (enzyme, translocator, etc). M represents any molecular species which affects the function directly (substrate, product, inhibitor, cofactor, etc).. The control coefficient (C) defines the response of the 'whole system', when the enzyme is embedded in and interacts with the rest of the system, to changes in any parameter of the enzyme (equation 1.3) (Westerhoff et al., 1984; Burns et al., 1985a,b):. (1.3). where:. V represents any variable in the system (flux, concentration pool, free energy, etc). P, an independent variable, represents any parameter (enzyme concentration, turnover number, etc) whose change causes the changes in V.. The control theory (Kacser & Burns, 1973; Heinrich & Rapoport, 1974) has subsequently been extended to analyse branched pathways (Heinrich et al., 1977; Kacser, 1983; Fell & Sauro, 1985), substrate cycles (Fell & Sauro, 1985) and moiety-conserved cycles (Hofmeyer et al., 1986). New theorems have been developed (Westerhoff & Chen, 1984), as well as a matrix algebra procedure used for determining flux control coefficients (Fell & Sauro, 1985) and concentration control coefficients (Sauro et al., 1987).. Several reviews of control analysis have been published (Heinrich et al., 1977; Kacser & Burns, 1979; Groen et al., 1982c; Porteous, 1983; Westerhoff et al., 1984; Derr, 1985, 1986; Kacser & Porteous, 1987a), as well as an agreed terminology (Westerhoff et al., 1984; Burns et al., 1985b)..
(25) 10. Most importantly, the control theory has been experimentally applied to several metabolic systems: glycolysis in erythrocytes (Rapoport et al., 1976), arginine biosynthesis in Neurospora (Flint et al.,. 1980, 1981), respiration in mitochondria from rat liver (Duszynski et al., 1982; Groen et al.,. 1982b; Gellerich et al., 1983; Tager et al., 1983; Westerhoff et al., 1983; Wanders et al., 1984; Brand et al., 1988) and yeast (Mazat et al., 1986), amino acid metabolism (Groen et al., 1982a ; Pogson et al., 1986; Salter et al., 1986) and gluconeogenesis (Groen et al., 1983, 1986; Pryor et al.,. 1987) in rat liver cells, citrulline synthesis in isolated rat liver mitochondria (Wanders et al.,. 1983), glycerol-3-phosphate production in soluble extracts from rat liver (Torres et al., 1986, 1988a,b), photochemical reactions in bacteriorhodopsin (Westerhoff & Arents, 1984), ethanol metabolism in Drosophila (Middleton & Kacser, 1983) and horse liver (Derr & Derr, 1987), and the Calvin photosynthesis cycle in C3 plants (Pettersson & Ryde-Pettersson, 1989). 1.3.3 Flux Oriented Theory (FOT) Crabtree and Newsholme's quantitative approach to metabolic control is based on a simple measure of the response of a given system to a given regulator, which they termed "sensitivity" There are two types of sensitivity in FOT that enable complex control systems to be analysed. The intrinsic sensitivities (Si) are derived (using simple addition and product rules) from experimentally determined parameters such as kinetic response of enzymes and displacement from equilibrium. The overall (net) sensitivity of a system, flux or reaction, to effector in situ , is derived from the intrinsic sensitivities, by using a power approximation (Savageau, 1972) to the rate of a reaction i.e. the rate (v) is approximated by the product of the concentrations of all its effectors (substrate, product, activators, inhibitors - X1 ..... Xn), each raised to the power of its -. intrinsic sensitivity (equation 1.4): v. =. K [XI]Si (Xl) [X2]Si (X2) ........... [Xn JSi (Xn). (1.4). The regulatory sequence is identified and the rate of the regulator reaction approximated by a power equation which includes the interaction of the regulator (s). Unwanted fluxes and effector concentrations are eliminated from this equation using power approximations for all the other reactions of the sequence. The end result is shown in equation 1.5: flux (J) = const. (K) [regulator (X)]S. (1.5). The net sensitivity of the flux to changes in the specified regulator via that sequence is then represented by the algebraic expression forming the index S. The flux oriented approach has been used to analyse the sensitivity conferred by a substrate cycle.
(26) 11. (Crabtree, 1976; Crabtree & Newsholme, 1985a), to evaluate the control of glycolysis by ATP, ADP and AMP acting together (Crabtree & Newsholme, 1985a, 1987a), and to analyse the importance of fluxes in determining the sensitivity at a branch point (Crabtree & Newsholme, 1985a).. 1.3.4. Comparison of Theories. Until recently, these three approaches (BST, MCT and FOT) to metabolic control have not been compared. This has resulted in separate literatures with few cross-references between them, different terminologies for equivalent control parameters (see Table 1.1) and a great deal of confusion concerning the best theory for quantitative analysis of control (Burns et al., 1985; Crabtree & Newsholme, 1985a, 1987, 1988; Porteous, 1985; Canela & Franco, 1987; Fell, 1987; Kacser & Porteous, 1987b; Savageau, 1987; Sorribas, 1987; Voit, 1987; Welch & Keleti, 1987; Groen & Tager, 1988).. TABLE 1.1. Terminolgy in BST, MCT, and FOT for Control Parameters BST. logarithmic gain. MCT. response coefficient. FOT *. References. Savageau et al.. (1987b). factor. rate constant sensitivity *. concentration control. net sensitivity. Savageau et al. (1987b). coefficient. flux control. net sensitivity. elasticity coefficient. Westerhoff et al. (1984) Burns et al. (1985b). coefficient. kinetic orders. Westerhoff et al. (1984). intrinsic sensitivity. Westerhoff et al. (1984) Burns et al. (1985b) Savageau et al. (1987a,b) Sorribas & Savageau (1989b). * there is no equivalent terminology.
(27) 12. Recent detailed comparisons of these three approaches (Savageau et al., 1987a,b; Voit & Savageau, 1987; Sorribas & Savageau, 1989a,b) have shown that the metabolic control theory and the flux oriented theory are special cases of BST. They are based on the mathematical structure of BST, involving the explicit (FOT) or implicit(MCf) use of the power-law formalism developed by Savageau (Savageau, 1969a,b, 1970, 1971a,b, 1972).. Even though the concepts, theory and methodology of BST provide a very general framework for analysing complex biochemical systems, I elected to use Kacser and colleagues' approach to metabolic control.. MCT is valid in steady state systems since it shows which enzyme alteration leads to the most dramatic changes in flux or intermediate concentrations. The theory is the easiest to understand and the experimental methodology provided for determining the essential control parameters (elasticity and flux control coefficients) is clearly outlined. The experimental applications of MCT are numerous(see section 1.3.2) and the diverse number of research groups (see section 1.3.2) using MCT clearly show its popularity.. Some criticisms (Savageau, 1987a,b,c; Sorribas, 1987; Welch & Keleti, 1987; Sorribas & Savageau, 1989b) of the metabolic control theory are that:. 1). The theory is not valid for cascades and enzyme-enzyme interactions. It has already been acknowledged (Kacser & Burns, 1979; Kacser & Porteous, 1987b) that possible modifications may be needed for particular cases and an algebraic formalism (Kacser & Porteous, 1987b) has been developed, which takes into account enzyme-enzyme interactions.. 2). The theory is oversimplified. Elasticity coefficients and flux control coefficients are defined in a simplified manner to represent local and global changes in the system. This avoids the complexity of the system by omitting its dynamic nature. This simplification is perhaps one of the attractions of control analysis. For experimental application MCT would appear more straight forward than BST which is mathematically more complex.. The aim of this thesis was to use the metabolic control theory to evaluate the distribution of control in the pathway for metabolism of ethanol in hepatocytes isolated from fed and starved rats. This involved determination of the flux control coefficients of the individual steps in the ethanol pathway (see Figure 1.2)..
(28) 13. 1. 4. D ETERMINATION OF FLUX CONTROL C OEFFICIENTS The flux control coefficient. (�i). of a step (i) in a metabolic pathway is defined as the. fractional change in steady state (ss) flux. (J) through the pathway induced by a fractional change in. the activity of enzyme (E0 under consideration (equation 1.6) (Kacser & Burns, 1973; Heinrich & Rapoport, 1974).. �. = (dil��. ) I. 1. 1. (1.6). SS. The quantitative value of the flux control coefficient for an enzyme describes how sensitive the flux is to changes in that particular enzyme. In practise large changes that are imposed are uninformative and infinitesimal changes impracticable. Therefore the method of modulation (Kacser & Burns, 1973) must be applied. This modulation approach involves altering the activity of one enzyme by small amounts (dEi), and measuring the effect of this alteration on flux through the pathway. The enzyme activity may be increased in small amounts by addition of extra enzyme (Rapoport et al., 1976; Groen et al., 1982b; Westerhoff & Arents, 1984) or decreased by small amounts by titrating with enzyme-specific inhibitors (Duszynski et al., 1982; Groen et al., 1982b; Verhoeven et al., 1985; Torres et al., 1986). The latter approach was taken for determining the flux control coefficients of steps involved in the oxidation of ethanol (see Figures 1.1 and 1.2).. The effect of a change in the concentration of an external effector (x) on the pathway flux. (J) is. defined (Kacser & Burns, 1973; Groen et al., 1982c ; Derr, 1986) in terms of the response coefficient, R (equation 1.7): J dJ/J R = �x dx/x. (1. 7). The effect of a change in the concentration of the effector on the rate (vi) of an 'isolated' enzyme is defmed (Kacser & Burns, 1973; Groen et al., l982o.; Derr, 1986) in terms of the controllability coefficient or elasticity coefficient of an external effector (x) (equation 1.8):. (1.8).
(29) 14. The flux control coefficient of an enzyme can be calculated from the response coefficient and controllability coefficient (equation 1.9):. (1.9) The external effector in this study is the enzyme-specific inhibitor. Therefore the response of the pathway flux (J) to the action of an inhibitor (I) on enzyme (Ei) is given by :. �i where:. (1.10). =. J =the pathway flux at steady state (ss).. Vi. I =the free concentration of inhibitor. =velocity of the enzyme isolated from pathway flux but incubated with. fixed concentrations of substrate (Sj) and product (Pj) equivalent to. concentrations prevailing in pathway at flux J.. The flux control coefficient in absence of inhibitor (equation 1.11) can be obtained by taking the limit of equation 1.10 at I=O (Groen et al., 1982b,c; Derr, 1986).. (�1. =. (dvi/Vi). �. (1.11). drr=O. The top term of equation 1.11 can be derived from the initial slope of the flux inhibition curve (flux (J) vs [I]). J is the flux at zero inhibitor concentration and. (�) I=O. is the initial slope of the. flux inhibition curve. Some researchers (Lemasters & Sowers, 1979; Rognstad, 1979; Yont & Harris, 1980) have assumed that the shape of the inhibition curve in itself provides quantitative information about the relative importance of the step under consideration. A step was said to be rate-controlling when on titration with an inhibitor a hyperbola-like curve is obtained and non rate controlling when a sigmoidal inhibition curve is produced. Use of this criterion for evaluating the.
(30) 15. importance of a step in regulation of the pathway can be misleading (Groen et al., 1982c.) because the nature of the inhibition and the amount of inhibitor used must be taken into consideration.. The denominator of equation 1.11 can be calculated from the inhibition kinetics of the enzyme. The mathematical formula of. �.will differ with respect to the type of inhibitor used (Rapoport, 1. 1977; Groen et al., 1982c.; Derr, 1986). For instance, the influence of an uncompetitive inhibitor on the rate equation for an irreversible reaction is: v=. I K+S(l+ ·) K11. (1.12). where: K represents the Km for substrate; S is the substrate concentration; I is the inhibitor concentration and Ku represents the intercept inhibition constant. Differentiation of (1.12) leads to equation 1.13 dv vdl =. -S. I K ii (K+S(l+ _)) K11. (1.13). Substitution of (1.13) into (1.11) gives equation (1.14).. -dJ KiiCK+S) s. Jdi. (1.14). Other important points to note on the use of specific inhibitors for determination of flux control coefficients are: 1). If the inhibitor has to cross a membrane to reach its site of action then it would be helpful to know the membrane's permeability to the inhibitor. The value of the flux control coefficient will be underestimated if the inhibitor is excluded whereas an. accumulation of inhibitor will produce an overestimation of the. 2). cii .. If an irreversible inhibitor is used, there should be insignificant binding to other proteins; otherwise the flux control coefficient will be underestimated..
(31) 16. 3). When using competitive, noncompetitive, or mixed type inhibitors, knowledge of the kinetic constants and concentration of the metabolites interacting with the enzyme under consideration is required.. The best type of inhibitors to use are irreversible inhibitors and some noncompetitive inhibitors that do not require the measurement of substrate and product concentrations for the enzyme being studied (Groen et al., 1982c ; Derr, 1986). Irreversible inhibitors are extremely good because on titration the end point indicates the amount of enzyme in the system (Segel, 1975 pp 127-128). However specific irreversible and noncompetitive inhibitors are not very common. It was important to fmd specific inhibitors for ADH, AIDH, malate-aspartate shuttle enzymes and enzymes of the respiratory chain, so that the flux control coefficient of these enzymes could be determined using the modulation approach (Kacser & Burns, 1973). A search for specific irreversible and noncompetitive inhibitors of the enzymes was the first step. When this failed. competitive and uncompetitive inhibitors were found. The fmal inhibitors chosen for the inhibitor. titration studies are described in chapters 4, 5, and 6. Because the flux control coefficient is a global coefficient, the enzymes and proteins under study must be intact in their environment. This can be accomplished by using isolated hepatocytes. These cells, when well prepared, retain the metabolic capabilities of the intact liver (Krebs et al., 1974; Cornell et al., 1982b). For the inhibitor titration studies, the rates of ethanol oxidation were measured under physiological conditions in isolated hepatocytes. To be able to measure the small changes in rates of ethanol oxidation, brought about by the introduction of specific inhibitors, a new method for incubation of the isolated hepatocytes and measurement of ethanol clearance rates had to be developed. This is explained in detail in chapter 3. The flux control coefficient is a quantitative measure of how much a given enzyme limits the flux through a metabolic pathway. The pioneers of the metabolic control theory (Kacser & Burns, 1973; Heinrich & Rapoport, 1974) have shown that the sum of all the flux control coefficients for any one flux in a steady state system is equal to unity (equation 1.16). This is called the flux control summation theorem.. (1. 16).
(32) 17. The summation property has been demonstrated in a number of experimental systems (Groen et al.,. 1982b, 1983; Salter et al., 1986; Torres et al., 1986). The implication of this theorem is that. the enzyme with the greatest flux control coefficient exercises the most control in the metabolic system in question under the conditions tested. If one enzyme activity is changed by a substantial amount, its' flux control coefficient will change to a new value at the new level, and the flux control coefficients of all other enzymes in the metabolic pathway will also change, so that their sum still equals one. Hence the summation theorem will hold for any set of enzymes and external parameters but the internal distribution will alter with changing conditions. Because the flux control coefficient for a particular enzyme is not a fixed value and will change under different metabolic conditions, it was important to assess the regulation of ethanol metabolism in hepatocytes isolated from both fed and starved rats. In summary, I have studied the distribution of control in the metabolism of ethanol in isolated rat. hepatocytes, using Kacser and Burns (1973) modulation methodology. The method developed to apply the modulation approach to analysis of ethanol oxidation in rat hepatocytes is described in chapter 3. Determination of the flux control coefficient for alcohol dehydrogenase and aldehyde dehydrogenase is described in chapters 4 and 5 respectively. The data presented in chapter 5 represent preliminary work for determination of the flux control coefficient of AlDH. The reason for this work being incomplete is because I became allergic to the rats, chemicals and detergents and as a result developed contact dermatitis on my hands. This made it impossible to continue. with the hepatocyte preparations and the inhibitor titration experiments. Also, titration experiments were not carried out on the possible steps in the shuttle systems and respiratory chain. Hence chapter 6 is a discussion on what could be done to determine the contribution of the individual steps in the hydrogen shuttle cycles and electron transport chain to regulation of ethanol oxidation in isolated rat hepatocytes. Chapter 7 is a discussion of all the results obtained in this thesis along with prospects for future work..
(33) 18. CHAPTE R 2. MATERIALS AND METHODS. 2.1. S O URCE OF MATERIALS AND REAGENTS The list in Table 1.1 shows the source of all chemicals of analytical grade, enzymes,. cofactors, inhibitors, and special equipment All other chemicals mentioned in this thesis are reagent - grade products.. 2.2. HYDROLYTIC ENZYMES Berry and Friend (1969) were the first to prepare isolated hepatocytes by perfusing the. liver with the digestive enzymes, collagenase and hyaluronidase. Perfusion exposes virtually every cell to the hydrolysing enzymes. Both of these enzymes were used in the preparation of isolated rat liver cells.. 2.2.1 C ol l a genase Collagenase was obtained from Boehringer Mannheirn GmbH (West Germany) i n 500 mg lots. Each lot was tested for cell yield (greater than 2 gram of cells from starved rats) and cell viability (greater than 85% viable) before continued use of that batch.. A crude collagenase preparation was used because the contaminating proteolytic enzymes aid digestion of the liver (Berry & Friend, 1974 ; Krebs et al., 1974) . Optimum activity for collagenase is obtained at pH 7.4 (Se glen, 1976) . Maintenance of the pH was achieved by dissolving collagenase in Krebs-Henseleit buffer (see section 2.3) and gassing with 95% 02:. 5%. C02.. The concentration of collagenase used for perfusion was dependent on the activity of the batch, since variation in the protease activity occurs between batches. The age of the rats was also important as younger rats require less collagenase for cell dispersion because of their lower collagen content (Seglen, 1976; Pogson, 1983). Typically 30 to 50 mg collagenase was used in the perfusion of liver from a 180 to 300 g rat.
(34) 19. TABLE 1.1. Materials and their Source. Item. Category. Enzymes. Cofactors. Inhibitors. Chemicals and Reagents. Equipment. Source. ADH ( Bakers Yeast) AIDH (Bakers Yeast) G-6-P-DH (Type Vll, Yeast) Hexokinase (Type C-130,Yeast) Hyaluronidase (Ty.V,Sheep Testes) Collagenase(Ty.lV, Cl.Histolyticum). Sigma Chemical Co. Ltd, U.S.A Sigma Chemical Co. Ltd, U.S.A Sigma Chemical Co. Ltd, U.S.A Sigma Chemical Co. Ltd, U.S.A Sigma Chemical Co. Ltd, U.S.A Boehringer Mannheim GmbH, F RG. ATP (grade 11). Sigma Chemical Co. Ltd, U.S.A. NAD+ (grade lll , Yeast). Sigma Chemical Co. Ltd, U.S.A. NADp+ (Yeast). Sigma Chemical Co. Ltd, U.S.A. Diethyldithiosodium carbamate Disulfiram Isobutyramide Tetramethylene sulphoxide. BDH Chemical Ltd, England Sigma Chemical Co. Ltd, U.S.A Aldrich Chemical Co. Inc., U.S.A Aldrich Chemical Co. Inc., U.S.A. BSA (fraction V) Glucose (anhydrous, grade lll) L(+) lactic acid lysine Trypan Blue Acetaldehyde KCl Sodium pyrophosphate B-mercaptoethanol Perchloric acid (70%) Ethanol (spectroscopic grade, 96%) Sodium pyruvate Nembutal (powder) Nembutal (liquid) Sagatal (liquid) Heparin. Sigma Chemical Co. Ltd, U.S.A Sigma Chemical Co. Ltd, U.S.A Sigma Chemical Co. Ltd, U.S.A Sigma Chemical Co. Ltd, U.S.A Sigma Chemical Co. Ltd, U.S.A BDH Chemical Ltd, England BDH Chemical Ltd, England BDH Chemical Ltd, England J T Baker Chemical Co., NJ AJAX Chemicals PTY Ltd,Australia Fluka A G Buch, Switzerland Fluka A G Buch, Switzerland Abbott Lab. NZ Ltd, Auckland Ceva Chemicals PTY Ltd, Australia Hay & Baker NZ Ltd, Lower Hutt NZP, Palmerston North, NZ. 2.2 ml Microcentrifuge Tubes Abbocath-T 16x2 (19-G needle) C600Q and C2oo Gilson tips. Gibco NZ Ltd, Auckland Abbott Lab. NZ Ltd, Auckland John Morris Scientific Ltd, NZ.
(35) 20. 2.2.2 H yaluroni dase Hyaluronidase was purchased from Sigma Chemical Company (StLouis, MO, USA). Several researchers have found that this hydrolytic enzyme was not necessary for the dispersion of the whole liver cells (Seglen, 1 973; Veneziale & Lohmar, 1 973; Meijer et al., 1 975; B aur & Heldt, 1 976; Pogson et al., 1 983) and that it can have an inhibitory effect at concentrations of 0.2 mg/ml or greater (Seglen, 1 976). Others have stated that hyaluronidase will increase the cell yield (Berry & Werner, 1 974; Krebs et al., 1 974; Berry, 1 976a). This is an important factor. The production of as many intact viable. cells as possible is required for metabolic studies. In this laboratory h yaluronidase has been used for many years and will continue to be used. The concentration (as high as 0.08 mg/ml) is noninhibitory, the possibility of greater cell yield is advantageous to our studies and with a consistent technique past results may be compared to present data. 2.3. KREBS-HENSELEIT (K-H) B UFFER Krebs-Henseleit bicarbonate buffer (Krebs & Henseleit, 1 932) with Ca 2+ omitted, was. utilised for perfusion of the rat liver. K-H buffer supplemented with 2.5% BSA was used as a medium for suspension and incubation of the cells. The buffer contained 1 18 mM NaCl, 4.75 mM KCl, 2.5 mM CaCl2.2H20, 1.18 mM KH2P04, 1 .18 mM MgS04.1H20, and 25 mM NaHC03. It is a physiological saline solution that provides the Na+: K+ extracellular concentration ratio of 1 43: 6 (Cornell, 1 983b) and is a good buffering system to maintain pH 7.4, when gassed with 5% C02 in 02. 2.3.1 Perfusion Medium The perfusion system was primed with 150 mls of calcium-free K-H buffer. If fed rats were used 20 mM glucose was added to the perfusion medium to maintain hepatic glycogen. The liver must be perfused with calcium-free medium before any separation of intact parenchymal cells can be obtained (Seglen, 1 976; Wanson, 1 976). It appears that cleavage of desmosomes is the key element for liver cell separation and that calcium ions are essential for desmosomal integrity (Berry & Friend, 1 969; Berry, 1 976b; Seglen, 1 976; Wanson, 1 976; Berry et al., 1 983) Perfusion with a Ca2+ - free medium will flush out calcium ions and cause cell dispersion to occur. However Ca 2+ ions are required for collagenase activity (Seifter & Harper, 1 970;.
(36) 21. Peterkofsky, 1982). Seglen (1976) proposed a two-step procedure, where calcium ions were removed by preperlusion of the liver with a Ca2+- free medium and then calcium was introduced back into the system with collagenase. We and others (Johnson et al., 1972; Cornell et al., 1973; Krebs et al., 1974; Pointer et al., 1976; Birnbaum & Fain, 1977; Tolbert et al., 1980; Pogson et al., 1983) have found this second step to be unnecessary. Analysis of crude collagenase. preparations have shown that the endogenous Ca2+ present was enough for enzymatic activity (Berry, 1976b; Pogson et al. , 1983). Collagenase has been suggested to aid cleavage of desmosomes by removing residual calcium ions (Berry, 1976b; Berry et al., 1983) . 2.3.2 C el l S uspension Medium This medium was K-H buffer supplemented with 2.5% dialysed BSA. The buffer was gassed with 02+C(h (95:5) until the pH was about 7.4, then dialysed BSA (initial concentration about 10%) was added to make a 2.5 % solution. Gassing (5% C02 in oxygen) of this mixture was continued during perlusion of the liver. For each experiment a total volume of 150 ml K-H I 2.5% BSA medium was prepared and used for the washing and incubation of the cells. 2.4. B OVINE SERUM ALBUMIN (BSA) FOR HEPATO CYTES Bovine Serum Albumin ( BSA) was not present during perlusion of the rat liver because it. could decrease the activity of the digestive enzymes, thereby decreasing the cell yield (Berry, 1974; Krebs et al., 1974). However K-H buffer containing 2.5% dialysed BSA was used for washing and incubation of the isolated hepatocytes. Albumin offers some protection for the cells against mechanical stress, binds some toxic substances and most importantly limits cell aggregation (Krebs et al., 1974; Seglen, 1976). A decrease in the metabolic activity is concomitant with clumping of cells (Krebs et al., 1974). 2.4.1 D ialysis of B S A Most Albumin preparations contain ethanol and acetic acid and these contaminants are readily metabolised by the liver. Before the BSA can be used in the cell suspension medium, the. impurities must be removed by dialysis.. 36 g BSA (fraction V) was dissolved in approximately 200 ml of K-H buffer. To minimise bacterial contamination the plastic 250 ml beaker was kept cold (4 OC) and covered except for the.
(37) 22. times when the solution was stirred. It took several hours for BSA to dissolve completely in the bicarbonate buffer. Dialysis tubing (25 mm in diameter) was cut into lengths of approximately 27 cm and washed in 3 changes of distilled water heated at 80 °C, to remove any impurities. The BSA solution was dialysed against 3 changes of 4 L of K-H buffer. Dialysis was carried out in the cold room ( 4 °C) with the 5 L erlenmeyer flasks covered. The saline buffer was continuously stirred (via magnetic stirrer) during dialysis of the BSA. After 3 days the BSA solution was removed from the tubing, the total volume was recorded and then the protein concentration was determined. 2.4.2 D etermination of Protein Concentration The absorbance of a solution containing 0.1 ml dialysed BSA in 9.9 ml of 0.02 M HCl was measured at 278 nm. The blank contained 0.1 ml of K-H buffer in 9.9 ml of 0.02 M HCL The concentration of the dialysed BSA was determined assuming that the absorbance of a 0.1 % BSA solution a t 278 n m i s 0.64 (Sober, 1 970). The BSA solution was stored frozen in plastic bottles in quantities appropriate for the preparation of 150 ml K-H I 2.5% BSA (see section 2.3.2). 2.5. PREPARATION OF ISOLATED HEPATOCYTES Isolated hepatocytes were prepared by the method of Berry & Friend (1 969) as modified. by Cornell et al. (1973). The procedure involved perfusion of the rat liver with collagenase and hyaluronidase to promote liver digestion and then removal of the liver for collection of the isolated liver cells. It is technically quite difficult to obtain a high yield of isolated hepatocytes that are metabolically viable. Isolation of hepatocytes is an art which relies on judgement and experience for the preparation of a high yield of viable cells..
(38) 23. 2.5 . 1 Rats Male Sprague-Dawley rats, weighing 1 60 to 300 g, were obtained from the Massey University Small Animal Production Unit. They were housed in a temperature-regulated room ( 24°C) with. artificial light providing a 1 2 hi light/dark cycle. The rats were fed a standard pellet diet, supplied. ad libitum or starved 48 hrs prior to the experiment. In both cases there was free access to tap water.. Before the operation, the rats were injected intraperitoneally with nembutal (30 mglml of 0.9% saline). When we were unable to purchase powdered nembutal, Nembutal ( liquid) or S agatal in doses of around 0.5 rnV190 g rat was used.. 2.5 . 2 O perative Technique The principle of this operation was to insert a cannula into the hepatic portal vein and a cannula into the vena cava above the diaphragm, to allow recirculatory perfusion of the rat liver. The route of perfusion (Figure 2. 1 ) would involve a flow of medium from the reservoir to the perfusion lung, through the perfusion lung to the liver via the portal cannula, and through the liver back into the reservoir by way of the vena cava cannula. The speed and precision of the operation were factors that contributed to the fmal yield and viability of the cell preparation.. 2.5 . 2. 1 Surgical Procedure The anaesthetised rat was placed on its back on an operating platform, where the limbs were secured. 0. 1 ml heparin (5000 U/ ml of saline) was injected into the leg vein before commencement of the operation. A mid line incision was made through the skin from the abdomen to the neck. The abdomen was then opened by a mid line incision and 2 mid transverse incisions to the left and right of the mid line cut. The intestines were placed to the animals' left exposing the liver, portal vein, right kidney, and inferior vena cava. The thin strands of the connective tissue between the right lobe of the liver and the vena cava were cut and a loose ligature was tied around the vena cava above the right renal vein. Two loose ligatures were tied around the portal vein to aid the insertion of the portal cannula (1 6- G needle). The needle was removed, leaving the catheter (5 1. mm) secured in the vein by tying the two threads. An opening. in the thorax was made to expose the heart and vena cava above the diaphragm, the cannula (see. section 2.5.5) was inserted via the auricle and secured. The ligature around the vena cava above the renal vein was tied. The rat was now ready to be connected to the perfusion apparatus..
(39) 24. p. (. �. gas outlet. E. R. -ID- water (37 °C ). outlet. F u. s I. 0 N. medium flow ( 37 o c ). �. gas inlet. L u N G. R. overflow medium from abdominal cavity and overflow. medium from liver ·. ----...., E s E. R. -+ water inlet (3'f C). V 0. I. __. R. _ _ _. Figure 2. 1:. Perfusion Apparatus. The dotted lines represent connections on the reverse of the perfusion lung and reservoir. The clamp regulates the pow rate of the medium. The medium is gassed with 5% CO]. in (h..
(40) 25. 2.5 . 3 P erfusion The perfusion apparatus was based on Hems e t al. ( 1966). A diagram of our perfusion system is shown in Figure 2.1. The system was primed with 150 ml of enzyme-free perfusion medium. En route the medium was oxygenated by continual gassing with Ch + C(h (95: 5) and maintained at a constant temperature of 37°C and pH of 7.4 (see section 2.3). The flow rate was adjusted to approximately 25 ml/min for a 200 g rat. Too high a flow rate led to disruption of the liver and a slow flow rate resulted in anoxia. It was necessary to clear the liver of all blood, after connection of the rat to the perfusion apparatus. Gentle massaging of the tissue facilitated this. During blanching of the liver, the vena cava cannula and hepatic cannula were adjusted to obtain a maximum flow rate. The appearance. of the liver gave some indication of the flow of medium through the organ. With a uniform flow complete loss of the reddish colour of the liver was observed. An irregular flow produced patchiness (uneven colouring of the liver) where inadequate perfusion and digestion of the liver occurred in the dark coloured regions of the organ (areas retaining blood).. The first 40 to 50 ml of perfusate flowing from the vena cava cannula was discarded during the flushing of blood and adjustment of flow rate. The next 5 ml of medium was used to dissolve the digestive enzymes, then the cannula effluent was redirected into the reservoir. Collagenase and hyaluronidase were added to the perfusion system via a suction tube. This tube returned perfusion medium exudated from the liver surface back into the reservoir. Perfusion was continued until the liver was very soft, massive fluid leakage from the liver surface was apparent and the flow rate from the vena cava cannula dropped considerably. After approximately 30 minutes perfusion was discontinued and the liver was removed for collection of the isolated hepatocytes. 2.5 . 4 Collection O f Hepatocytes Once perfusion was stopped, the hepatic portal cannula was removed. The liver was carefully cut out and placed in a 250 ml plastic beaker containing some perfusion medium from the reservoir. The procedure for collection of hepatocytes, described below, involved several low speed centrifugation steps which were necessary for separating the parenchyma! cells (hepatocytes) from subcellular debris, damaged cells, residual red blood cells and nonparenchymal cells (Krebs et al., 1974; S eglen, 1976)..
(41) 26. The liver was chopped up, while immersed in the reservoir medium, to aid in the separation of the liver cells. This suspension was then filtered through a nylon gauze sieve (see section 2.5.7) to remove cell debris and undissociated cells. The filtrate was centrifuged in two 50. ml glass. centrifuge tubes for 2 minutes at 50 x g. The supernatant was poured off and the precipitated cells were resuspended in K-H I 2.5% BSA medium (see section 2.3.2) using a 10. ml wide tipped. pipette. The suspension was filtered and recentrifuged in one glass centrifuge tube at 50 x g for 2 minutes. The precipitated cells were resuspended as before, placed in a tared centrifuge tube and spun for 2 minutes at 50 x g. The pellet was weighed and suspended in 10 volumes of wash medium (see section 2.3.2). The suspended cells were placed in a 250 ml erlenmeyer flask and gassed with 5% C02 in � (mixing occasionally to keep aerated) until ready for use.. For collection of isolated hepatocytes, gentle handling of the digested liver and cell suspension was required. Rapid pipetting through a narrow orifice, magnetic stirring and bubbling of 95%. D2,: 5% C02 through the cell suspension are harsh techniques and should be avoided if intact cells are to be maintained.. 2.5.5 Vena Cava C annula The cannula placed i n the inferior vena cava above the diaphragm was made i n the laboratory.. Plastic tubing of inside diameter 2 mm was cut into lengths of 3.0 to 3.5 cm. The end was tapered (using a razor) to form a tip sharp enough to pierce the auricle. Once the cannula was pushed. down the vein, enough tube protruded from the vein to allow for connection to the reservoir and manipulation for adjustment of the flow rate.. 2.5 . 6 Perfusion Lung The perfusion lung was stored in a Pyroneg/water solution, in a 10 L plastic container. Before each experiment the lung had to be cleaned thoroughly to remove all traces of detergent. The. overall perfusion and digestion of the liver would be affected if detergent was present. Filming of the lung bubbles becomes difficult which leads to inadequate oxygenation of the medium, and detergent contamination of the perfusion medium would obstruct digestion of the liver and separation of cells.. Firstly the lung was washed several times with tap water to remove the bulk of detergent. This was followed by a wash with methanol which aided removal of residual detergent. The lung was then washed thoroughly with tap water and, fmally, rinsed with distilled water..
(42) 27. The cleaned lung was connected to the water pump and reservoir. The perfusion medium was pumped through the lung. All lung bubbles should be covered, or filmed, with the medium to ensure good oxygenation and perfusion of the rat liver.. After many experiments, inadequate filming of the lung occurred. The lung was then soaked overnight in chromic acid (35 rn1 saturated Na2Cr20y to 1 L cone. H2S04) or in an alkaline solvent (NaOH solution in saturated KMn04) .. 2 . 5 . 7 Nylon Gauze S ieve The sieve was made in the laboratory. A 100 rn1 disposable plastic beaker (with the bottom removed) was heated on a metal plate. When the plastic had melted it was pressed fmnly on a nylon cloth (mesh size 0.5. mm. x 0.3. mm). on a cool smooth surface. The fmal step involved. trimming the gauze around the beaker once the seal was formed between the mesh and plastic.. 2.6. CELL WET WEIGHT Metabolite content (Jlmole/g) and metabolic rates (Jlmole/rnin/g) were expres sed on the. basis of cell wet weight. The cell wet weight was determined from the dry weight as described by Krebs et al .(l 974). The .. dry weight of the isolated cells was obtained by placing 2 rn1 cells and medium (in duplicate) and 2 rn1 medium (in duplicate) in preweighed vials and drying to constant weight at. 1 00 °C. The. difference in averaged weights represented the dry weight of cells collected. The wet wt/dry. wt. ratio of the perfused organ was 3 .7 (Krebs et al., 1974). This factor was used to convert from dry weight into wet weight of cells.. 2.7. CRITERIA FOR CELL INTEGRITY The metabolic performance of cells with damaged membranes is markedly decreased. (Cornell, 1 983b; Dickson & Pogson, 1977) therefore intact cells are required for metabolic studies.. The physiological quality of the hepatocyte preparation was assessed by examination of the cell morphology (Trypan Blue Exclusion Test) and measurement of the ATP content..
(43) 28. 2. 7 . 1 Trypan Blue Exclusion Test The Trypan Blue Exclusion Test (Phillips, 1973) was used to visualise the integrity of the cells as well as estimating the viability of the hepatocyte preparation. 50 j.ll of cell suspension was added to a solution containing 0.1 m1 of 0 . 1 % aqueous Trypan Blue and 0.9 mls of 0.9% saline. A small amount of this mixture was placed on a Neubauer counting chamber and viewed under a light microscope (Nikon) at lOx magnification. The number of stained cells (dead cells) and nonstained cells (viable cells) were counted and the percentage of viable cells was calculated. Cell preparations with a viability count of 85% or greater were used in metabolic experiments. Under the light microscope intact cells were readily recognised by their roundness and refractility (Berry, 1 974; Berry & Werner, 1974; Krebs et al., 1974; Seglen, 1976) . Clumps of cells or bleb formation easily observed under the microscope indicated a decrease in the metabolic performance of the isolated liver cells. 2.7.2 ATP Content The measurement of ATP (see section 2. 1 1) is a convenient and reliable method for evaluating cell viability (Krebs et al., 1974 ; Cornell, 1983b; Pogson et al., 1983). The relationship between membrane damage and maintenance of cellular ATP is reflected in the corresponding association between ATP levels and intracellular enzyme leakage (Dickson & Pogson, 1977; Cornell, 1983b). Cornell ( 1983b) stated that the level of ATP provided a useful minimum criterion for determining cell quality. Hepatocyte preparations with ATP content 2 j.lmole/g wet wt cells or greater were used in metabolic experiments. When ATP levels dropped below 2 j.lmole/g wet wt cells intracellular enzyme leakage became pronounced (Cornell, 1983b) .. 2.8. INCUBATION OF ISOLATED HEPATOCYTES In all experiments, the isolated liver cells were incubated in K-H buffer containing 2.5%. BSA, with 13 mM ethanol, 10 mM lactate, 1 mM pyruvate, and inhibitor at the appropriate. concentration. Incubations were carried out at 37°C and were stopped by the addition of 0.05 m1. of 60% HCl04 per m1 of incubation mixture. The sample was then centrifuged at 1 3500 rpm for 4.5 minutes. The acidic supernatant was used for measurement of metabolite concentrations which were corrected for the HCI04 dilution..
(44) 29. Details of procedures for incubation of the isolated hepatocytes are described in chapter 3. 2.9. ETHANOL ASSAY Ethanol was measured in unneutralised acid samples using the yeast alcohol dehydrogenase. method of Dickinson & Dalziel (1967) as modified by Comell & Veech ( 1983). NADH produced in the ADH reaction is measured via absorption at 340 nm. Only 20 � of acidic supernatant was required for measurement of ethanol concentration. Each sample was assayed in triplicate and the ethanol assay had to be completed on the day of the. experiment because loss of ethanol in the samples was apparent if they were kept overnight. The yeast alcohol dehydrogenase solution was freshly prepared. A concentration of 0 . 1 mg/ml was required per reaction mixture. This enzyme will catalyse the oxidation of alcohols other than ethanol. These alcohols (e.g. propanol, butanol, ethylene glycol) interfere with the quantitative detection of ethanol; therefore it is important that the room where the assay is being performed is free of all possible alcohol contaminants. A reagent blank is prepared and any change in absorbance in the reagent blank is subtracted from the change in absorbance in the samples. The NAD+ (grade 111) was mixed with Tris/lysine buffer and deionised water within an hour. before carrying out the ethanol assay, to prevent increased absorbance due to the decomposition. products of NAD+ (Lowry & Passonneau, 1972) . The ethanol content of samples was calculated from the spectrophotometric measurement of NADH, using 6220 moi- 1 1 cm-1 as the molar absorption coefficient of NADH. 2.10. ACETALDEHYDE ASSAY Acetaldehyde (AcH) was enzymically measured using an automated distillation and. fluorometric technique developed by Stowell et al. (1978). Acetaldehyde is oxidised to acetate by yeast aldehyde dehydrogenase with production of NADH. NADH is then measured by fluorescence, with excitation at 350 nm and emission at 460 nm..
Figure


+7


Outline
Related documents
Assessing the Impact of Biodiversity Conservation in the Management of Maize Stalk Borer (Busseola f
Field experiments were conducted at Ebonyi State University Research Farm during 2009 and 2010 farming seasons to evaluate the effect of intercropping maize with
The paper assessed the challenges facing the successful operations of Public Procurement Act 2007 and the result showed that the size and complexity of public procurement,
Мөн БЗДүүргийн нохойн уушгины жижиг гуурсанцрын хучуур эсийн болон гөлгөр булчингийн ширхгийн гиперплази (4-р зураг), Чингэлтэй дүүргийн нохойн уушгинд том
19% serve a county. Fourteen per cent of the centers provide service for adjoining states in addition to the states in which they are located; usually these adjoining states have
It was decided that with the presence of such significant red flag signs that she should undergo advanced imaging, in this case an MRI, that revealed an underlying malignancy, which
Also, both diabetic groups there were a positive immunoreactivity of the photoreceptor inner segment, and this was also seen among control ani- mals treated with a
homelessness. Data was managed and themed with the assistance of Nvivo software. RESULTS: Four themes were generated from the data related to the experience of family
The paper is discussed for various techniques for sensor localization and various interpolation methods for variety of prediction methods used by various applications
