www.intl.elsevierhealth.com/journals/cobm
The functional form of the lognormal distribution as a sum of
decaying exponential and sinusoidal terms applied to the
isometric pinch force of human fingers
P.H. Chappell
a,∗, P.N. Taylor
baElectronics and Computer Science, University of Southampton, Highfield, Southampton SO17 1BJ, UK bMedical Physics and Biomedical Engineering, Salisbury District Hospital, Salisbury, Wiltshire SP2 8BJ, UK
Received 25 February 2005; accepted 25 July 2005
Abstract
The transient data of the pinch force produced between the human forefinger and thumb have been shown to fit the functional form of the well-known lognormal density function. Isometeric force generation is achieved by the stochastic recruitment of individual motor units, which sum together. Evidence from animal and human experiments demonstrates that the force generation can be modelled by underdamped terms. It is shown that a lognormal time series (distribution) can be fitted to a sum of exponential decaying sinusoidal terms.
䉷2005 Elsevier Ltd. All rights reserved.
Keywords:Lognormal distribution; Exponentially decaying sinusoids; Pinch force; Motor unit
1. Introduction
The motivation for this study of the pinch force is a desire to gain a better model of the natural mechanisms and processes of a musculoskeletal system and then to test it with people who have lost hand functionality. It does not follow that the model of a hand with normal functionality can be directly applied to an abnormal hand or vice versa but experiments and theories for both normal and abnormal cases should confirm similarities and highlight differences. A weak grip can be strengthened through the electrical stimulation of the nerves connected to the flexor muscles of the fingers and thumb. Mathematical
∗Corresponding author. Tel.: +44 02380 593442; fax: +44 02380 592901.
E-mail address:[email protected](P.H. Chappell).
models of the muscles (actuators) allow for good design of an electronic controller for a stimulator in order to obtain stable and robust responses to demand inputs. A better understanding of the normal musculoskeletal systems of the upper limb will lead to improvements in the functionality of, for example, stroke patients. A model does not need to contain all the features of the plant but sufficient information is needed in a form that is useful for analysis and subsequent controller design. Also the model can be used in simulations to identify the types of sensors needed and to investigate suitable control algorithms.
Muscles are organised in a complex way from the macroscopic to the microscopic [1]. Sarcomeres are the basic units of skeletal muscle and consist of thick (myosin) and thin (actin) filaments. At the cellular level, a sarcomere can be characterised in terms of several linear force-length equations for the ascending, plateau and descending parts. Different disciplines, Biological, Medical, Physical, Chemical and Engineering influence the modelling approach and the adoption of different mathematical expressions used. There are several and well-known models which are described briefly to put the approach adopted in this paper into context.
Most distinguished of the early models is attributed to Hill[2]. He discovered experimentally that a rectangular hyperbola relates the force to the velocity of muscle shortening at optimal length:
(F+A)(v+B)=(Fo+A)B, (1)
whereFis the steady-state force for shortening at a velocityv,Fois the maximal and isometric force at
optimal contractile length andAandBare constants with units of force and velocity, respectively. Huxley proposed the cross-bridge (or sliding filament) theory which combines the mechanical and biochemical properties of contraction with the structure of skeletal muscle [3]. In this theory muscle shortening is caused by the thin myofilaments sliding past the thick ones. He found good agreement between the predictions from his theory and the experimental results of Hill. The dynamics of the theory are still under investigation[4].
Generation of muscle force is brought about by the process of changing chemical energy into mechanical energy which is based on adenosinetriphosphate (ATP) as an energy storage device[1]. Cleavage of the phosphate bond results in a release of energy:
ATP4−+H2O→ADP3−+Pi2−+H++energy. (2)
In this paper, the force produced by a pinch grip in the human hand on a hard object is investigated which is largely isometric force generation in contrast to an object that has compliance where the fingers, thumb and palm will move as the grip-force increases.
2. Functional electrical stimulation
Evidence from animal experiments demonstrates that a transfer function,M, can be fitted to the data for FES as an input and force generation as an output[5,6].
A dynamic model of the medial gastrocnemius muscle for cats is given by
M= Ke−sT
M
[image:3.544.168.380.96.367.2]R C
Fig. 1. Closed loop model.
-a
jω
σ
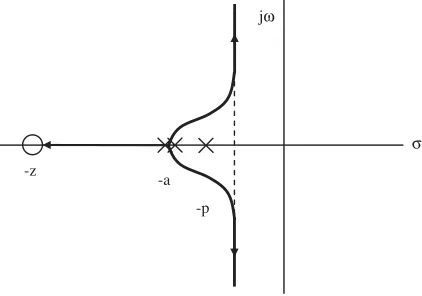
Fig. 2. Root locus for the double pole at−a.
where Kis a gain term,Tis a delay constant and ais a parameter. This second order system is appli-cable to isometric conditions where there is no velocity feedback. With length feedback only, a suitable arrangement is shown inFig. 1.
In practice there is a gain term in the feedback path and also a delay. However, for the purpose of studying the loop response, these can be lumped together into a single gain and delay.
The root locus plot for the open loop system without the delay term is shown inFig. 2.
As the gain increases the poles of the closed loop system remain parallel with the vertical axis forming a complex conjugate pair. The natural frequency of the oscillations to an impulse response increases while the decay rate of the transient remains constant.
The closed loop transfer function is given by
M
1+M =
K
(s+a)2+K. (4)
The FES input is approximately an impulse (less than 300s) when compared to the time constants and duration of the stimulation (period 25–50 ms).
For a unit impulse the input is
jω
σ
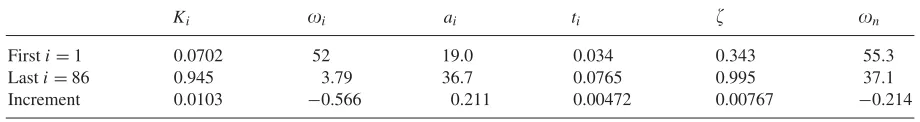
[image:4.544.166.377.99.247.2]-p -a -z
Fig. 3. Root locus for the double pole at−awith a zero at−zand a pole at−p.
The output from the closed loop is
C(s)= K
(s+a)2+K. (6)
Hence the output transient is given by
c(t)=exp(−at)sin(t),
where =K1/2. (7)
The decay rate is constant and the frequency is dependent on the square root of the gain.
A simulation of the system with a delay produces similar trends. As the gain increases, the time taken for the output to rise from zero, reach a peak and to fall to zero again (time to the first zero crossing) decreases which corresponds to an increase in the oscillatory frequency.
Including a joint in the system adds an extra pole and zero to the open loop transfer function:
J= K(s+z)
(s+p) . (8)
The root locus plot is shown inFig. 3.
As the gain increases the pole starting at ‘−p’ moves along the real axis to the zero at ‘−z’. The impulse response to this pole is a transient, with no oscillations, which decays more quickly as the gain increases. The oscillatory frequency of the transient from the double pole at ‘−a’ increases and decays more slowly eventually becoming constant at higher values of gain.
3. Pinch force
The force exerted on an object (width 60 mm) by the forefinger and thumb of human subjects has been investigated by Ramsay et al. [7]. In their experiments, a subject was required to generate a transient pinch force from 2 to 10 N on a force meter. A typical time record shows that the force, starting from a constant background value, increases to a peak and then decays down to the background force. The time-series data were shown to fit a lognormal model of the following form:
f −f0=Fmaxexp
−{ln(t−t0)−ln(tmax−t0)}2
22
, t > t0, (9)
wherefis the force exerted at timet,f0is the targeted background force,Fmaxis the maximum force,t0
is the time of the origin of the force,tmaxis the time at the maximum force andis a shape parameter.
It seems reasonable to suppose that the generated pinch force is the result of the recruitment of motor units and that such units have the time relationship from a second order model (Eq. (7)). The forces that they generate individually will sum together to form the overall smooth force,fs, given by the following
equation:
fs= N
i=1
Kiexp{−ai(t−ti)}sin{i(t−ti)}, t > ti, (10)
where the number of terms, amplitudes, frequencies, decay rates and time origins areN,Ki,,i,ai and
ti, respectively.
4. Computation
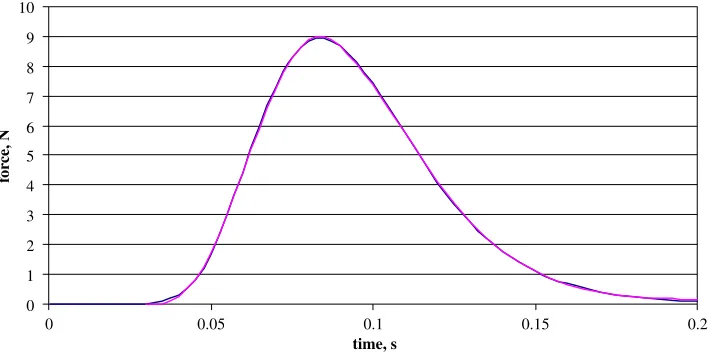
The sum of squares between the force from the lognormal Eq. (9) and the decay exponential Eq. (10) was minimised in order to determine values for the parametersKi,i andai. The time origins started at 0.034 s and were incremented every 0.0005 s. For 86 terms the two forces are shown inFig. 4with the difference between them inFig. 5. A linear relationship was used between the first(i=1)and last term
(i=86)for the amplitudes, frequencies and decay rates.Table 1shows the parameter values. The transfer function of a typical second order system is given by
G= 2n
s2+2
ns+2n
. (11)
The impulse response of this function is
c=n
1+2 exp(−nt)sin
n
1−2t
0 1 2 3 4 5 6 7 8 9 10
0 0.05 0.1 0.15 0.2
time, s
fo
[image:6.544.95.452.98.278.2]rce, N
Fig. 4. The forcesfandfs(in the original data the force is generated from a base line of 2 N).
-0.1 -0.08 -0.06 -0.04 -0.02 0 0.02 0.04 0.06 0.08 0.1
0 0.05 0.1 0.15 0.2
time, s
differ
[image:6.544.92.451.321.500.2]ence, N
Fig. 5. Difference between the forcesfandfs.
The damping and natural frequency are related through Eqs. (7) and (12) by the following expressions:
=√ a
2+a2, (13)
n=
2+a2. (14)
The values are shown in the right-hand columns ofTable 1.
Table 1
Parameter values forN=86
Ki i ai ti n
Firsti=1 0.0702 52 19.0 0.034 0.343 55.3
Lasti=86 0.945 3.79 36.7 0.0765 0.995 37.1
Increment 0.0103 −0.566 0.211 0.00472 0.00767 −0.214
Sum of squares=0.447.
0 1 2 3 4 5 6 7 8 9 10 11 12 13 14 15
0 20 40 60 80 100
number of terms, N
[image:7.544.97.451.227.415.2]Sum of squares
Fig. 6. Sum of squares against the number of terms.
smallest value was obtained for 11 terms (0.334). For a single term a better fit is obtained by adjusting the time origin. The sum of squares can then be reduced to 70.5.
5. Experiment
Eq. (9) was fitted to a single trace of the pinch force to determine how good a fit could be made for a single waveform. The experiment of Ramsay et al.[7]was repeated where a subject was asked to make a pinch force between the thumb and first finger. The force was measured using a Honeywell FSG-15N1A force sensor and the data collected on a Tektronix TDS 3032 digital oscilloscope.
0 2 4 6 8 10
0 0.05 0.1 0.15 0.2 0.25 0.3 0.35 0.4
time, s
fo
rc
e
[image:8.544.101.447.95.289.2], N
Fig. 7. The forces from a sample experimental waveform andfsfrom a base of 2 N.
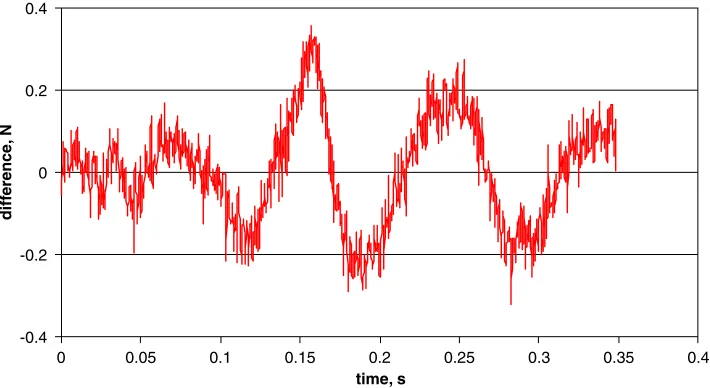
-0.4 -0.2 0 0.2 0.4
0 0.05 0.1 0.15 0.2 0.25 0.3 0.35 0.4
time, s
diff
erence
, N
Fig. 8. Difference between the sample experimental force waveform andfs.
6. Discussion
[image:8.544.94.449.335.529.2]Table 2
Parameter values forN=10
Ki i ai ti n
Firsti=1 0.430 18.3 5.75 0 0.299 19.2
Lasti=10 4.66 4.02 10.8 0.0388 0.937 11.5
Increment −0.470 1.59 −0.558 0.00430 −0.0709 0.858
Sum of squares=14.2, results from the waveform shown inFig. 7.
Table 3
Parameter values forN=10
Ki i ai ti n
Firsti=1 0.472 51.0 18.9 0.034 0.347 54.4
Lasti=10 9.28 2.49 39.4 0.0765 0.998 39.5
Increment −0.979 5.39 −2.28 0.00472 −0.0724 1.66
Sum of squares=0.345015, results from the lognormal Eq. (9).
The damping ratios were mainly less than unity. In their experiment with twitch contractions they found nonoscillatory responses with damping ratios less than one. These results suggest that Eq. (6) is a good representation of the dynamics of a muscle under isometric conditions.
When an object is held in a pinch grip there are several muscles contributing force on the object in order to maintain a stable system. A transient increase and then decrease in force is achieved from muscles that move the first finger and the thumb. A major muscle connected to the first phalanx of the forefinger is the flexor digitorum profundus, sited deep in the forearm[9]. This muscle attaches to the distal phalanx of all four fingers. To form a pinch grip requires a finger and the thumb to be in opposition. The thumb is rotated so that the plane of fingernail is parallel to that of the thumbnail. Rotation of the metacarpal at its saddle-shaped joint with the Trapezium is produced by the skew pull of the Oppenens Pollicis muscle. Opposition is assisted by the Abductor Pollicis Brevis, which abducts and slightly rotates the proximal phalanx at the metacarpal–phalangeal joint.
[image:9.544.45.503.251.309.2]The computation was repeated using terms which are only critically damped (two identical poles in their transfer function). The force is then given by
fs= N
i=1
Ki(t−ti)exp{−ai(t−ti)}, t > ti. (15)
The sum of squares is much greater than that for the underdamped case and there are significant differences especially at the peak force.
Since the logarithm is minus infinity for a value of zero, care has to be taken in using the lognormal equation and hence the use of offsets in the force and time origin (f0 andt0).
The results demonstrate that a lognormal function (distribution) can be approximated by a sum of decaying sinusoidal terms (Eq. (10)). For isometric muscle contraction, this result can be related to the individual motor units if they are represented by a second order differential equation. The relationship maybe of value in time-series data found in other disciplines[10]. For example, the lognormal distribution has been fitted to reaction times[11]. Also the summation could be used for identifying components in data from the natural and social sciences.
7. Conclusions
It has been found that the lognormal function (distribution) can be approximated by a sum of lagging terms consisting of exponentially decaying sinusoids. For the pinch force generated between the first finger and thumb on a solid object, the terms are modelled by a second order differential and underdamped equation. The summation suggests that individual motor units can be characterised by these equations. The summation maybe of use to other systems found in the natural and social sciences where a lognormal distribution fits the data.
8. Summary
The transient data of the pinch force produced between the human forefinger and thumb have been shown by Ramsay and colleagues to fit the functional form of the well-known lognormal density function. Isometeric force generation is achieved by the stochastic recruitment of individual motor units, which sum together. Evidence from functional electrical stimulation experiments demonstrates that the force generation can be modelled in terms of systems which are governed by second order differential equations. The impulse responses of these systems produce a force that is underdamped and consists of exponential decaying sinusoidal terms. Parameter values are determined by minimising the square of the sum of the difference between the summated force consisting of exponential decaying sinusoidal terms and the lognormal function. It is shown that a lognormal time series (distribution) can be fitted to a sum of decaying sinusoidal terms and could therefore be applied to other systems found in the natural and social sciences.
References
[2] A.V. Hill, The heat of shortening and the dynamic constants of muscle, Proc. R. Soc. London B 126 (1938) 136–195. [3] A.F. Huxley, Muscle structure and theories of contraction, Prog. Biophys. Chem. 7 (1957) 255–318.
[4] J.Z. Wu, W. Herzog, G.K. Cole, Modeling dynamic contraction of muscle using the cross-bridge theory, Math. Biosci. 139 (1) (1997) 69–78.
[5] B.H. Zhou, M. Solomonow, R. Baratta, R. D’Ambrosia, Dynamic performance model of an isometric muscle-joint unit, Med. Eng. Phys. 17 (2) (1995) 145–150.
[6] J. Bobert, R.B. Stein, M.N. Oguztoreli, A linear time-varying model of force generation in skeletal muscle, IEEE Trans. Biomed. Eng. 40 (10) (1993) 1000–1006.
[7] J.O. Ramsay, X. Wang, R. Flanagan, A functional data analysis of the pinch force of human fingers, Appl. Statist. 44 (1) (1995) 17–30.
[8] P. Bawa, R.B. Stein, Frequency response of human soleus muscle, J. NeuroPhysiol. 39 (4) (1976) 788–793.
[9] S.L. Kilbreath, R.B. Gorman, J. Raymond, S.C. Glandevia, Distribution of the forces produced by motor unit activity in the human flexor digitorum profundus, J. Physiol. 543 (1) (2002) 289–296.
[10] E.L. Crow, K. Shimizu (Eds.), Lognormal Distributions Theory and Applications, Marcel Dekker, NY, 1988, (ISBN 0-8247-7803-0).
[11] R. Ulrich, J. Miller, Information processing models generating lognormally distributed reaction times, J. Math. Psychol. 37 (1993) 513–525.
Paul H Chappellis a Senior Lecturer and a member of the Electronics and Systems Design Research Group in the School of Electronics and Computer Science. He graduated from the University of Sussex with a first-class Honours degree in electronics and was awarded a PhD degree in control from the University of Southampton. His research interests are in Medical Engineering, particularly Prosthetics and Functional Electrical Stimulation. He was a guest editor for a special issue on “Advances in the control of prosthetic arms” for Technology & Disability (2003) and for Robotica (2005). He has over 70 publications (journal papers, conference proceedings, chapters in books and a patent). Dr Chappell is a Chartered Engineer, a Member of the Institution of Electrical Engineers, and a Member of the Institute of Physics and Engineering in Medicine.