1
Reversible adsorption and confinement of nitrogen dioxide within a
Robust Porous Metal-Organic Framework
Xue Han,1 Harry G.W. Godfrey,1 Lydia Briggs,1 Andrew J. Davies,2 Yongqiang Cheng,3 Luke L. Daemen,3 Alena
M. Sheveleva,1,4 Floriana Tuna,1 Eric J.L. McInnes,1 Junliang Sun,5 Christina Drathen,6 Michael W. George,2,7
Anibal J. Ramirez-Cuesta,3 K. Mark Thomas8 Martin Schröder1* and Sihai Yang,1*
[1] School of Chemistry, University of Manchester, Manchester, M13 9PL (UK)
[2] School of Chemistry, University of Nottingham, University Park, Nottingham, NG7 2RD (UK)
[3] The Chemical and Engineering Materials Division (CEMD), Neutron Sciences Directorate, Oak Ridge National
Laboratory, Oak Ridge, TN 37831 (USA)
[4]International Tomography Center SB RAS and Novosibirsk State University, Novosibirsk, 630090 (Russia)
[5] College of Chemistry and Molecular Engineering, Peking University, Beijing, 100871 (China)
[6] European Synchrotron Radiation Facility, Grenoble, 38043 (France)
[7] Department of Chemical and Environmental Engineering, University of Nottingham Ningbo China, Ningbo,
315100 (China)
[8] Northern Carbon Research Laboratories, School of Chemical Engineering and Advanced Materials, University of
2 Nitrogen dioxide (NO2) is a major air pollutant causing significant environmental problems1,2 and premature
death3,4. We report the first example of reversible adsorption of NO
2 in a robust metal-organic framework. At
ambient conditions, MFM-300(Al) exhibits a reversible NO2 isotherm uptake of 14.1 mmol/g, and, more
importantly, an exceptional performance of selective removal of low concentration NO2 (5000 to <1 ppm) from
gas mixtures. Complementary experiments reveal five types of supramolecular interactions cooperatively
binding both NO2 and N2O4 molecules within MFM-300(Al). We find that the in situ equilibrium 2NO2↔N2O4
within the pores is pressure-independent, whereas ex situ in unrestricted space this equilibrium is an exemplar
first-order process dependent upon pressure. The unusual co-existence of helical monomer-dimer chains of
NO2 in MFM-300(Al) offers a new fundamental understanding of the chemical properties of guest within
porous hosts, and successful breakthrough experiments pave the way for the development of future capture
and conversion technologies.
NO2 is the most prevalent form of NOx that is generated by anthropogenic activities and is an important feedstock for
chemical industry. Mitigation of NOx pollution is a complex issue, not least because of its highly reactive, oxidizing
and corrosive nature5. Physisorption of gases by porous materials using supramolecular host-guest interactions is a
promising approach that can give high reversibility and low energy penalty for system regeneration, and zeolites6,
metal oxides7, mesoporous silica8 and activated carbons9,10 have been investigated for NO
2 adsorption. However, these
materials suffer from low adsorption capacities and the high reactivity of NO2 often affords irreversible uptake within
these porous solids, leading to disproportionation to NO+ and NO
3- coupled with oxidation and degradation of the
interior of the host material6-10.
Porous metal-organic frameworks (MOFs) are emerging solid adsorbents11, but isothermal adsorption of NO 2
in MOFs has not been reported. Additionally, experimental insights into the nature of NO2∙∙∙host interactions at surface
sites and NO2∙∙∙NO2 interactions within confined nano-pores are rarely explored and poorly understood. Herein, we
describe an ultra-robust material, MFM-300(Al), showing unprecedented reversible and selective adsorption of NO2.
MFM-300(Al) can be fully regenerated post adsorption without loss of crystallinity or porosity. We also report the application of high resolution synchrotron X-ray powder diffraction (PXRD), Fourier transform infrared (FTIR), electron paramagnetic resonance (EPR) andinelastic neutron spectroscopy (INS) coupled with density functional theory (DFT) and molecular dynamic (MD) calculations to directly visualise the binding domains, dynamics of host-guest interactions, reactivity and chemical behaviour of adsorbed NO2 within MFM-300(Al). These complementary
experiments using dynamic, kinetic and static approaches reveal five different types of soft supramolecular interactions cooperatively binding both NO2 and N2O4 molecules within the functionalized cavities of MFM-300(Al).
The cooperativity of these soft interactions directly explains the optimal uptake and selectivity for NO2 in
3
MFM-300(Al) was selected for the study of NO2 adsorption because of its exceptional stability12. At 298 K,
the maximum NO2 isotherm uptake in MFM-300(Al) was measured as 14.1 mmol g-1 (64.9 wt% or 316 cm3 g-1/STP)
at 1.0 bar (Fig. 1a).This uptake is much higher than values reported for modified Y zeolites6, mixed oxides Ce
1-xZrxO27, amine-functionalized SBA-158, urea-modified mesoporous carbons9, and activated carbons10.Although the
NO2 capacities of a number of MOFs13-16, metal-doped MOFs17 and MOF/graphite oxide composites18,19 have been
estimated from (micro)breakthough experiments using mixtures of gases containing 1000-2000 ppm of NO2 (Table
S4), these cannot be compared with the direct uptakes obtained here via isotherm experiments with pure NO2 (see SI).
Significantly, the NO2 uptake in MFM-300(Al) is fully reversible, and the host material can be regenerated with full
retention of structure and porosity for at least 5 cycles (Fig. S2). The isosteric heats of adsorption (Qst) of NO2 in
MFM-300(Al) is ca. 50 kJ mol-1at a surface coverage of 2-8 mmol g-1. The absence of notable variation of Q
st as a
function of surface coverage indicates the presence of uniform host-guest and guest-guest interactions. The binding energy of NO2 in MFM-300(Al) has also been obtained by DFT calculations at a loading of 14.5 mmol g-1 (equivalent
to 3NO2/Al), to be 44 kJ mol-1.
We were interested to analyse the IAST selectivity of NO2 with respect to other components of exhaust gases
SO2, CO2 and N2 (Figs. 1c, S29). At 298 K and 1 bar, MFM-300(Al) shows a selectivity of 18.1, 248 and >10,000 for
NO2/SO2, NO2/CO2 andNO2/N2 mixtures, respectively. The adsorptive removal of low concentrations of NO2 by
MFM-300(Al) has been confirmed in breakthrough experiments in which a stream of NO2 (5000 ppm diluted in He/N2)
was flowed over a packed bed of MFM-300(Al) under ambient conditions (Fig. 1d). As expected, He and N2 were
the first to elute through the bed (dimensionless time = 180), whereas NO2 was selectively retained. Upon saturation
(dimensionless time >5000), NO2 breaks through from the bed and reaches saturation rapidly. As measured from this
breakthrough experiment, for an entering feed of 5000 ppm NO2, the NO2 composition can be purified to below 1
ppm (below the detection limit of the mass spectrometry) until the breakthrough. The capability of MFM-300(Al) to capture NO2 in presence of moisture has been demonstrated by breakthrough experiments using wet NO2 gas stream
(Fig. 1d). In presence of water vapour, the breakthrough of NO2 from MFM-300(Al) slightly reduced to 4600
(dimensionless time) as a result of competitive adsorption of water. The selective retention of NO2 by MFM-300(Al)
has also been confirmed in competitive breakthrough experiments using gas mixtures containing CO2 or SO2 (Figs.
1e-f). In both cases, CO2 and SO2 were the first to elute through the bed and NO2 was selectively retained in the bed
until breakthrough, consistent with the estimation of adsorption selectivity data. Thus these results from static and dynamic adsorption experiments both indicate the potential of utilizing MFM-300(Al) for NO2 capture.
The density of adsorbed NO2 molecules in MFM-300(Al) is estimated to be 1.73 g cm-3 at 298 K and 1.0 bar.
Interestingly, this is higher than that of liquid NO2 and N2O4 (1.45 g cm-3 and 1.44 g cm-3, respectively, at 294 K), but
4 pore. Synchrotron powder X-ray diffraction (PXRD) data collected upon NO2 adsorption at 298 K revealed two
independent binding sites (I and II, assigned as NO2 and N2O4 molecules, respectively) within the pore of
MFM-300(Al). The final structural model for MFM-300(Al)·(NO2)2·(N2O4)2 has been validated by Rietveld refinement and
DFT calculations (Figs. 2). The total crystallographic occupancy of NO2 molecules (2.82 NO2/Al) is in excellent
agreement with that obtained from the isotherm experiment (2.92 NO2/Al) at the same temperature and pressure. The
NO2 molecules at site I (occupancy = 1.00) exhibit an end-on interaction to the HO-Al group via formation of
moderate-to-weak hydrogen bonds (ONO2···HO = 2.00 Å) that are supplemented by additional four-fold
supramolecular contacts of the O(δ-) centre of NO2to the aromatic hydrogen atoms (δ+) (O···HC = 2.62, 2.66, 3.35,
3.40 Å) and a strong dipole interaction between the N(δ-) centre of NO2 molecule and the C(δ+) centre of the
carboxylate group (N···C = 3.11 Å). N2O4 molecules (occupancy = 0.91) at site II are located in the middle of the
pore and interact primarily with the NO2 molecules at site I via a three-fold intermolecular dipole interactions (Nd···Om
= 3.80-3.91 Å). In addition, N2O4 molecules at site II form intermolecular dipole interactions with adjacent N2O4
molecules (Nd···Od = 2.95, 3.08 Å); these are comparable to those observed in solid N
2O4 (NI···OII = 3.13 Å) studied
by neutron diffraction at 20 K20, confirming that the adsorbed N
2O4 in MFM-300(Al) has a restricted solid-state type
arrangement. Thus, in total, five types of weak interactions interact cooperatively to bind NO2 molecules (up to nine
individual contacts; Fig. 2b) within the functionalized cavity.
The alternate presence of NO2 and N2O4 molecules at sites I and II affords a distinct 1D helical (NO2·N2O4)∞
chain running along the channel of MFM-300(Al) (Fig. 2c). These 1D chains are stabilized by multiple weak intermolecular dipole interactions originated by monomer···dimer and dimer···dimer. Importantly, the unusual stability of the (NO2·N2O4)∞ chain within MFM-300(Al) has also been confirmed by molecular dynamics modelling,
which suggests that between room temperature and 600 K, the chain in the MOF remains stable within the simulation timescale (10ps), whereas the chain outside the MOF matrix will collapse entirely. Interestingly, locations of adsorbed NO2 molecules have been determined in a 1D compound [Rh2(bza)4(pyz)] (bza- = benzoate; pyz = pyrazine), where
all adsorbed NO2 molecules are found in the dimeric form and no notable guest-guest interaction was observed21.
Recently, locations of adsorbed NO2 molecules have also been studied in a zeolite, Ba-Y-FAU, in which three
different ionic NOx species (NO+, NO+−NO2, and NO3−) are observed in the pore22. In contrast, to our knowledge, the
alternating (monomer···dimer) ∞ chain described herein represents the first example of co-existence of NO2 and N2O4
molecules within a crystalline matrix.
Inelastic neutron scattering (INS) enabled the direct visualization of the binding dynamics for MFM-300(Al)·(NO2)2·(N2O4)2 with particular focus on the motion of hydrogen atoms involved in the supramolecular
5 respectively) and Peaks III, IV, V and VI at high energy transfer (85, 114, 119-132 and 135-161 meV, respectively). To understand the changes, simulated INS spectra were obtained via DFT calculations based upon the structure model of MFM-300(Al)·(NO2)2·(N2O4)2 and show excellent agreement with experimental spectra (Figs. 2h-j). Peak I
corresponds to a series of lattice modes of MFM-300(Al), the decrease in peak intensity being consistent with the NO2 inclusion. Peaks II and III can be assigned to the deformational modes (i.e., bending and wagging) of –OH groups
perpendicular to the Al-O-Al plane and of –CH groups on two benzene rings adjacent to each NO2 molecule,
respectively. Peaks IV and VI can be assigned to out-of-plane and in-plane –CH bending modes, respectively. Finally, peak V corresponds to the in-plane bending modes of the –OH groups. The notable changes observed for Peaks II-VI suggest that adsorbed NO2 molecules have direct interaction with the -OH and -CH groups, thereby affecting their
molecular motions and inducing the changes observed in INS spectra.
In order to probe the phase equilibrium of adsorbed NO2 and N2O4 molecules within MFM-300(Al), the
effect of exposing discs of MFM-300(Al) in KBr to varying pressures of NO2 (0-1 bar) at 298 K was monitored in
the region 2760 – 3200 cm-1 by FTIR spectroscopy. Three bands were observed (Fig. 3a), which have previously been
assigned23 to a combination band of NO
2 at 2903 cm-1 and combination bands for the dimer, N2O4, at 2962 and
3120 cm-1. Fig. 3b shows the IR spectra recorded of MFM-300(Al) exposed to various pressures of NO
2. Several IR
peaks due to MFM-300(Al) were also observed in this region, and, therefore, a spectrum recorded under vacuum was used as the background (Fig. 3c). New bands were observed at 2829, 2946 and 3083 cm-1 (Fig. 3d), and these increased
in intensity with increasing NO2 pressure. By comparison to the free gas, these new bands were assigned to the
formation of adsorbed monomer (NO2 at 2829 cm-1) and dimer (N2O4 at 2946 and 3083 cm-1) within MFM-300(Al).
These bands are red-shifted relative to the free gas, and interestingly, the redshift of the monomer band (Δ = 74 cm-1)
is significantly larger than those of the dimer (Δ = 16, 37 cm-1), indicating that a stronger host-guest interaction occurs
at the monomer site, consistent with the structural model of MFM-300(Al)·(NO2)2·(N2O4)2. The increase in band
areas is consistent with the gas adsorption isotherm (Fig. 3f), with bands due to monomer and dimer observed to grow with pressure at approximately the same rate. Fig. 3g compares the ratio of the area of the IR bands due to dimer and monomer for the free gas (at 2962 and 2903 cm-1, respectively) and adsorbed phase (at 2946 and 2829 cm-1
respectively). In the gas phase, the ratio of dimer to monomer increases linearly with increasing pressure. However, the ratio of the dimer to monomer within the pores of MFM-300(Al) was constant across the pressure range studied. Moreover, this observation is consistent with the kinetic PXRD results (Fig. 3g), which show concurrent settlement of NO2 and N2O4 molecules in the pore as a function of time. Thus, significantly, the equilibrium of the
monomer-dimer (2NO2↔N2O4) transition is pressure-independent within the confined nano-voids of MFM-300(Al).
The presence of a single type of adsorbed NO2 monomers, which are paramagnetic, is shown definitively by
6 diamagnetic]. EPR spectra at 40 K show immobilised NO2 with full resolution of the anisotropic electronic g-factor
and 14N hyperfine interaction24; at higher temperatures partial motion of the NO
2 is observed (Fig. S27). The
interaction of NO2 with the MOF interior is revealed by Davies ENDOR (electron nuclear double resonance)
spectroscopy that resolves 1H hyperfine interactions (Fig. 4b). Calculated spectra25 confirm binding of NO
2 at site I,
consistent with the endon interaction with the –OH group and further interactions with the four adjacent aromatic -CH groups. Orientation selective ENDOR measurements show that the largest 1H coupling to the –OH group is
observed along the molecular NO2 axis which is parallel to the O···O vector, further confirming the end-on binding
unambiguously. Importantly, EPR data has also confirmed that electron transfer from NO2 to the MOF does not occur,
directly supporting the observed unusual reversibility of NO2 uptake and hence the stability of the framework.
Our studies confirm that the interior of MFM-300(Al) can participate in weak additive, supramolecular interactions to stabilize the highly reactive NO2 molecules with retention of its unpaired electron within the pore. A
combination of these cooperative supramolecular interactions and spatial restriction within nanopores has enabled the unprecedented co-existence of NO2 and N2O4 molecules and promoted the unusual stability of the extended
(NO2·N2O4)∞ chains within MFM-300(Al) as a crystalline matrix. The potential use of robust MOFs as viable solid
sorbents for adsorptive removal of NO2 could provide an exciting avenue to mitigate NOx emissions.
References
1. Lelieveld, J. et al. Atmospheric oxidation capacity sustained by a tropical forest. Nature 452, 737-740 (2008).
2. Edwards, P. M. et al. High winter ozone pollution from carbonyl photolysis in an oil and gas basin. Nature 514, 351-354 (2014).
3. Chen, Z. Wang, J. Ma, G. Zhang, Y. China tackles the health effects of air pollution. Lancet, 382, 1959-1960 (2013).
4. Feigin, V. L. et al. Global burden of stroke and risk factors in 188 countries, during 1990-2013: a systematic analysis for the global burden of disease study 2013. Lancet Neurol. 15, 913-924 (2013). 5. Rezaei, F., Rownaghi, A. A., Monjezi, S., Lively, R. P. & Jones, C. W. SOx/NOx removal from flue gas
streams by solid adsorbents: a review of current challenges and future directions. Energy & Fuels 29, 5467-5486 (2015).
6. Goupil, J. M., Hemidy, J. F., Cornet, D. Adsorptin of NO2 on modified Y zeolites. Zeolites 2, 47-50 (1982).
7. Levasseur, B., Ebrahim, A. M. & Bandosz, T. J. Role of Zr4+ cations in NO
2 adsorption on Ce1-xZrxO2
mixed oxides at ambient conditions. Langmuir 27, 9379-9386 (2011).
8. Levasseur, B., Ebrahim, A. M. & Bandosz, T. J. Interactions of NO2 with amine-functionalized SBA-15:
effects of synthesis route. Langmuir 28, 5703-5714 (2012).
9. Florent, M., Tocci, M. & Bandosz, T. J. NO2 adsorption at ambient temperature on urea-modified ordered
mesoporous carbon. Carbon 63, 283-293 (2013).
10. Belhachemi, M., Jeguirim, M., Limousy, L. & Addoun, F. Comparison of NO2 removal using date pits
activated carbon and modified commercialized activated carbon via different preparation methods: effect of porosity and surface chemistry. Chem. Eng. J. 253, 121-129 (2014).
11. Zhou, H. C. and Kitagawa, S. Metal–organic frameworks (MOFs). Chem. Soc. Rev. 43, 5415 (2014). 12. Yang, S. et al. Selectivity and direct visualization of carbon dioxide and sulfur dioxide in a decorated
7 13. Ebrahim, A. M. & Bandosz, T. J. Effect of amine modification on the properties of zirconium–carboxylic
acid based materials and their applications as NO2 adsorbents at ambient conditions. Microporous
Mesoporous Mater. 188, 149-162 (2014).
14. Ebrahim, A. M., Levasseur, B. & Bandosz, T. J. Interactions of NO2 with Zr-based MOF: effects of the size
of organic linkers on NO2 adsorption at ambient conditions. Langmuir 29, 168-174 (2013).
15. Peterson, G. W., Mahle, J. J., DeCoste, J. B., Gordon, W. O. & Rossin, J. A. Extraordinary NO2 removal by
the metal–organic framework UiO-66-NH2. Angew. Chem. Int. Ed. 55, 6235-6238 (2016).
16. DeCoste, J. B., Demasky, T. J., Katz, M. J., Farha, O. K. & Hupp, J. T. A UiO-66 analogue with
uncoordinated carboxylic acids for the broad-spectrum removal of toxic chemicals. New J. Chem. 39, 2396-2399 (2015).
17. Ebrahim, A. M. & Bandosz, T. J. Ce(III) Doped Zr-based MOFs as excellent NO2 adsorbents at ambient
conditions. ACS Appl. Mater. Interfaces 5, 10565-10573 (2013).
18. Levasseur, B., Petit, C. & Bandosz, T. J. Reactive adsorption of NO2 on copper-based metal−organic
framework and graphite oxide/metal−organic framework composites. ACS Appl. Mater. Interfaces 2, 3606-3613 (2010).
19. Petit, C., Levasseur, B., Mendoza, B. & Bandosz, T. J. Reactive adsorption of acidic gases on MOF/graphite oxide composites. Microporous Mesoporous Mater. 154, 107-112 (2012).
20. Kvick, Å., McMullan, R. K. & Newton, M. D. The structure of dinitrogen tetroxide N2O4: neutron
diffraction study at 100, 60, and 20 K and ab initio theoretical calculations. J. Chem. Phys. 76, 3754-3761 (1982).
21. Kachi-Terajima, C., Akatsuka, T., Kohbara, M.-a. & Takamizawa, S. Structural and magnetic study of N2,
NO, NO2, and SO2 adsorbed within a flexible single-crystal adsorbent of [Rh2(bza)4(pyz)]n. Chem. Asian J.
2, 40-50 (2007).
22. Wang, X., Hanson, J. C., Kwak, J. H., Szanyi, J. & Peden, C. H. F. Cation movements during dehydration and NO2 desorption in a Ba–Y, FAU zeolite: an in situ time-resolved X-ray diffraction study. J. Phys.
Chem. C 117, 3915-3922 (2013).
23. Guttman, A. Absolute infrared intensity measurements on nitrogen dioxide and dinitrogen tetroxide. J. Quant. Spectrosc. Radiat. Transfer 2, 1-15 (1962).
24. Shlotani, M. and Freed, J. H. ESR studies of NO2 adsorbed on surfaces: analysis of motional dynamics. J.
Phys. Chem. 85, 3873-3883 (1981).
25. Stoll, S. and Schweiger, A. EasySpin, a comprehensive software package for spectral simulation and analysis in EPR. J. Magn. Reson. 178, 42-55 (2006).
Methods
NO2 safety: All systems involved in the supply, delivery and measurement of NO2 were rigorously leak tested and
used only within range of a NO2 detection system with a sensitivity of 1 ppm. All gases exhausted from experimental
apparatus was diluted with a flow of N2 and fed into fume hood extracts.
Gas adsorption isotherms and breakthrough experiment: Measurements of NO2 adsorption isotherm (0–1 bar)
were performed using a Xemis gravimetric adsorption apparatus (Hiden Isochema, Warrington, UK) equipped with a clean ultrahigh vacuum system. The pressure in the system is accurately regulated by mass flow controllers. Research grade NO2 and He were purchased from AIRLIQUIDE or BOC and used as received. In a typical gas
adsorption experiment, 70-100 mg of MFM-300(Al)-solvate was loaded into the IGA, and degassed at 120 oC and
high dynamic vacuum (10-10 bar) for 1 day to give desolvated MFM-300(Al).
8 was heated at 150 oC under a flow of He for 2 days for complete activation. The fixed bed was then cooled to room
temperature (298 K) using a temperature programmed water bath and the breakthrough experiment was performed with a stream of 0.5% NO2 (diluted in He and N2) at atmospheric pressure and room temperature. The flow rate of
the entering gas mixture was maintained at 40 mL min-1, and the gas concentration, C, of NO
2 and N2 at the outlet
determined by mass spectrometry and compared with the corresponding inlet concentration C0, where C/C0 = 1
indicates complete breakthrough. A more detailed description is given in SI.
High resolution synchrotron X-ray powder diffraction and structure determinations: High resolution in situ synchrotron X-ray powder diffraction (PXRD) data were collected at Beamline ID22 of European Synchrotron Radiation Facility (ESRF) using monochromated radiation [λ = 0.399999(2) Å]. These in situ diffraction measurements were carried out in capillary mode and the temperature controlled by an Oxford Cryosystems open-flow N2 gas cryostat. In a typical experiment, the powder sample of MFM-300(Al)(~2 mg) was dried in air and
ground for 10 mins before loading into a capillary tube (0.7 mm diameter). Grinding provides a uniform and small (below 10 micron) particle size essential for obtaining high-quality X-ray patterns. The capillary tube was connected to high vacuum (10-6 mbar) and heated at 150 oC for ~4 h to generate desolvated MFM-300(Al). Upon loading of NO
2
into MFM-300(Al) at 1 bar and 298 K, a series of rapid scans (~10 mins each) were collected to capture the changes in the unit cell parameters as a function of time. Longer scans (~20 mins each) were collected when reaching the adsorption equilibrium at 298 K. A PXRD pattern was also collected after a final degassing under heating for ~1h to remove adsorbed NO2 molecules. A second cycle of NO2 adsorption/desorption was also carried out to test the
structural stability and durability of this MOF material. Upon desolvation and NO2 loading, we observe neither
changes to cell parameters nor additional/missing features in the patterns, suggesting that there is no structural phase change during the experiment.
The structure solutions were initially established by considering the structure of bare MFM-300(Al) framework, and the residual electron density maps were further developed from subsequent difference Fourier analysis using TOPAS. Lattice parameters were obtained from Le Bail refinements of the PXRD data. The final structure refinement of MFM-300(Al)·(NO2)2·(N2O4)2was carried out using the Rietveld method with isotropic
displacement parameters for all atoms. Upon the NO2 loading, there are apparent changes in intensities of the Bragg
peak indicating that the NO2 molecules are adsorbed into the material. NO2 and N2O4 molecules at each site were
determined to be nearly fully occupied, in excellent agreement with the experimental isotherm value. The final stage of the Rietveld refinement involved soft restraints to the C-C bond lengths within the benzene rings. Rigid body refinement was applied to the NO2 and N2O4 molecules in the pore.
Crystal data for MFM-300(Al)·(NO2)2·(N2O4)2: [Al2(OH)2(C16H6O8)]·(NO2)2·(N2O4)2. Yellow powder. Tetragonal,
9 final Rietveld plot corresponds to satisfactory crystal structure model (RBragg = 0.018) and profile (Rp = 0.043 and Rwp
= 0.058) indicators with a goodness-of-fit parameter of 1.750.
Supplementary Information is available in the online version of the paper.
Acknowledgements We thank EPSRC (EP/I011870), ERC (AdG 226593) and Universities of Manchester and Nottingham for funding. We thank EPSRC for funding of the EPSRC National Service for EPR Spectroscopy at Manchester. We are especially grateful to ORNL and ESRF for access to the Beamlines VISION and ID22, respectively. We thank Dr Catherine Dejoie for the help at Beamline ID22 in ESRF.The computing resources were made available through the VirtuES (Virtual Experiments in Spectroscopy) project, funded by Laboratory Directed Research and Development program (LDRD 7739) at ORNL. AMS thanks the Russian Science Foundation (Grant no. 17-73-10320) and the Royal Society of Chemistry for funding. MS acknowledges the Russian Ministry of Science and Education for the award of a Russian Megagrant (14.Z50.31.0006).
Author Contributions SY, HGWG, XH and LB: syntheses, characterisation of MOF samples, measurements of adsorption isotherms and breakthrough data. KMT: analysis of isotherms. SY, JS and CD: collection and analysis of synchrotron X-ray powder diffraction data. SY, YC, LLD and AJRC: collection and analysis of neutron scattering data. AJD and MWG: collection and analysis of IR data. XH, AMS, FT and EJLM: collection and analysis of EPR data. SY and MS: overall direction of project and preparation of the manuscript.
Author Information The crystal structure of MFM-300(Al)·(NO2)2·(N2O4)2 is available free of charge from the
Cambridge Crystallographic Data Centre under reference number CCDC-1539036. Reprints and permissions information is available at www.nature.com/reprints. The authors declare no competing financial interests. Correspondence and requests for materials should be addressed to S.Y. (Sihai.Yang@manchester.ac.uk) and M.S. (M.Schroder@manchester.ac.uk).
Competing financial interests The authors declare no competing financial interests.
10
Figures and Legends
a b
c d
[image:10.612.54.541.111.692.2]
e f
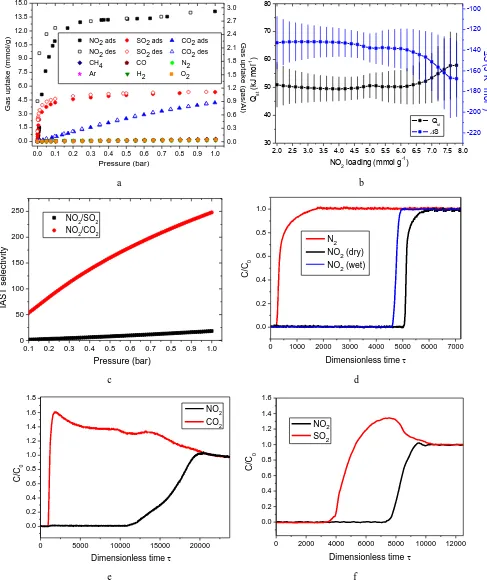
Figure 1. NO2 adsorption, thermodynamics, selectivity and breakthrough data in MFM-300(Al). (a) Adsorption isotherms
of NO2, SO2, CO2, CH4, N2, CO, H2, O2 and Ar in MFM-300(Al) at 298 K. (b) Variation of the thermodynamic parameters of
isosteric heat of adsorption (Qst) and entropy (ΔS) for NO2 uptakes in MFM-300(Al). Overall, ΔS decreases slowly with
increasing surface coverage. (c) Comparison of IAST selectivities for equimolar mixtures of NO2/SO2 and NO2/CO2 (NO2/N2
data shown in SI) at 0.1-1.0 bar for MFM-300(Al) at 298 K. IAST calculations at low pressure (<0.1 bar) carries very large uncertainties due to the insufficient integration of spreading pressure and are thus not reported. (d) Dimensionless breakthrough curve of 0.5% NO2 (5000 ppm) diluted in He/N2 under both dry and wet conditions in a fixed-bed packed with MFM-300(Al)
at 298 K and 1 bar. (e) Dimensionless breakthrough curve of 0.4% NO2 (4000 ppm) and 15% CO2 (v/v) diluted in He in a
fixed-bed packed with MFM-300(Al) at 298 K and 1 bar. (f) Dimensionless breakthrough curve of 0.16% NO2 (1666 ppm) and
0.34% SO2 (3334 ppm) diluted in He in a fixed-bed packed with MFM-300(Al) at 298 K and 1 bar.
0.0 0.1 0.2 0.3 0.4 0.5 0.6 0.7 0.8 0.9 1.0
0.0 1.5 3.0 4.5 6.0 7.5 9.0 10.5 12.0 13.5 15.0
NO2 ads SO2 ads CO2 ads
NO2 des SO2 des CO2 des
CH4 CO N2
Ar H2 O2
Gas upt ak e (gas /Al) Gas upt ak e (m m ol/ g) Pressure (bar) 0.0 0.3 0.6 0.9 1.2 1.5 1.8 2.1 2.4 2.7 3.0
2.0 2.5 3.0 3.5 4.0 4.5 5.0 5.5 6.0 6.5 7.0 7.5 8.0 30 40 50 60 70 80
Qst
S
NO2 loading (mmol g-1)
Qst (k J m ol -1 ) -220 -200 -180 -160 -140 -120 -100 S (J K -1 m ol -1 )
0.1 0.2 0.3 0.4 0.5 0.6 0.7 0.8 0.9 1.0
0 50 100 150 200 250 Pressure (bar) IAST selectivity
NO2/SO2 NO2/CO2
0 1000 2000 3000 4000 5000 6000 7000
0.0 0.2 0.4 0.6 0.8 1.0 C/C 0
Dimensionless time N2
NO2 (dry) NO2 (wet)
0 5000 10000 15000 20000
NO2 CO2
Dimensionless time
0.0 0.2 0.4 0.6 0.8 1.0 1.2 1.4 1.6 1.8 C/C 0
0 2000 4000 6000 8000 10000 12000
11
a b
[image:11.612.60.491.63.487.2]c
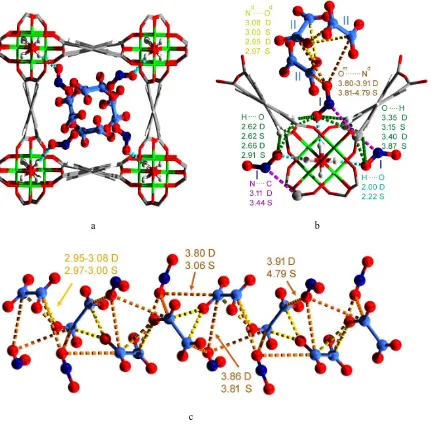
Figure 2. Views of the structural model for MFM-300(Al)·(NO2)2·(N2O4)2 determined by high resolution synchrotron
X-ray powder diffraction data at 298 K and DFT calculations (Al: green; carbon: grey; oxygen: red; hydrogen: white; nitrogen: blue). The structural model was first obtained by Rietveld refinement of the PXRD data and subsequently optimised by DFT calculations to simplify the positional disorder of adsorbed gas molecules owing to their thermal motion.
(a),(b)Host-guest binding details showing the binding sites I and II. (c) Structural view of the one-dimensional helical chain (NO2·N2O4)∞ within the channel of MFM-300(Al). The O···HO hydrogen-bonds, C···N dipole, H···O supramolecular
interactions, and inter-molecular dipole interactions (Om···Nd and Nd···Od, where m and d represents for monomer and dimer,
respectively) are highlighted in cyan, purple, green, orange and yellow, respectively.The nitrogen atoms of NO2 and N2O4 are
12
Figure 3. Fourier transform infrared spectroscopy (FTIR) and inelastic neutron scattering (INS) spectra for MFM-300(Al) as a function of NO2 loading. No abscissa scale factor was used throughout this report for IR and INS calculations. In situ FTIR spectra of gaseous and/or adsorbed NO2 and N2O4 molecules between 0.00 - 1.00 bar at 298 K in samples of (a) KBr, (b) KBr +
MFM-300(Al) (KBr background), (c) KBr + MFM-300(Al) [KBr + MFM-300(Al)-0.00 bar background] and (d) the difference spectra showing the growth of three new bands in the overtone region due to adsorbed NO2 and N2O4 molecules in the pore. (e)
DFT simulated difference IR spectra for adsorbed NO2 and N2O4 molecules in the pore of MFM-300(Al), showing the growth of
four new bands at the overtone region, in excellent agreement with the experimental data shown in (d). The overtone bands were calculated using a scale factor of 2.00. (f) Comparison of the variation of band areas of the three new bands (normalised to 1 at 1.00 bar) with pressure for the uptake of NO2 and N2O4 into MFM-300(Al). (g) Ratio of the IR bands of dimer and monomer
species of NO2 adsorbed in MFM-300(Al) (labelled as N2O4a and NO2a) and in the free gas phase (labelled as N2O4g and NO2g),
showing that in the gas phase the dimer increases relative to monomer as the pressure is increased, whereas in the pores it is constant. For comparison, the ratio of the refined site occupancies for adsorbed N2O4 and NO2 molecules from the PXRD study
is also included. It is worth noting that the conversion of the ratio of the IR band areas to the absolute site occupancies is subject to a factor of the extinction coefficient of the dimer/monomer. (h) Comparison of the experimental (top) and DFT simulated (bottom) of INS spectra for bare and the NO2-loaded MFM-300(Al). (i) Comparison of the difference plots for experimental and
DFT calculated INS spectra of bare and the NO2-loaded MFM-300(Al).
25 50 75 100 125 150 175 200 225 250 Experiment
Bare MFM-300 MFM-300 2(NO. 2) 2(N. 2O4)
Neutron Energy Loss / cm-1
.
250 500 750 1000 1250 1500 1750 2000
Calculation Bare MFM-300 MFM-300 2(NO. 2) 2(N. 2O4)
Neutron Energy Loss / meV
S(Q, ) / Abr. U nit s
25 50 75 100 125 150 175 200 225 250
S(Q, ) / Abr. U nit s
Neutron Energy Loss / meV Experiment-Diff Calculation-Diff
250 500 750 1000 1250 1500 1750 2000
Neutron Energy Loss / cm-1
0.0 0.2 0.4 0.6 0.8 1.0 0.0 0.2 0.4 0.6 0.8 1.0 Band Area (N orm alis ed)
Pressure / bar 3084 cm-1
2946 cm-1
2827 cm-1
Beta-Spline Average Line
0.0 0.1 0.2 0.3 0.4 0.5 0.6 0.7 0.8 0.9 1.0 0.0 0.1 0.2 0.3 0.4 0.5 0.6 0.7 0.8
0 2500 5000 7500 10000 12500 15000
0.60 0.65 0.70 0.75 0.80 0.85 0.90 0.95 1.00
IR N2O4a:NO 2
a
IR N
2O4 g:NO 2 g N2 O4 :N O2 I R Band R at io
Pressure / bar XRD N2O4a:NO
2 a N2 O4 :N O2 Sit e Oc cupanc y R at io
Time / s
(f) (g) (h) (i) I II III IV V VI
3200 3100 3000 2900 2800
N2O4g
Abs = 0.2
N2O4g
NO2g
NO2 g + a N2O4g + a N2O4
g + a 0.00 bar 0.10 bar 0.30 bar 0.60 bar 0.80 bar 1.00 bar
NO2a N2O4
a
N2O4a
(e) Abso rba nce (d) (c) (b) Abs
Abs = 0.03
(a)
NO2a N2O4a N
2O4 a
DFT Calculation-Diff
Wavenumber / cm-1
Abso rba nce (d) (c) (b)
Abs = 0.03
13
a b c
Figure 4. EPR and 1H ENDOR spectra of MFM-300(Al)·(NO
2)2·(N2O4)2. (a) Continuous wave (cw) X-band (9.72 GHz) EPR spectrum at 40 K (black) and simulation (red) with gx = 2.0052, gy = 1.9915, gz = 2.0021 and 14N nuclear hyperfine interactions
(nuclear spin, I = 1) of Ax = 144, Ay = 135, Ax = 185 MHz, where x, y and z define the NO2 molecular axes (inset). NO2 has C2v
point symmetry with the z-axis along the C2 rotation axis, y parallel to the O…O vector, and x normal to the NO2 plane. The
hyperfine interactions are much larger than the g-anisotropy such that the transitions are grouped according to the mI value as shown by the stick spectrum. This allows orientation selection in the ENDOR studies by choice of the static magnetic field. The cw EPR simulation also includes unresolved 1H hyperfine couplings (I = ½) determined from the ENDOR study; this gives a
better fit to the experimental line-shapes. (b) X-band Davies ENDOR spectrum (black) at 40 K and the static magnetic fields indicated, shown by the arrows in (a), dominantly selecting the NO2x, y and z-axes (top-to-bottom), respectively. ENDOR gives
pairs of transitions separated by the effective hyperfine coupling for the orientations selected, centred on the Larmor frequency of the nucleus being probed (14.9 MHz for 1H at 350 mT).The red and blue lines are calculated spectra, using a simple dipolar
model derived from the DFT-optimised NO2 and H coordinates, as shown in (c). The red spectrum includes the –OH group and
four aromatic –CH groups (all other 1H nuclei lie much further from the NO
2). The blue spectrum includes only the –OH group,
showing that the strongest coupling to this 1H is found approximately along the NO
2y-axis (the NO2…OH vector lies at 159o to
the NO2y-axis). Full details of the model are given in SI.
335 340 345 350 355 360
N O
O z
y
x
-1 0
x z z y y
Magnetic field / mT y
z x mI = +1
8 10 12 14 16 18 20 22 Frequency (MHz)
351.7 mT
14
Supplementary Information
Index of Supplementary Information
1. Experimental Section
1.1 Synthesis and Activation of MFM-300(Al) 1.2 NO2 Safety
1.3 Gas Adsorption Isotherms and Breakthrough Experiment 1.4 In situ FTIR Spectroscopy
1.5 Inelastic Neutron Scattering (INS) 1.6 DFT Modelling and Simulations
1.7 High Resolution Synchrotron X-ray Powder Diffraction and Structure Determinations 1.8 EPR Measurements
2. In Situ Synchrotron X-Ray Powder Diffraction Patterns 3. Additional Views of Crystal Structures
4. Additional Gas Sorption Isotherm Plots for MFM-300(Al)
5. Analysis of breakthrough data of diluted NO2 gas streams in porous materials reported in the literature
6. Analysis and Derivation of the Isosteric Heat of Adsorption for Adsorption of NO2
7. Additional FTIR Spectra and analysis 8. Additional EPR Spectra and analysis
8.1 Variable Temperature EPR Spectra 8.2 Dipolar Model for ENDOR Calculations
9. Analytical fitting of the adsorption isotherms by dual-site Langmuir-Freundlich model 10. IAST Analysis of the selectivity data of hydrocarbon adsorption in MFM-300(Al) 11. Breakthrough Experiments
15 1. Experimental Section
1.1 Synthesis and Activation of MFM-300(Al)
All reagents were used as received from commercial suppliers without further purification. Synthesis of [Al2(OH)2(C16O8H6)](H2O)6 [MFM-300(Al)-solvate] and activation of [Al2(OH)2(C16O8H6)] [MFM-300(Al)] were
carried out using our previously reported method.1
1.2 NO2 Safety
All systems involved in the supply, delivery and measurement of NO2 were rigorously leak tested and used only
within range of a NO2 detection system with a sensitivity of 1 ppm. All gases exhausted from experimental apparatus
was diluted with a flow of N2 and fed into fume hood extracts.
1.3 Gas Adsorption Isotherms and Breakthrough Experiment
Measurements of NO2 adsorption isotherm (0–1 bar) were performed using a Xemis gravimetric adsorption apparatus
(Hiden Isochema, Warrington, UK) equipped with a clean ultrahigh vacuum system. The pressure in the system is accurately regulated by mass flow controllers. Research grade NO2 and He were purchased from AIRLIQUIDE or
BOC and used as received. In a typical gas adsorption experiment, 70-100 mg of MFM-300(Al)-solvate was loaded into the Xemis, and degassed at 120 oC and high dynamic vacuum (10-10 bar) for 1 day to give desolvated
MFM-300(Al).
Breakthrough experiments were carried out in a 7 mm diameter fixed-bed tube of 120 mm length packed with ~3 g of MFM-300(Al) powder (particle size < 5 microns). The total volume of the bed was ca. 5 cm3. The sample
was heated at 150 oC under a flow of He for 2 days for complete activation. The fixed bed was then cooled to room
temperature (298 K) using a temperature programmed water bath and the breakthrough experiment was performed with a stream of 0.5% NO2 (diluted in He and N2 under both dry and wet conditions) at atmospheric pressure and
room temperature. The flow rate of the entering gas mixture was maintained at 40 mL min-1, and the gas concentration,
C, of NO2 and N2 at the outlet determined by mass spectrometry and compared with the corresponding inlet
concentration C0, where C/C0 = 1 indicates complete breakthrough. Breakthrough separation of NO2/CO2 was
conducted using a mixture containing 0.4% NO2 (4000 ppm) and 15% CO2 (v/v) diluted in He in a fixed-bed packed
with MFM-300(Al) at 298 K and 1 bar at a flow rate of 47 mL min-1. Breakthrough separation of NO
2/SO2 was
conducted using a mixture containing 0.16% NO2 (1666 ppm) and 0.34% SO2 (3334 ppm) diluted in He in a
fixed-bed packed with MFM-300(Al) at 298 K and 1 bar at a flow rate of 19 mL min-1. The final results have been converted
16 1.4 In situ FTIR Spectroscopy
In situ studies of MFM-300(Al) were carried out in a high-pressure low temperature cell, which has been described in detail elsewhere.2 A KBr disc with and without MFM-300(Al) (ca. 5 wt%) was used as the matrix for in situ IR
experiments to record the spectra for the material and background (i.e., gaseous phase NO2), respectively.
MFM-300(Al) was pressed into the surface of a preformed KBr disc. The discs were further degassed by heating to 120 °C under high vacuum overnight and mounted into the cell, which was purged with Ar. The disc was placed under vacuum, cooled to 298 K and filled to various pressures between 0 and 1 bar of NO2 (CP grade, supplied by
AIRLIQUIDE) to mimic gas sorption experiments. For each pressure step, the equilibration time was set to 120 min before the measurement of IR spectra. All IR spectra were recorded on a Nicolet Avatar 360 FTIR spectrometer with a liquid N2 cooled HgCdTe detector. Throughout this report, intensities of the overtone bands were used for analysis
because these bands had a lower absorption than the fundamental bands for the monomer and dimer, both of which had an absorbance greater than 1 at pressures over 0.3 bar in our apparatus. A low spectral resolution (2 cm-1) was
used to allow for efficient subtraction of the bands due to the free gas.
1.5 Inelastic Neutron Scattering (INS)
INS spectra were recorded on the VISION spectrometer at Spallation Neutron Source, Oak Ridge National Laboratory (USA). VISION is an indirect geometry crystal analyser instrument that provides a wide dynamic range with high resolution. The sample of desolvated MFM-300(Al) was loaded into a cylindrical vanadium sample container with an indium vacuum seal and connected to a gas handling system. The sample was degassed at 10-7 mbar at 120 °C for
1 day to remove any remaining trace guest water molecules. The temperature during data collection was controlled using a closed cycle refrigerator (CCR) cryostat (10 ± 0.1 K). The loading of NO2 was performed volumetrically at
room temperature in order to ensure that NO2 was present in the gas phase when not adsorbed and also to ensure
sufficient mobility of NO2 inside the crystalline structure of MFM-300(Al). Subsequently, the temperature was
reduced to below 10 K in order to perform the scattering measurements with the minimum achievable thermal motion for the framework host and adsorbed NO2 and N2O4 molecules. Background spectra [sample can plus bare
MFM-300(Al)] were subtracted to obtain the difference spectra.
INS was used to study the binding interaction and structure dynamics in this case because it has several unique advantages:
INS spectroscopy is ultra-sensitive to the vibrations of hydrogen atoms, and hydrogen is ten times more
visible than other elements due to its high neutron cross-section.
The technique is not subject to any optical selection rules. All vibrations are active and, in principle,
17
INS observations are not restricted to the centre of the Brillouin zone (gamma point) as is the case for optical
techniques.
INS spectra can be readily and accurately modelled: the intensities are proportional to the concentration of
elements in the sample and their cross-sections, and the measured INS intensities relate straightforwardly to the associated displacements of the scattering atom. Treatment of background correction is also straightforward.
Neutrons penetrate deeply into materials and pass readily through the walls of metal containers making
neutrons ideal to measure bulk properties of this material.
INS spectrometers cover the whole range of the molecular vibrational spectrum, 0-500 meV (0-4000 cm-1)
INS data can be collected at below 10 K, where the thermal motion of the MOF material and adsorbed NO2,
and N2O4 molecules can be significantly reduced.
Calculation of the INS spectra by DFT vibrational analysis can be readily achieved, and DFT calculations
relate directly to the INS spectra, and, in the case of solid state calculations, there are no approximations other than the use of DFT eigenvectors and eigenvalues to determine the spectral intensities.
1.6 DFT Calculations and Molecular Dynamic Modelling
The vibrational properties of the bare and NO2-loaded MFM-300(Al) were calculated using a combination of density
functional theory (DFT) and plane-wave pseudopotential methods as implemented in the CASTEP code,3 using
ultra-soft pseudopotentials with a plane-wave energy cut-off of 380 eV. Calculations were performed under the PBE approximation3 for exchange and correlation. The electronic structure was calculated on a 2×2×2 Monkhorst-Pack
mesh for the unit cell (see crystal data in Section 1.7). The normal modes of the solid were determined from dynamical matrices calculated using finite displacements, by numerical differentiation, and the lattice parameters and atomic coordinates determined by PXRD in this work were used for the initial structure. The total energy tolerance for electronic energy minimization was 5×10⁻¹⁰ eV/atom, and 5×10⁻⁹ eV/atom for structure optimization. The maximum
interatomic force after relaxation was below 0.001 eV/Å. The INS spectra were the calculated using the aClimax software,4 and IR spectra calculated using CASTEP.3 The information was used to identify the modes of vibrational
features in the experimental INS and FTIR spectra, and no abscissa scale factor was used throughout this report for INS or IR calculations. The calculated INS spectrum shows the total transitions (up to 10 orders). The stepwise calculation for binding energies was carried out by (i) optimising the structure of the bare MOF by finding the local potential energy minimum with the final potential energy E1; (ii) optimising the structure of the NO2-loaded MOF (3
NO2/Al) with the final potential energy E2; (iii) removing the MOF host, leaving the NO2 and N2O4 (ratio of 1: 1)
molecules in the system, enlarging the unit cell to 2.5x2.5x2.5 nm3 and redistributing the NO
2 and N2O4 molecules
18 The NO2 binding energy (ΔE) was obtained by the calculation of ΔE = E1-E2+E3. MD modelling at 600K was carried
out by CASTEP3, with a timestep of 1fs and a total of 10000 steps under NVT ensemble (controlled by
Hoover-Langevin thermostat). For the MD simulation, the electronic structure was calculated on gamma-point only, and the tolerance for electronic energy minimization was 5×10⁻⁶ eV/atom. The purpose of the MD modelling is to study the
stability of the (NO2·N2O4)∞ chain due to the confinement within the pores, by comparing the molecular dynamics
with and without the MOF. Indeed, within the simulation timescale of 10ps, the (NO2·N2O4)∞ chain shows exceptional
stability at room temperature in MD modelling and even at elevated temperature of 600 K. The MD calculation was terminated at 600 K where the MOF host starts to show thermal decomposition in reality. It is worth noting that this result is subject to various limitations of the MD modelling, particularly for the limited timescale in MD when comparing with the laboratory timescale of seconds or longer. In this case, it demonstrates the role of the MOF in stabilising the (NO2·N2O4)∞ chain from a theoretical perspective.
1.7 High Resolution Synchrotron X-ray Powder Diffraction and Structure Determinations
High resolution in situ synchrotron X-ray powder diffraction (PXRD) data were collected at Beamline ID22 of European Synchrotron Radiation Facility (ESRF) using monochromated radiation [λ = 0.399999(2) Å]. These in situ
diffraction measurements were carried out in capillary mode and the temperature controlled by an Oxford Cryosystems open-flow N2 gas cryostat. In a typical experiment, the powder sample of MFM-300(Al)(~2 mg)was
dried in air and ground for 10 mins before loading into a capillary tube (0.7 mm diameter). Grinding provides a uniform and small (below 10 micron) particle size essential for obtaining high-quality X-ray patterns. The capillary tube was connected to high vacuum (10-6 mbar) and heated at 150 oC for ~4 h to generate desolvated MFM-300(Al).
Upon loading of NO2 into MFM-300(Al) at 1 bar and 298 K, a series of rapid scans (~10 mins each) were collected
to capture the changes in the unit cell parameters as a function of time. Longer scans (~20 mins each) were collected when reaching the adsorption equilibrium at 298 K. A PXRD pattern was also collected after a final degassing under heating for ~1h to remove adsorbed NO2 molecules. A second cycle of NO2 adsorption/desorption was also carried
out to test the structural stability and durability of this MOF material. Upon desolvation and NO2 loading, we observe
neither changes to cell parameters nor additional/missing features in the patterns, suggesting that there is no structural phase change during the experiment.
The structure solutions were initially established by considering the structure of bare MFM-300(Al) framework, and the residual electron density maps were further developed from subsequent difference Fourier analysis using TOPAS.5 Lattice parameters were obtained from Le Bail refinements of the PXRD data. The final
structure refinement of MFM-300(Al)·(NO2)2·(N2O4)2was carried out using the Rietveld method with isotropic
19 peak indicating that the NO2 molecules are adsorbed into the material. NO2 and N2O4 molecules at each site were
determined to be nearly fully occupied, in excellent agreement with the experimental isotherm value. The final stage of the Rietveld refinement involved soft restraints to the C-C bond lengths within the benzene rings. Rigid body refinement was applied to the NO2 and N2O4 molecules in the pore.
Crystal data for MFM-300(Al)·(NO2)2·(N2O4)2: [Al2(OH)2(C16H6O8)]·(NO2)2·(N2O4)2. Yellow powder. Tetragonal,
space group I4122, a = b = 14.84158(5), c = 11.81181(5) Å, V = 2601.82(2) Å3, M = 690.23, T = 298(2) K, Z = 4. The
final Rietveld plot corresponds to satisfactory crystal structure model (RBragg = 0.018) and profile (Rp = 0.043 and Rwp
= 0.058) indicators with a goodness-of-fit parameter of 1.750. CCDC deposition number: 1539036. Final fractional coordinates and bond distances for MFM-300(Al)·(NO2)2·(N2O4)2are listed in Table S1 and S2, respectively.
Table S1. List of atomic positions for MFM-300(Al)·(NO2)2·(N2O4)2.
Site-num x y z Biso (Å2)
Al1 8 1.30586(10) -0.30586(10) 0.5 3.894(67)
O1 8 0.75170(26) 0.25 0.625 3.762(63)
O2 16 0.87600(18) 0.12440(20) 1.10416(21) 3.762(63)
O3 16 0.89443(17) 0.21604(17) 0.25359(28) 3.762(63)
C1 16 0.86199(29) 0.09141(30) 0.79768(38) 4.095(82)
C2 16 0.54435(20) 0.43176(12) 0.76209(19) 4.095(82)
C3 8 0.5 0.5 0.70087(26) 4.095(82)
C4 16 0.53865(21) 0.42815(11) 0.87983(14) 4.095(82)
C5 8 0.5 0.5 0.93826(21) 4.095(82)
H1 8 0.80864 0.25 0.625 5.643(95)
H2 8 0.5 0.5 0.61237 4.914(99)
H3 16 0.56718 0.37862 0.90735 4.914(99)
N2 16 0.01401903 0.2414441 -0.484625 30.9(18)
O3s 16 -0.05095469 0.2485398 -0.4407144 12.50(43)
O4s 16 0.06229106 0.2334176 -0.4146818 18.49(72)
N3 16 0.1872874 0.3562286 -0.6306682 37.75(60)
O3a 16 0.2488465 0.3868339 -0.5745081 37.75(60)
O3b 16 0.1792254 0.3776048 -0.7296211 37.75(60)
N4 16 0.1236334 0.2941813 -0.5797326 37.75(60)
O4a 16 0.06221788 0.2633852 -0.6359762 37.75(60)
[image:19.612.76.541.364.657.2]O4b 16 0.131767 0.2727097 -0.4808217 37.75(60)
Table S2. List of bond lengths for MFM-300(Al)·(NO2)2·(N2O4)2.
Bond Distance (Å) Bond Distance (Å)
Al1-O1 1.8967(22) C2-C3 1.4078(27)
Al1-O2 1.9153(32) C2-C4 1.3943(29)
Al1-O3 1.8727(25) C4-C5 1.3937(24)
C1-O2 1.2725(50) C5-C5 1.4586(49)
C1-O3 1.3236(52) C1-C2 1.4347(50)
20 Continuous wave (cw) and pulsed electron paramagnetic resonance (EPR) measurements of powder samples of the bare and NO2-loaded MFM-300(Al) were performed at X-band (ca. 9.7 GHz) on a Bruker Elexsys E580 spectrometer.
The microwave frequency was measured with a built-in digital counter and the magnetic field was calibrated using a Bruker strong pitch reference sample. A modulation amplitude of 0.1 mT and microwave powers of 0.002-2 mW were used. Electron-nuclear double resonance (ENDOR) measurements used the Davies sequence6 (π
inv − RF − π/2 −
21
2. In Situ Synchrotron X-Ray Powder Diffraction Patterns
The adsorption, diffusion and binding domains for NO2 within MFM-300(Al) were studied by in situ high resolution
synchrotron X-ray powder diffraction (PXRD) experiments. Desolvated MFM-300(Al) shows negligible residual electron density in the void. Upon loading NO2 at 1 bar at 298 K, high resolution PXRD data (approximately
600-1200s for each scan) were collected over a period of 5h to monitor diffusion of molecules into MFM-300(Al). Initially, a steady exponential increase in the a-axis and cell volume of MFM-300(Al) was observed, indicating diffusion of NO2 molecules within MFM-300(Al) (Figs. S6-S7). After 2h, further changes in the cell parameters were negligible,
indicating the formation of an equilibrated host-guest structure. The PXRD data between 2-5 h were merged to improve the signal-to-noise ratio for determination of locations of adsorbed NO2 molecules via Rietveld refinement.
Comparison of the PXRD patterns for the bare and NO2-loaded MOF shows retention of the crystal structure and
significant variations in the peak intensities as a result of NO2 binding (Fig. S3). Analysis of the Fourier density map
revealed two independent binding sites (I and II) within the pore of MFM-300(Al). According to the shape and height of the peaks, sites I and II were assigned as NO2 and N2O4 molecules, respectively, and a highly satisfactory Rietveld
refinement was obtained (Fig. S4). To confirm further the model, DFT calculations were used to optimize the structures for bare MFM-300(Al) and MFM-300(Al)·(NO2)2·(N2O4)2. Initially, the structural models obtained from
synchrotron PXRD experiments were adapted into the calculations. Upon convergence, excellent agreement between calculated and experimental models for the structure was obtained. The bond distances obtained by independent analysis of PXRD and DFT calculations are compared in Fig. 2 with excellent agreement between the two. The binding energy of NO2 in MFM-300(Al) has also been obtained by DFT calculations at a loading of 14.5 mmol g-1
22 a b
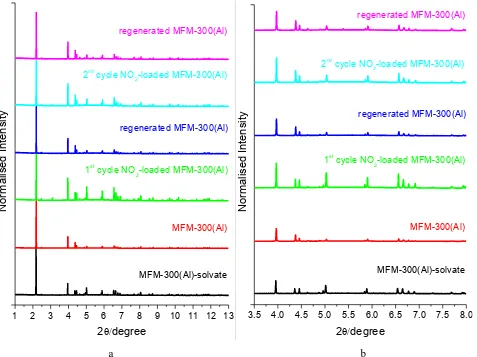
Figure S1. (a) Powder X-ray diffraction patterns for solvated, desolvated, NO2-loaded, and regenerated MFM-300(Al)
samples for two cycles of NO2 adsorption/desorption at 298 K [λ = 0.399999(2) Å]; (b) higher angle data (2θ =
3.5-8o) has been scaled up confirming that MFM-300(Al) retains high crystallinity on cyclic uptake/removal of NO 2.
1 2 3 4 5 6 7 8 9 10 11 12 13 regenerated MFM-300(Al)
2nd
cycle NO2-loaded MFM-300(Al)
regenerated MFM-300(Al)
1st
cycle NO2-loaded MFM-300(Al)
MFM-300(Al)
MFM-300(Al)-solvate
N
orm
al
ised I
ntensi
ty
2degree
3.5 4.0 4.5 5.0 5.5 6.0 6.5 7.0 7.5 8.0 regenerated MFM-300(Al)
2nd
cycle NO2-loaded MFM-300(Al)
regenerated MFM-300(Al)
1st
cycle NO2-loaded MFM-300(Al)
MFM-300(Al)
MFM-300(Al)-solvate
N
orm
al
ised I
ntensi
ty
[image:22.612.56.533.61.418.2]23
a b [to be added]
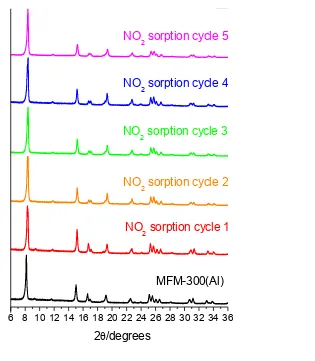
Figure S2. (a) Powder X-ray diffraction patterns for MFM-300(Al) samples upon adsorption/desorption cycle of NO2
for five cycles at 298 K [λ = 1.54056(2) Å]; (b) comparison of the NO2 uptake capacities over five cycles at 298 K.
6 8 10 12 14 16 18 20 22 24 26 28 30 32 34 36
2/degrees
NO2 sorption cycle 6
NO2 sorption cycle 5
NO2 sorption cycle 4
NO2 sorption cycle 3
NO2 sorption cycle 2
NO2 sorption cycle 1
N
orm
alis
ed
Int
ens
ity
[image:23.612.64.379.53.414.2]24 a
b
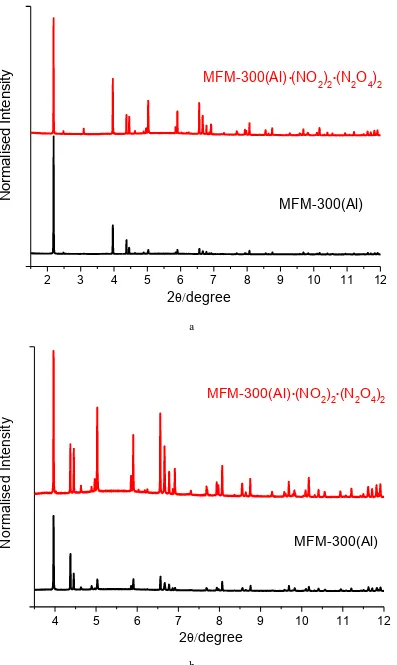
Figure S3. (a) Comparison of powder X-ray diffraction patterns for desolvated and NO2-loaded MFM-300(Al)
samples at 298 K [λ = 0.399999(2) Å]; (b) higher angle data (2θ = 3.5-12o) has been scaled up confirming that
MFM-300(Al) retains high crystallinity on uptake of NO2, which also induces significant changes on the intensities of a
number of Bragg peaks.
2
3
4
5
6
7
8
9
10
11
12
.
MFM-300(Al) (NO
2)
2(N
2O
4)
2MFM-300(Al)
2
degree
N
orm
alis
ed
Int
ens
ity
.
4
5
6
7
8
9
10
11
12
2
degree
N
orm
alis
ed
Int
ens
ity
MFM-300(Al)
.
[image:24.612.57.454.57.722.2]25 a
[image:25.612.55.445.51.750.2]b
Figure S4. Log scale views for (a) comparison of powder X-ray diffraction patterns for desolvated and NO2-loaded
MFM-300(Al) samples at 298 K [λ = 0.399999(2) Å]; (b) higher angle data (2θ = 3.5-12o) has been scaled up
confirming that MFM-300(Al) retains high crystallinity on uptake of NO2, which also induces significant changes on
the intensities of a number of Bragg peaks.
2
3
4
5
6
7
8
9
10
11
12
.
MFM-300(Al) (NO
2)
2(N
2O
4)
2MFM-300(Al)
2
degree
Log (
N
orm
alis
ed
Int
ens
it
y
)
.
4
5
6
7
8
9
10
11
12
2
degree
Log (
N
orm
alis
ed
Int
ens
it
y
)
MFM-300(Al)
.
26 a
b
c
Figure S5. (a) PXRD patterns [observed (blue), calculated (red) and difference (grey)] for the Rietveld refinement of the NO2-loaded MFM-300(Al)·(NO2)2·(N2O4)2 [λ = 0.399999(2) Å]; (b) higher angle data (2θ = 4-20o) scaled up to
show the quality of fit between the observed and the calculated patterns; (c) detailed view of the fitting of PXRD patterns in log scale.
2 4 6 8 10 12 14 16 18 20 22
Observed
Calculated
Difference
Int
ens
it
y
2degree
4 6 8 10 12 14 16 18 20
Observed
Calculated
Difference
Int
ens
it
y
2degree
4 6 8 10 12 14 16 18 20
Observed
Calculated
Difference
Log (
Int
ens
it
y
)
[image:26.612.55.427.80.754.2]27 Figure S6. Variation of the lattice parameters (a and c axis) of MFM-300(Al) upon NO2 loading at 1 bar and 298 K
(where the error bar is invisible, the error bar is smaller than the data symbol).
Figure S7. Variation of the lattice parameters (cell volume) and site occupancies of NO2 and N2O4 within
MFM-300(Al) as a function of time (where the error bar is invisible, the error bar is smaller than the data symbol).
2000 4000 6000 8000 10000 12000 14000 16000 18000 14.826 14.828 14.830 14.832 14.834 14.836 14.838 14.840 14.842 14.844 a axis c axis Time (s) a ax is (0. 1nm ) 11.8115 11.8120 11.8125 11.8130 11.8135 11.8140 11.8145 11.8150 11.8155 c ax is (0. 1nm )
2000 4000 6000 8000 10000 12000 14000 16000 0.4 0.5 0.6 0.7 0.8 0.9 1.0 1.1
NO2 occupancy
N2O4 occupancy
28 Table S3. Variations of the cell parameters and site occupancies for MFM-300(Al)·(NO2)2·(N2O4)2 as a function of
time upon NO2 loading at 298 K and 1 bar.
Time (s) a (Å) c (Å) cell volume (Å3)
NO2
occupancy
N2O4
occupancy
N2O4/NO2
29 3. Additional Views of Crystal Structures
a b
Figure S8. View of the structure for desolvated MFM-300(Al) (a) along the c-axis and (b) along the a-axis. The μ2
30
a b
Figure S9. View of the structure of MFM-300(Al)·(NO2)2·(N2O4)2 (a) along the c-axis and (b) along the a-axis (Al:
green; carbon: grey; oxygen: red; hydrogen: white; nitrogen: blue). The structure was obtained by DFT calculation. NO2 and N2O4 molecules in the channel and the host functional groups involved in cooperative binding are highlighted
31 a b
c
Figure S10. Detailed views of -OH, -CH, and carboxylate groups binding NO2 and N2O4 molecules in the
functionalised cavity of MFM-300(Al)·(NO2)2·(N2O4)2. Views along (a) the a-axis, (b) the b-axis and (c) the c-axis
(Al: green; carbon: grey; oxygen: red; hydrogen: white; nitrogen: blue). The structure was obtained by DFT calculation. NO2 and N2O4 molecules in the channel and the host functional groups involved in cooperative binding
are highlighted by the use of ball-and-stick mode. The O···HO hydrogen-bonds, C···N dipole, H···O supramolecular interactions, and inter-molecular dipole interactions (Om···Nd and Nd···Od, where m and d represents for monomer
and dimer, respectively) are highlighted in cyan, purple, green, orange and yellow, respectively.The N atoms of NO2
32
a b
c
Figure S11. Detailed views of -OH, -CH, and carboxylate groups binding monomer NO2 molecules in the
functionalised cavity of MFM-300(Al)·(NO2)2·(N2O4)2. Views along (a) the a-axis, (b) the b-axis and (c) the c-axis
(Al: green; carbon: grey; oxygen: red; hydrogen: white; nitrogen: blue). The structure was obtained by DFT calculation. NO2 molecules in the channel and the host functional groups involved in cooperative binding are
33
a
b
Figure S12. Detailed views of the intermolecular helical chain of NO2 and N2O4 molecules within the functionalised
cavity of MFM-300(Al)·(NO2)2·(N2O4)2. Views along (a) the c-axis and (b) the a-axis (oxygen: red; nitrogen: blue).
The structure was obtained by DFT calculation. The inter-molecular dipole interactions (Om···Nd and Nd···Od, where
34
[image:34.612.59.484.64.336.2]a b
Figure S13. View of the structure of MFM-300(Al)·(NO2)2·(N2O4)2 (a) along the c-axis and (b) along the a-axis (Al:
green; carbon: grey; oxygen: red; hydrogen: white; nitrogen: blue). The structure was obtained by synchrotron PXRD refinement. NO2 and N2O4 molecules in the channel and the host functional groups involved in cooperative binding
are highlighted by the use of ball-and-stick mode. The N atoms of NO2 and N2O4 are highlighted in deep and light
35 a b
c
Figure S14. Detailed views of -OH, -CH, and carboxylate groups binding NO2 and N2O4 molecules in the
functionalised cavity of MFM-300(Al)·(NO2)2·(N2O4)2. Views along (a) the a-axis, (b) the b-axis and (c) the c-axis
(Al: green; carbon: grey; oxygen: red; hydrogen: white; nitrogen: blue). The structure was obtained by synchrotron PXRD refinement. NO2 and N2O4 molecules in the channel and the host functional groups involved in cooperative
binding are highlighted by the use of ball-and-stick mode. The O···HO hydrogen-bonds, C···N dipole, H···O supramolecular interactions, and inter-molecular dipole interactions (Om···Nd and Nd···Od, where m and d represents
[image:35.612.51.543.60.610.2]36
a b
c
Figure S15. Detailed views of -OH, -CH, and carboxylate groups binding monomer NO2 molecules in the
functionalised cavity of MFM-300(Al)·(NO2)2·(N2O4)2. Views along (a) the a-axis, (b) the b-axis and (c) the c-axis
(Al: green; carbon: grey; oxygen: red; hydrogen: white; nitrogen: blue). The structure was obtained by synchrotron PXRD refinement. NO2 molecules in the channel and the host functional groups involved in cooperative binding are
[image:36.612.56.537.62.526.2]37
a
[image:37.612.53.439.62.572.2]b
Figure S16. Detailed views of the intermolecular helical chain of NO2 and N2O4 molecules within the functionalised
cavity of MFM-300(Al)·(NO2)2·(N2O4)2. Views along (a) the c-axis and (b) the a-axis (oxygen: red; nitrogen: blue).
The structure was obtained by synchrotron PXRD refinement. The inter-molecular dipole interactions (Om···Nd and
Nd···Od, where m and d represents for monomer and dimer, respectively) are highlighted in orange and yellow,
38 a b
Figure S17. Detailed views of the crystal structure of N2O4 determined by neutron diffraction at 20 K. Views along
(a) the c-axis and (b) the b-axis (oxygen: red; nitrogen: blue). Each N2O4 molecule is surrounded by eight
neighbouring N2O4 molecules via intermolecular dipole interactions (O···N = 3.13Å and N···O = 3.13 Å, which are
highlighted in yellow and orange, respectively).The density of solid N2O4, calculated based upon the crystal structure
39 4. Additional Gas Sorption Isotherm Plots for MFM-300(Al)
Figure S18. Adsorption isotherms for NO2, SO2, CO2, N2,CH4, Ar, CO, O2 and H2 in MFM-300(Al) at 298 K up to
1.0 bar. The lack of CO adsorption in MFM-300(Al) at 298 K and 1.0 bar when comparing to CO2 is likely due to its
larger kinetic diameter (3.76 Å and 3.30 Å for CO and CO2, respectively) and weaker interaction (quadruple moment
of -8.58 x 10-40 C m2 and -13.4 x10-40 C m2 for CO and CO
2, respectively) to the MOF host.
0.0 0.1 0.2 0.3 0.4 0.5 0.6 0.7 0.8 0.9 1.0 0.0
1.5 3.0 4.5 6.0 7.5 9.0 10.5 12.0 13.5 15.0
NO2 ads SO2 ads CO2 ads NO2 des SO2 des CO2 des CH4 CO N2 Ar H2 O2
Gas
upt
ak
e
(gas
/Al)
Gas
upt
ak
e
(m
m
ol/
g)
Pressure (bar)


![Figure S5. (a) PXRD patterns [observed (blue), calculated (red) and difference (grey)] for the Rietveld refinement of](https://thumb-us.123doks.com/thumbv2/123dok_us/8556970.364478/26.612.55.427.80.754/figure-pxrd-patterns-observed-calculated-difference-rietveld-refinement.webp)

