Author’s Accepted Manuscript
Development of a SERS strategy to overcome the
nanoparticle stabilisation effect in serum-containing
samples: Application to the quantification of
dopamine in the culture medium of PC-12 cells
E. Dumont, C. De Bleye, J. Cailletaud, P.-Y.
Sacré, P.-B. Van Lerberghe, B. Rogister, G.A.
Rance, J.W. Aylott, Ph. Hubert, E. Ziemons
PII:
S0039-9140(18)30379-5
DOI:
https://doi.org/10.1016/j.talanta.2018.04.038
Reference:
TAL18577
To appear in:
Talanta
Received date: 14 February 2018
Revised date:
2 April 2018
Accepted date: 8 April 2018
Cite this article as: E. Dumont, C. De Bleye, J. Cailletaud, P.-Y. Sacré, P.-B.
Van Lerberghe, B. Rogister, G.A. Rance, J.W. Aylott, Ph. Hubert and E.
Ziemons, Development of a SERS strategy to overcome the nanoparticle
stabilisation effect in serum-containing samples: Application to the quantification
of
dopamine
in
the
culture
medium
of
PC-12
cells,
Talanta,
https://doi.org/10.1016/j.talanta.2018.04.038
This is a PDF file of an unedited manuscript that has been accepted for
publication. As a service to our customers we are providing this early version of
the manuscript. The manuscript will undergo copyediting, typesetting, and
review of the resulting galley proof before it is published in its final citable form.
Please note that during the production process errors may be discovered which
could affect the content, and all legal disclaimers that apply to the journal pertain.
Development of a SERS strategy to overcome the nanoparticle stabilisation effect in
serum-containing samples: Application to the quantification of dopamine in the culture
medium of PC-12 cells
E. Dumonta*, C. De Bleyea, J. Cailletauda, P.-Y. Sacréa, P.-B. Van Lerbergheb, B. Rogisterc,d, G. A. Rancee, J. W. Aylottf, Ph. Huberta, E. Ziemonsa
a
University of Liege (ULiege), CIRM, VibraSanté Hub, Department of Pharmacy, Laboratory of Pharmaceutical Analytical Chemistry, CHU, B36, B-4000 Liege, Belgium.
b
University of Liege (ULiege), GIGA-Neurosciences, Laboratory of Developmental Neurobiology, CHU, B36, B-4000 Liege, Belgium.
c
University of Liege (ULiege), GIGA-Neurosciences, Laboratory of Nervous System Disorders and Therapy, CHU, B36, B-4000 Liege, Belgium.
d
Department of Neurology, CHU of Liège, B-4000 Liege, Belgium.
e
University of Nottingham, Nanoscale and Microscale Research Centre, University Park, NG7 2RD, Nottingham, United-Kingdom.
f
University of Nottingham, School of Pharmacy, Laboratory of Biophysics and Surface Analysis, University Park, NG7 2RD, Nottingham, United-Kingdom.
*
Abstract
The analysis of serum samples by surface-enhanced Raman spectroscopy (SERS) has gained ground over the last years. However, the stabilisation of colloids by the proteins contained in these samples has restricted their use in common practice, unless antibodies or aptamers are used. Therefore, this work was dedicated to the development of a SERS methodology allowing the analysis of serum samples in a simple and easy-to-implement way. This approach was based on the pre-aggregation of the colloid with a salt solution. Gold nanoparticles (AuNPs) were used as the SERS substrate and, owing to its physiopathological importance, dopamine was chosen as a model to implement the SERS approach. The presence of this neurotransmitter could be determined in the concentration range 0.5 to 50 ppm (2.64 – 264 µM) in the culture medium of PC-12 cells, with a R2 of 0.9874, and even at lower concentrations (0.25 ppm, 1.32 µM) in another matrix containing fewer proteins. Moreover, the effect of calcium and potassium on the dopamine exocytosis from PC-12 cells was studied. Calcium was shown to have a predominant and dose-dependent effect. Finally, PC-12 cells were exposed to dexamethasone in order to increase their biosynthesis and release of dopamine. This increase was monitored with the developed SERS approach.
Keywords: Surface-Enhanced Raman Scattering (SERS); Gold nanoparticles; Dopamine; Quantitative methods; Cellular analysis; PC-12 cells.
1.
Introduction
Dopamine (DA) is a neurotransmitter belonging to the catecholamines class and plays a role of utmost importance in human physiology. As a matter of fact, the level of brain DA is tightly regulated, playing a crucial part in, amongst others, motor behaviour, motivation and cognitive behaviour [1,2]. DA is also involved in the peripheral nervous system, where, for instance, it triggers the vasodilatation of blood vessels and is, in the kidney, natriuretic, resulting in a decrease of the blood pressure [3]. Furthermore, DA is also involved in vision, olfaction, immunology and many other functions [1]. When the released DA level is dysregulated, diseases arise: for example, Parkinson’s disease can be caused by a decrease in the level of DA released in the striatum; schizophrenia and bipolar disorders where increased levels of DA released are observed [1,2]. Besides, raised urinary or blood DA levels are encountered in some tumours like phaeochromocytomas or paragangliomas [4]. However, the DA concentration in biological fluids remains low (1 nM to 1 µM [5]), calling for the development of sensitive analytical tools able to deal with complex sample matrices.
expensive organic solvents, whereas some spectroscopic analyses may lack specificity. As a result, the use of surface-enhanced Raman scattering (SERS) has been explored and developed over the last few years for the analysis of biomolecules in complex samples [13,14]. SERS is a surface-sensitive vibrational spectroscopy technique based on the inelastic scattering of light, akin to conventional Raman spectroscopy, but conferring an approximate 104- to 1010- fold increase in the signal of analytes that are adsorbed or in close vicinity to a rough metallic surface called the SERS substrate [13]. Two mechanisms account for this signal enhancement: the electromagnetic mechanism, relying upon the excitation of surface plasmons, and the chemical mechanism, involving the formation of charge-transfer complexes. The former contributes to the majority of the signal enhancement, while only a 100-fold enhancement is attributable to the latter [13]. Accordingly, SERS is more suited to the analysis of biological samples containing molecules in low concentration. The resulting SERS spectra are molecule- and orientation-specific, enable multiplex detection and quantification, making SERS the first-class choice for the analysis of complex mixtures [13]. Nowadays, as the SERS substrate is critical in modulating the extent of signal enhancement, care is taken to synthesise it in a repeatable way, whether the substrate is a suspension of nanoparticles or a well-organised solid substrate. Regarding the composition of the metallic surface, gold and silver are the most often used, since they present the greatest enhancement factors, with silver understood to be larger than gold. However, gold has the advantage of being biocompatible and of displaying a more stable surface chemistry [13].
such as culture medium or brain tissue, the sample complexity led to the use of a sophisticated sample preparation [20], of complex SERS substrates [5,21,22] or to the use of antibodies and aptamers [23,24]. Indeed, proteins making these samples up hamper the SERS detection, since they form a protein corona around the SERS substrate, preventing its aggregation and therefore the signal enhancement.
Here, we developed a simple and innovative sample preparation overcoming the protein corona stabilisation: we resorted to a colloid pre-aggregation step, before adding the serum-containing medium. To the best of our knowledge, this is the first time that a salt-induced colloid pre-aggregation strategy is used to increase the SERS signal from serum samples. The synthesis of the SERS substrate, citrate-coated gold nanoparticles, was additionally shown to be repeatable in the same laboratory and reproducible between two different laboratories. After having selected the best pre-aggregation agent, we carefully optimised the SERS sample preparation through a Design of Experiments (DoE) approach. The optimal parameters were selected to build calibration curves of dopamine in culture media. The developed technique was further applied to the detection of DA released by rat phaeochromocytoma PC-12 cells. It was observed that calcium ions had a prevailing effect on the DA exocytosis and this effect was dose dependant, corroborating what had already been shown in the literature [4,25-28]. Moreover, we could observe an increase in the dopamine released by PC-12 cells exposed to dexamethasone, as it has been previously demonstrated with other analytical tools [29].
Chemicals and reagents
2.1
Gold nanoparticles synthesis
2.2
Citrate-coated gold nanoparticles (AuNPs) were synthesized according to the protocol described by Lee and Meisel [30]. In brief, 100 mL of a 0.048 % chloroauric acid solution was brought to the boiling point. Under stirring, 10 mL of a 1 % trisodium citrate solution was added. The ebullition and stirring were maintained for one hour. The resulting colloidal suspension was then cooled down to room temperature. For long-term conservation, the suspension was stored in the fridge. All glassware being in contact with the nanoparticles was cleaned with aqua regia (HCl/HNO3 3:1 (v/v)) and then thoroughly rinsed with ultrapure
water prior to use.
Protein removal
2.3
The operational mode for the anti-fouling experiments is described in the supporting information.
The ultrafiltration procedure was carried out on Vivaspin 500 centrifugal concentrators with a 3 kDa molecular weight cutoff. These concentrators were acquired from Sartorius (Stonehouse, United Kingdom). The ultrafiltration took 75 min at a centrifugation speed and temperature of 11000 rpm (12851 g) and 15°C, respectively. The temperature was lowered in order to slow down dopamine oxidation. To 200 µL of AuNPs, 200 µL of ultrafiltred sample were added. The addition of 50 µL of concentrated phosphate buffer (PBSx10; 1.44 g/L potassium dihydrogen phosphate, 7.95 g/L di-sodium hydrogen phosphate and 90 g/L sodium chloride) to the previous sample was also investigated as aggregating agent.
were centrifuged at 12000 rpm and 15°C for 10 minutes. The supernatants were collected and analysed. The same sample preparations as for ultrafiltration were realised, i.e. to 200 µL of supernatant were added to 200 µL of AuNPs and the addition of 50 µL of PBSx10 as aggregating agent was also studied.
Design of experiments
2.4
The central composite Design of Experiments (DoE) was created and analysed with the JMP Pro 12 software (SAS Institute, Cary, NC, USA).
To 400 µL AuNPs were added variable volumes of PBSx10 and, after homogenisation, variable proportions of DA 10 ppm in RPMI-1640 with 10 % HS and 5 % FBS. These proportions were expressed as the volume of dopamine sample divided by the sum of the volumes of dopamine sample and AuNPs.
Three volumes of PBSx10 were determined: 50, 125 and 200 µL. Three proportions of sample were also chosen: 10, 30 and 50 %, corresponding to 44, 171 and 400 µL. Four repetitions of each condition, and eight repetitions for the central point, were realised. Table S1 describes the experiments that were carried out for the DoE.
Cell culture and stimulation experiments
2.5
Rat phaeochromocytoma PC-12 cells were cultured in T-75 and T-25 culture flasks. The culture medium consisted of RPMI-1640 supplemented with 10 % horse serum and 5 % foetal bovine serum, and it was freshened every two or three days. The cells were incubated at 37°C in an atmosphere containing 5 % of CO2. When the cells became confluent, they were
The stimulation solutions were made up of isotonic 0.02 M HEPES buffers containing 1 mM magnesium sulphate, 0.01 M glucose and different amounts of calcium chloride (3 mM to 100 mM) and/or potassium chloride (5 mM or 100 mM) to trigger the exocytosis of dopamine [26]. The pH of these buffers was brought to 7.4 with 0.5 M sodium hydroxide and their isotonicity (0.9 % NaCl equivalent) was guaranteed by the addition of the appropriate amount of sodium chloride.
For the exocytosis stimulation experiments, confluent PC-12 cells in T25 were first washed with PBS. Then, the cells were detached by hose, using 1.5 mL of PBS, and collected in an Eppendorf®. The cell suspension was thereafter centrifuged for 5 min at 1941 rpm (400 g) and at room temperature to maintain the cells alive. The supernatant was removed and the resulting cell pellet was weighed. Ninety microliters of stimulation solution were added to the cell pellet. The Eppendorf® was gently vortexed to resuspend the cells. Afterwards, the cell suspension was centrifuged again at room temperature for 5 min at 1941 rpm. The supernatant was collected and analysed by SERS.
In order to increase the dopamine biosynthesis and release, dexamethasone was added for 4 days in the culture medium of PC-12 cells, at a final concentration of 5 µM. The medium was replaced every day. The same stimulation procedure was applied, with a stimulation solution containing 0.02 M HEPES, 1 mM magnesium sulphate, 0.01 M glucose and 50 mM calcium chloride at pH 7.4 and isotonised with an appropriate amount of sodium chloride.
Matrix preparation for the calibration curves
2.6
For the establishment of the dopamine calibration curve in conditions similar to the cell stimulation experiments, confluent PC-12 cells in several T75 were first washed with PBS. Then, the cells were detached by hose, using 1.5 mL of PBS, and collected in Eppendorfs®. The cell suspensions were thereafter centrifuged for 5 min at 1941 rpm (400 g) and at room temperature. The supernatants were removed and the resulting cell pellets were weighed. Three hundred and fifty microliters of 0.02 M HEPES buffers containing 1 mM magnesium sulphate, 0.01 M glucose and 0.145 M sodium chloride were added to the cell pellets. The Eppendorfs® were gently vortexed to resuspend the cells. Afterwards, the cell suspensions were centrifuged again at room temperature for 5 min at 1941 rpm (400 g). The supernatants were collected and gathered in an Eppendorf®. To this Eppendorf®, calcium chloride 2.2 M and potassium chloride 2.2 M solutions were added in order to reach a final concentration of 100 mM of calcium chloride and potassium chloride. Dopamine solutions at concentrations of 0.25, 0.5,1, 2.5, 5, 10, 25 and 50 ppm were prepared in this matrix and were kept on ice in the dark for the duration of the experiments.
Equipment
2.7
The AuNPs suspensions were characterized by UV-Visible spectroscopy, dynamic and electrophoretic light scattering (DLS and ELS respectively), nanoparticle tracking analysis (NTA), atomic force microscopy (AFM) and transmission electron microscopy (TEM). The pH of the AuNPs was also measured. The UV-Visible spectrum of the AuNPs in a 10 mm quartz cuvette was acquired in the range of 300 to 800 nm, with 1 nm spectral resolution, using either a Lambda 40 UV-Visible spectrophotometer (Perkin Elmer, Waltham, MA, USA) or a Varian Cary 50 Bio UV-Visible spectrophotometer (Agilent Technologies, Santa Clara, CA, USA). The hydrodynamic diameter (as the intensity-weighted mean size, Zave) and size
pH of the suspensions was measured with the Seven Easy pH meter (Mettler Toledo, Columbus, OH, USA).
A LabRAM HR Evolution Raman microscope (Horiba Jobin-Yvon, Lyon, France), equipped with a 785 nm laser (50 mW on the sample) and a two-dimensional EMCCD detector (1600 x 200 pixel sensor), was used to acquire the SERS spectra. The analyses were realised with a 300 gr/mm grating and the laser light was focussed on the sample through a 50x LWD objective (NA = 0.55). The data were acquired in the 350-1750 cm-1 spectral range. The confocal slit-hole, the exposition time and number of repetitions were fixed at 200 µm, 7 seconds and 3, respectively.
For the protein precipitation experiments, the SERS spectra were acquired on a RamanStation 400F spectrometer (Perkin Elmer, Waltham, MA, USA) equipped with a 785 nm laser (80 mW on the sample) and a two dimensional CCD detector (1024 x 256 pixel sensor) operating at -50°C. The spectra were collected in the 300-2000 cm-1 spectral range with a 2 cm-1 resolution. Three repetitions of 7 seconds were realised for each sample.
Data analysis
2.8
3.
Results and discussion
Synthesis of gold nanoparticles
3.1
Three batches of gold nanoparticles (AuNPs) were synthesised in two different laboratories and characterised, in order to probe the repeatability and inter-laboratory reproducibility of the synthetic approach. The characterisation results are summarised in Table S2.
The AuNPs had a wine-red colour with an absorption maximum located at 540 ± 2 nm (mean ± SD) and 543 ± 4 nm, and an absorbance maximum of 0.370 ± 0.002 a.u. and 0.386 ± 0.021 a.u. in the laboratory A and B respectively (Figure S1). This absorption maximum arises from the surface plasmon resonance (SPR) absorbance of AuNPs and its position and intensity depend upon the size of the latter [31]. The diameter (in nm) of AuNPs can indeed be estimated from the position of the absorption maximum by means of Equation S1, coming from reference [31]. The calculated sizes were 66.7 ± 3.8 nm for the laboratory A and 72.3 ± 6.3 nm for the laboratory B.The mean sizes of the AuNPs measured by DLS in each laboratory were 66.3 ± 5.3 nm and 76.4 ± 6.4 nm, with a polydispersity index (PDI) of 0.25 ± 0.02 and 0.22 ± 0.03, respectively. A monomodal size distribution was observed (Figure S2). These values are in accordance with the values found in the literature [30,32]and given the low PDI values (between 0.1 and 0.4 [33]), the shape of the AuNPs was expected to be homogeneous to moderately polydisperse. This was confirmed by atomic force microscopy (AFM) and transmission electron microscopy (TEM), as it can be seen in Figure S3. The nanoparticle shape is mainly pseudo-spherical, with only a small number of more faceted (tetrahedral and octahedral) nanostructures observed.
both laboratories, DLS, NTA and AFM gave similar results: around 67 nm for the laboratory A and around 75 nm for the laboratory B (Table S2). Due to logistical issues, only one batch of AuNPs was analysed by NTA and AFM for the laboratory A while the three batches of AuNPs synthesised in the laboratory B were characterised. As observed in Table S2, DLS gave slightly smaller sizes in comparison with NTA. This could be readily explained by the fact that these two techniques determine the size in fundamentally different ways. DLS measures the translational diffusion coefficient using the intensity fluctuation of scattered light as the nanoparticles move under Brownian motion; NTA tracks the plane-dependant motion of light scattered from individual nanoparticles in real time and direct space. Both techniques then apply modifications to the Stokes-Einstein relationship to determine hydrodynamic diameters. As a result, the size determined by DLS is often smaller and with a greater error than the one obtained by NTA [33,34]. From Figure S2 and S4, it was also noticed that the modality of the distribution was different in DLS (monomodal) and in NTA (multimodal). This difference is related to the resolution of the techniques: DLS has low to moderate resolution, able to discriminate nanoparticles with a 3-fold size difference; on the contrary, the resolution of NTA is high, with only a 0.5-fold difference in size necessary to differentiate two discrete populations of nanoparticles [33,34]. Accordingly, the dynamic nature of the AuNPs samples can be visualised by NTA, with the reversible formation of clusters of two, three or more nanoparticles corresponding to the peaks of larger sizes in Figure S4.
The AuNPs are expected to possess a negative surface charge, since the reducing agent, sodium citrate, is added in excess during the synthesis. As a result, this excess adsorbs to the surface of the AuNPs, stabilising the nanoparticle suspension through electrostatic repulsion [37]. The negative surface charge was confirmed by ELS, where zeta potentials of -42.3 ± 2.7 mV and -40.2 ± 6.5 mV respectively were observed for samples prepared in each laboratory. Furthermore, the good stability of the AuNPs suspension was confirmed, as the Zeta potential was more negative than the -30 mV threshold value defining colloidal stability [33].
Finally, the pH of AuNPs suspensions was of 5.41 ± 0.02 in both laboratories.
Currently, no legislation regarding the repeatability or reproducibility of the nanoparticle synthesis has been implemented yet. However, based on the results obtained and taking into account the variability brought by human and material factors, the repeatability and inter-laboratory reproducibility of the AuNPs could be shown. A small amount of variability between the different batches synthesised inside the same laboratory was observed and found to be greater in the laboratory B. We believe this can be readily attributed to human factors and differences in laboratory hardware, including hotplates, where heating and stirring parameters may vary, and injection devices.
Development and optimisation of quantitative SERS methods
3.2
metabolic and growth state of the cells [28]). Conversely, no adrenaline is detectable in these cells [25,28].
The culture medium of PC-12 cells being made of RPMI-1640 with 10 % of horse serum (HS) and 5 % of foetal bovine serum (FBS), the protein content of the medium was expected to be high. This led to the impossibility to aggregate the AuNPs when they were mixed with the culture medium sample, due to the protein corona stabilisation.
3.2.1 Overcoming of the protein corona stabilisation
It is a well-known fact that the proteins present in serum (and consequently in cell culture media) tend to adsorb to the surface of nanoparticles, forming a so-called protein corona. This corona is composed of a tightly bound inner layer (hard corona) and a loosely bound external layer (soft corona) of proteins. Albumin is the main component of the protein corona forming in serum, but immunoglobulins, fibrinogen, opsonins, complement proteins and apolipoproteins are also found in this one [38,39]. Suspensions of nanoparticles are stabilised by the protein corona [40,41]. However, the formation of hot spots, consisting of nanoparticle aggregates, is required to increase the SERS signal [42]. Consequently, the protein corona greatly reduces the intensity of the observed SERS signal. In addition, the adsorption of serum proteins to the AuNPs surface would compete with the adsorption of the analytes of interest, with the possible consequence of masking the SERS response of the latter.
With a view to studying the culture medium of rat phaeochromocytoma PC-12 cells, various strategies to overcome the stabilisation of the nanoparticle suspension were therefore explored.
result from the hydration of the polymer and the balance of the charges, which negatively affect the thermodynamic parameters of the protein binding [43]. The L-cysteine amino-acid was therefore chosen as it forms a zwitterion at physiological pH, is commercially available at low cost and as some anti-fouling studies have already been conducted with this molecule [44]. Unfortunately, no aggregation could be observed when the PC-12 culture medium was added to AuNPs functionalised with L-cysteine. As a consequence, the DA spectral features could only be slightly observed at high concentrations (Figure S5). The addition of a salt solution did not aggregate the sample. On the other hand, self-assembled monolayers of thioalkane can also prevent non-specific protein adsorption [45]. 1-Dodecanethiol was selected to probe its anti-fouling capabilities. Since 1-dodecanethiol is not soluble in water, a 50 µM solution was prepared in absolute ethanol. The Raman response of ethanol was observed, which restricted the amount of 1-dodecanethiol that could be added to AuNPs. Once again, this functionalisation agent failed to avoid protein binding to the AuNPs, and DA in PC-12 culture medium could only be detected at high concentrations (Figure S6).
solution was added as aggregation agent, the trichloroacetic acid-treated sample induced AuNPs aggregation. This could be due to the decrease in the pH of the nanoparticle suspension conferred by trichloroacetic acid. However, whereas DA characteristic bands could be observed in the SERS spectra of methanol and acetonitrile samples, it was not the case for trichloroacetic acid samples. In each case, the adsorption of DA on the precipitated proteins was checked by comparing the intensities obtained with a sample spiked with dopamine before and after the protein precipitation procedure. The height of the characteristic 668 cm-1 dopamine band decreased in the samples spiked before protein precipitation, indicating a loss of dopamine during the process, either by degradation or by adsorption on the precipitated proteins. As it can be seen in Figures S11 and S12, this decrease was more pronounced when using methanol than acetonitrile. The Raman intensities were quite similar in both cases, with slightly higher values for acetonitrile though.
The PC-12 culture medium and, in general, samples containing serum are extremely viscous and make bubbles when being pipetted. Therefore, the removal of serum proteins could also be evaluated by the facility of sample handling. While ultrafiltration led to fluid samples without any bubbles, protein precipitation gave slightly less favourable results. The samples were indeed still a little viscous with a few bubbles.
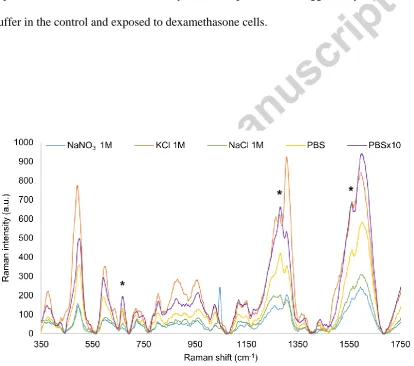
first time that such a strategy is reported with the aim of analysing serum samples. Different salt solutions were tried out: sodium nitrate 1 M, potassium chloride 1 M, sodium chloride 1 M, phosphate buffered saline (PBS) and a concentrated phosphate buffer (1.44 g/L potassium dihydrogen phosphate, 7.95 g/L di-sodium hydrogen phosphate and 90 g/L sodium chloride, thereafter denoted as PBSx10). As it can be noticed in Figure 1, PBSx10 gave the best results in terms of sensitivity and of quality of the spectrum, and was consequently selected for the following experiments. With a view to decreasing the amount of salt solution added to AuNPs and therefore the dilution factor while increasing the sensitivity, the use of a more concentrated phosphate buffer could have been suggested. However, this was excluded as the limit of solubility of the solution components was already almost reached in PBSx10.
3.2.2 Optimisation of the sample preparation
The Design of Experiments (DoE) approach was chosen to optimise the SERS sample preparation, because it allows to minimise the number of experiments while providing reliable results. Furthermore, the DoE approach investigates the interactions between the different parameters that are varied [50].
result confirmed what our group had already observed previously: to wit, when analysing complex samples, using only a small proportion of the sample in comparison to the AuNPs volume allows to reach the maximum sensitivity [32].
3.2.3 Specificity
affinity for AuNPs. Similarly, the presence of a hydroxyl group in the structure of adrenaline and noradrenaline is also thought to explain why DA has the greatest affinity for AuNPs.
Calibration curves
3.3
the cell stimulation conditions (Figure 5a). This band was ideally located and shaped and could consequently be employed to undertake a normalisation of the DA band, in order to improve the results to some extent, by getting rid of experimental variations (sample position or laser intensity fluctuation) or of the AuNPs aggregation state. The normalised area of the 588 cm-1 DA band displayed a square root trend when it was plotted against the DA concentration. Therefore, a second order polynomial curve was fitted for DA concentrations ranging from 0.25 ppm to 25 ppm (corresponding to 1.32 to 131.83 µM). The resulting graph is displayed in Figure 5c. The R2 for this calibration curve was 0.9798. This increase in sensitivity, in comparison with the calibration curve established in the PC-12 culture medium, could be explained by the lower amount of proteins present in the matrix, causing less competition for the AuNPs surface.
Cell stimulation and monitoring of dopamine released
3.4
As a final application of the developed SERS methodology, the detection of DA released by exocytosis by stimulated PC-12 cells was considered. Our first stimulation buffer was inspired from the reference [26], and contained 5 mM KCl and 3 mM CaCl2. The cellular
molecules may have been released by the cells under stimulation and could compete with DA for the AuNPs surface. Accordingly, these could force DA to orientate differently on the AuNPs surface. Since SERS is sensitive to changes in molecular orientation, this could explain the spectral variations observed.
Subsequently, the influence of calcium and potassium ions, taken either alone at a low or a high concentration or taken together at a high concentration, was questioned (Figures S15 and S16). When potassium was applied solely, no DA band could be observed. On the contrary, if calcium was present, either alone or in combination with potassium, DA was detected. Furthermore, the intensity of DA-related bands appeared to vary in a calcium concentration dependant manner. This result endorsed what was found in the literature [4,25,26,28].
Then, the effect of the calcium concentration on DA exocytosis was deeply examined. The area of the DA band (588 cm-1) was normalised by the area of the 995 cm-1 band, and this result was corrected for the weight of cells, since the more cells were present for the stimulation experiment, the more DA could then be released. A concentration effect could be evidenced, with the maximum SERS signal of DA being found for 50 mM of calcium chloride (Figure 6 and Figure S17). Furthermore, this concentration of calcium appeared to give the least variations from experiments to experiments.
4.
Conclusion
This work reported a simple and easy-to-implement SERS methodology aiming at overcoming the nanoparticle stabilisation effect due to the protein corona in serum samples. It consisted in the pre-aggregation, through salt solutions, of the SERS substrate. The latter was a suspension of AuNPs whose synthesis was shown to be repeatable and reproducible between different laboratories. The optimisation of the sample preparation was conducted with a DoE approach and the optimal parameters were applied to the quantification of DA in the culture medium of PC-12 cells. DA could be quantified from 0.5 to 50 ppm (2.64 to 263.65 µM), with a R2 of 0.9874 in this medium. This method was also applied to a second cellular matrix containing fewer proteins, leading to an improved sensitivity (0.25 ppm or 1.32 µM). Finally, the effect of calcium and potassium ions on the exocytosis of DA vesicles from PC-12 cells was investigated. We found that calcium had a prevailing effect and that this effect was concentration dependant, with the greatest amount of DA released by cells stimulated with a 50 mM calcium chloride buffer.
Acknowledgements
This work was supported by the National Fund for Scientific Research, FNRS-F.R.S. (1.A030.17 - FC6921). The Walloon Region is also gratefully acknowledged for the funding of P.-Y. Sacré.
Appendix A. Supplementary material
Supplementary data associated with this article can be found in the online version.
References
[1] J.-M. Beaulieu, R.R. Gainetdinov, The Physiology, signaling, and pharmacology of dopamine receptors, Pharmacol. Rev. 63(2011) 182-217.
[2] S.D. Iversen, L.L. Iversen, Dopamine: 50 years in perspective, Trends Neurosci. 30 (2007) 188-193.
[3] A.C. Aperia, Intrarenal dopamine: A key signal in the interactive regulation of sodium metabolism, Annu. Rev. Physiol. 62 (2000) 621–647.
[5] P. Wang, M. Xia, O. Liang, K. Sun, A.F. Cipriano, T. Schroeder, H. Liu, Y.-H. Xie, Label-free SERS selective detection of dopamine and serotonin using graphene-Au nanopyramid heterostructure, Anal. Chem. 87 (2015) 10255-10261.
[6] J. Bicker, A. Fortuna, G. Alves, A. Falcão, Liquid chromatographic methods for the quantification of catecholamines and their metabolites in several biological samples - A review, Anal. Chim. Acta 768 (2013) 12-34.
[7] X. Li, S. Zhao, H. Hu, Y.-M. Liu, A microchip electrophoresis-mass spectrometric platform with double cell lysis nano-electrodes for automated single cell analysis, J. Chromatogr. A 1451 (2016) 156-163.
[8] A. Naccarato, E. Gionfriddo, G. Sindona, A. Tagarelli, Development of a simple and rapid solid phase microextraction-gas chromatography–triple quadrupole mass spectrometry method for the analysis of dopamine, serotonin and norepinephrine in human urine, Anal. Chim. Acta 810 (2014) 17-24.
[9] X.-D. Xiao, L. Shi, L.-H. Guo, J.-W. Wang, X. Zhang, Determination of dopamine hydrochloride by host-guest interaction based on water-soluble pillar[5]arene, Spectrochim. Acta Part A 173 (2017) 6-12.
[10] J. Zhao, L. Zhao, C. Lan, S. Zhao, Graphene quantum dots as effective probes for label-free fluorescence detection of dopamine, Sens. Actuators B 223 (2016) 246-251.
[11] Y. Tao, Y. Lin, J. Ren, X. Qu, A dual fluorometric and colorimetric sensor for dopamine based on BSA-stabilized Au nanoclusters, Biosens. Bioelectron. 42 (2013) 41-46.
[13] E. Dumont, C. De Bleye, P.-Y. Sacré, L. Netchacovitch, Ph. Hubert, E. Ziemons, From near-infrared and Raman to surface-enhanced Raman spectroscopy: Progress, limitations, perspectives in bioanalysis, Bioanalysis 8 (2016) 1077-1103.
[14] L.E. Jamieson, S.M. Asiala, K. Gracie, K. Faulds, D. Graham, Bioanalytical measurements enabled by surface-enhanced Raman scattering (SERS) probes, Annu. Rev. Anal. Chem. 10 (2017) 415–437.
[15] K. Kneipp, Y. Wang, R.R. Dasari, M.S. Feld, Near-infrared surface-enhanced Raman scattering (NIR-SERS) of neurotransmitters in colloidal silver solutions, Spectrochim. Acta 51 (1995) 481-487.
[16] S. Pande, S. Jana, A.K. Sinha, S. Sarkar, M. Basu, M. Pradhan, A. Pal, J. Chowdhury, T. Pal, Dopamine molecules on Aucore-AgShell bimetallic nanocolloids: Fourier transform
infrared, Raman, and surface-enhanced Raman spectroscopy study aided by density functional theory, J. Phys. Chem. C 113 (2009) 6989-7002.
[17] Y. Bu, S. Lee, Influence of dopamine concentration and surface coverage of Au shell on the optical properties of Au, Ag and AgcoreAushell nanoparticles, ACS Appl. Mater. Interfaces
4 (2012) 3923-3931.
[18] F. Gao, L. Liu, G. Cui, L. Xu, X. Wu, H. Kuang, C. Xu, Regioselective plasmonic nano-assemblies for bimodal sub-femtomolar dopamine detection, Nanoscale 9 (2017) 223-229. [19] T.-A. Nguyen, S.-W. Lee, Effect of electrodeposition cycles on the performance of gold nanostructures as SERS-active substrates, J. Ind. Eng. Chem. 48 (2017) 230-234.
dopamine in an artificial cerebrospinal fluid and a mouse striatum using Fe3O4/Ag
nanocomposite, Anal. Chem. 86 (2014) 2939-2946.
[21] P. Li, B. Zhou, X. Cao, X. Tang, L. Yang, L. Hu, J. Liu, Functionalized acupuncture needle as surface-enhanced resonance Raman spectroscopy sensor for rapid and sensitive detection of dopamine in serum and cerebrospinal fluid, Chem. - Eur. J. 23 (2017) 1-9.
[22] C.-X. Shi, Z.-P. Chen, Y. Chen, Q. Liu, R.-Q. Yu, Quantification of dopamine in biological samples by surface-enhanced Raman spectroscopy: Comparison of different calibration models, Chemom. Intell. Lab. Syst. 169 (2017) 87-93.
[23] J.H. An, D.-K. Choi, K.-J. Lee, J.-W. Choi, Surface-enhanced Raman spectroscopy detection of dopamine by DNA targeting amplification assay in Parkinsons’s model, Biosens. Bioelectron. 67 (2015) 739-746.
[24] L. Tang, S. Li, F. Han, L. Liu, L. Xu, W. Ma, H. Kuang, A. Li, L. Wang, C. Xu, SERS-active Au@Ag nanorod dimers for ultrasensitive dopamine detection, Biosens. Bioelectron. 71 (2015) 7-12.
[25] L.A. Greene, A.S. Tischler, Establishment of a noradrenergic clonal line of rat adrenal phaeochromocytoma cells which respond to nerve growth factor, Proc. Natl. Acad. Sci. U. S. A. 73 (1976) 2424-2428.
[26] M.W. Li, D.M. Spence, R.S. Martin, A microchip-based system for immobilizing PC 12 cells and amperometrically detecting catecholamines released after stimulation with calcium, Electroanalysis 17 (2005) 1171-1180.
[28] T.K. Chen, G. Luo, A.G. Ewing, Amperometric monitoring of stimulated catecholamine release from rat pheochromocytoma (PC12) cells at the zeptomole level, Anal. Chem. 66 (1994) 3031-3035.
[29] A. Elhamdani, M.E. Brown, C.R. Artalejo, H.C. Palfrey, Enhancement of the dense-core vesicle secretory cycle by glucocorticoid differentiation of PC12 cells: Characteristics of rapid exocytosis and endocytosis, J. Neurosci. 20 (2000) 2495-2503.
[30] P.C. Lee, D. Meisel, Adsorption and surface-enhanced Raman of dyes on silver and gold sols, J. Phys. Chem. 86 (1982) 3391-3395.
[31] W. Haiss, N.T.K. Thanh, J. Aveyard, D.G. Fernig, Determination of size and concentration of gold nanoparticles from UV-Vis spectra, Anal. Chem. 79 (2007) 4215-4221. [32] C. De Bleye, E. Dumont, A. Dispas, C. Hubert, P.-Y. Sacré, L. Netchacovitch, B. De Muyt, C. Kevers, J. Dommes, Ph. Hubert, E. Ziemons, Monitoring of anatabine release by methyl jasmonate elicited BY-2 cells using surface-enhanced Raman scattering, Talanta 160 (2016) 754-760.
[33] S. Bhattacharjee, DLS and Zeta potential – What they are and what they are not?, J. Controlled Release 235 (2016) 337-351.
[34] V. Filipe, A. Hawe, W. Jiskoot, Critical evaluation of nanoparticle tracking analysis (NTA) by NanoSight for the measurement of nanoparticles and protein aggregates, Pharm. Res. 27 (2010) 796-810.
[36] P.-C. Lin, S. Lin, P.C. Wang, R. Sridhar, Techniques for physicochemical characterization of nanomaterials, Biotechnol. Adv. 32 (2014) 711-726.
[37] A. Jimenez-Ruiz, P. Perez-Tejeda, E. Grueso, P.M. Castillo, R. Prado-Gotor, Nonfunctionalized gold nanoparticles: Synthetic routes and synthesis condition dependence, Chem. - Eur. J. 21 (2015) 9596-9609.
[38] E. Casals, T. Pfaller, A. Duschl, G.J. Oostingh, V. Puntes, Time evolution of the nanoparticle protein corona, ACS Nano 4 (2010) 3623-3632.
[39] A. Sasidharan, J.E. Riviere, N.A. Monteiro-Riviere, Gold and silver nanoparticle interactions with human proteins: impact and implications in biocorona formation, J. Mater. Chem. B 3 (2015) 2075-2082.
[40] J. Kneipp, H. Kneipp, M. McLaughlin, D. Brown, K. Kneipp, In vivo molecular probing of cellular compartments with gold nanoparticles and nanoaggregates, Nano Lett. 6 (2006) 2225-2231.
[41] J. Taylor, A. Huefner, L. Li, J. Wingfield, S. Mahajan, Nanoparticles and intracellular applications of surface-enhanced Raman spectroscopy, Analyst 141 (2016) 5037-5055.
[42] S. Schlücker, Surface-enhanced Raman spectroscopy: Concepts and chemical applications, Angew. Chem., Int. Ed. Engl. 53 (2014) 4756-4795.
[43] C.-J. Huang, S.-H. Chu, L.-C. Wang, C.-H. Li, T.R. Lee, Bioinspired zwitterionic surface coatings with robust photostability and fouling resistance, ACS Appl. Mater. Interfaces 7 (2015) 23776-23786.
[45] F. Sun, J.-R. Ella-Menye, D.D. Galvan, T. Bai, H.-C. Hung, Y.-N. Chou, P. Zhang, S. Jiang, Q. Yu, Stealth surface modification of surface-enhanced Raman scattering substrates for sensitive and accurate detection in protein solutions, ACS Nano 9 (2015) 2668-2676. [46] Q. Guo, M. Xu, Y. Yuan, R. Gu, J. Yao, Fabrication and surface enhanced Raman spectroscopy of single Au@SiO2 dimers linked by benzenedithiol, J. Raman Spectrosc. 47
(2016) 537-544.
[47] N. Guarrotxena, B. Liu, L. Fabris, G.C. Bazan, Antitags: Nanostructured tools for developing SERS-based ELISA analogs, Adv. Mater. 22 (2010) 4954-4958.
[48] M. Roca, N.H. Pandya, S. Nath, A.J. Haes, Linear assembly of gold nanoparticle clusters via centrifugation, Langmuir 26 (2010) 2035-2041.
[49] K.L. Wustholz, A.-I. Henry, J.M. McMahon, R.G. Freeman, N. Valley, M.E. Piotti, M.J. Natan, G.C. Schatz, R.P. Van Duyne, Structure-activity relationships in gold nanoparticle dimers and trimers for surface-enhanced Raman spectroscopy, J. Am. Chem. Soc. 132 (2010) 10903-10910.
[50] Miryam Barad, Chapter 4: Design of Experiments (DOE), in: Janusz Kacprzyk (Eds) Strategies and Techniques for Quality and Flexibility, first ed., Springer, Cham, Switzerland, 2018, 61-79.
[51] Y. Bu, S.-W. Lee, The characteristic AgcoreAushell nanoparticles as SERS substrates in
detecting dopamine molecules at various pH ranges, Int. J. Nanomed. 10 (2015) 47-54.
Figure captions
Figure 1: SERS spectra obtained for DA in PC-12 culture medium samples analysed with different pre-aggregation agents. To 250 µL AuNPs were added 200 µL NaNO3 1M, 50 µL
KCl 1M, 300 µL NaCl 1M, 300 µL phosphate buffer or 30 µL concentrated phosphate buffer (PBSx10). After homogenisation, 250 µL of 100 ppm dopamine solution in the PC-12 culture medium were added. The bands highlighted by asterisks are DA-related bands. The concentrated phosphate buffer (PBSx10) is the pre-aggregation agent that led to the best signal enhancement (colours online).
Figure 2: Surface response curve obtained for the central composite Design of Experiments that was realised.
Figure 3: Comparison of the SERS spectra of dopamine, noradrenaline and adrenaline at a concentration of 20 ppm in the PC-12 culture medium. The 668 cm-1 band, highlighted by an asterisk, is characteristic of DA, demonstrating the specificity of the technique in this culture medium (colours online).
Figure 4: a) Spectra obtained for dopamine calibration curve in the PC-12 culture medium. The spectral region surrounded by a black rectangle is enlarged in b) and highlights the characteristic 668 cm-1 dopamine band. c) The logarithm of the area of this band was plotted against the logarithm of the dopamine concentration. The error bars correspond to the standard deviation of three repetitions (colours online).
of the 588 cm-1 band was plotted against the dopamine concentration. The error bars correspond to the standard deviation of three repetitions (colours online).
Figure 6: Stimulation of PC-12 cell exocytosis with the help of buffers containing diverse calcium concentrations. The error bars represent the standard deviation of 6 measures per concentration of CaCl2, except for 5 mM, 50 mM and 100 mM, where 4, 10 and 5 measures
[image:34.595.79.494.301.667.2]were respectively realised.
Figure 7: Comparison of the amount of dopamine released by PC-12 cells exposed versus not exposed to dexamethasone. The exocytosis of dopamine was triggered by a 50 mM CaCl2
Highlights:
Gold nanoparticles were synthesised and characterized in 2 different laboratories.
A simple SERS method was developed to analyse serum-containing samples.
The colloid pre-aggregation allowed to circumvent protein corona related issues.
Dopamine was determined in PC-12 cell culture medium from 0.5 to 50 ppm.