Cellular Networks with Hybrid Energy Sources
.
White Rose Research Online URL for this paper:
http://eprints.whiterose.ac.uk/134872/
Version: Accepted Version
Article:
Fletscher, Luis, Suarez, Luis, Grace, David orcid.org/0000-0003-4493-7498 et al. (2 more
authors) (2018) Energy-Aware Resource Management in Heterogeneous Cellular
Networks with Hybrid Energy Sources. IEEE Transactions on Network and Service
Management. ISSN 1932-4537
https://doi.org/10.1109/TNSM.2018.2866533
eprints@whiterose.ac.uk https://eprints.whiterose.ac.uk/ Reuse
Items deposited in White Rose Research Online are protected by copyright, with all rights reserved unless indicated otherwise. They may be downloaded and/or printed for private study, or other acts as permitted by national copyright laws. The publisher or other rights holders may allow further reproduction and re-use of the full text version. This is indicated by the licence information on the White Rose Research Online record for the item.
Takedown
If you consider content in White Rose Research Online to be in breach of UK law, please notify us by
Energy-Aware Resource Management in
Heterogeneous Cellular Networks with Hybrid
Energy Sources
Luis A. Fletscher
∗†, Luis A. Su´arez
‡, David Grace
§, Catalina Valencia
∗, Jos´e M. Maestre
¶∗
Universidad Nacional de Colombia, Department of Energy and Processes, Medell´ın, Colombia
†Universidad de Antioquia UdeA, Department of Electronic Engineering, Medell´ın, Colombia
‡
Huawei Technologies Co. Ltd, Moscow, Russian Federation
§
University of York, Department of Electronic Engineering, York, United Kingdom
¶Universidad de Sevilla, System Engineering and Automation Department, Seville, Spain
Abstract—In this paper, we focus on reducing the on-grid en-ergy consumption in Heterogeneous Radio Access Networks (Het-Nets) supplied with hybrid power sources (grid and renewables). The energy efficiency problem is analyzed over both short- and long-timescales by means of reactive and proactive management strategies. For short-timescale case, a renewable-energy aware User Equipment (UE)-Base Station (BS) association is proposed and analyzed for the cases when no storage infrastructure is available. For long-timescale case, a traffic flow method is proposed for load balancing in renewable energy BSs, which is combined with a model predictive controller (MPC) to include forecast capabilities of the renewable energy source behavior in order to better exploit a Green HetNet with storage support. The mechanisms are evaluated with data of solar measurements from the region of Valle de Aburr´a, Medell´ın, Colombia and wind estimations from the Moscow region, Russian Federation. Results show how the green association proposal can reduce on-grid energy consumption in a HetNet by up to 34%, while is able to exceed the savings obtained by other methods, including the best-signal level policy by up to 15%, additionally providing high network efficiency and low computational complexity. For the long-timescale case, MPC attainable savings can be up to 22% with respect to the on-grid only Macro-BS approach. Finally, an analysis of our proposals in a common scenario is included, which highlights the relevance of storage management, although emphasizing the importance of combining reactive and proactive methods in a common framework to exploit the best of each approach.
Index Terms—Renewable Energy, Energy-aware management, Wireless networks and cellular networks, Energy- Efficiency, Green Radio, Heterogeneous Networks
I. INTRODUCTION
The fast pace of growth in mobile networks is well-known. The latest advances in 4G-LTE, and lately the motivated research towards 5G and beyond, show that progress will continue rapidly over the following years. This evolution is a result of the ever-increasing data traffic as a result of an exponential rise of the number of subscribers and mo-bile devices, which run data-hungry applications, i.e., video streaming, cloud storage, social networking, and multimedia content. According to [1], mobile traffic will increase at a compound annual growth rate of 46% for the period of 2016 to 2021, with currently more than 8 billion mobile devices in service. For the telecommunications industry this implies a
need to increase infrastructure deployment for the Core and Radio Access Network (RAN), which means higher capital and operational expenditures, i.e., CAPEX and OPEX respec-tively. One important item related to OPEX are the energy costs, which could be lowered by means of renewable energy utilization. In addition, the utilization of conventional energies like fossil fuels increaseCO2footprint caused by operating the
network. Despite the hard work and initiatives to mitigate and improve systems efficiency the figure for 2020 is expected to reach 2.3% (1.3GtonsCO2) of the global emissions (55Gtons
CO2) [2]. Furthermore, the use of conventional energy supply
present obstacles for implementation in developing countries due to the limited ability to bear the costs, resource availability and the associated technologies needed. For example, accord-ing to statistics in 2011, around 1.3 billion people did not have access to electricity [3].
For the above mentioned reasons, the use of renewable energy (RE) is highly important for global development. Par-ticularly for the Information and Communication Technologies (ICT) sector, many proposals and initiatives have targeted ways of reducing energy consumption and using energy in a more efficient way for mobile networks. These research ini-tiatives have been called collectively Green Radio [4]. Results have shown that most of the energy consumption in a cellular network is due to the base station (BS), whose consumption depends on the traffic load and fluctuations throughout time [5]. Hence, an appropriate UE to BS association mechanism that makes it possible to balance downlink traffic loads among BSs can be key to reduce on-grid consumption by benefiting of the capabilities of a number of renewable energy powered BSs and the possibilities to exploit the renewable energy availability.
aim is to show how two complementary reactive and proactive strategies improve energy efficiency at different levels, where the dynamics of the renewable power sources used stress the relevance of short- and long- timescales in the decision making process.
Fig. 1: Energy Strategy Classification based on Timescale and Control type
A. Control Strategy based on the Timescale
Regarding the renewable energy sources and traffic be-havior, it is relevant to consider how networks operate over long- and short- timescales [6]. Over a long-timescale, traffic patterns change according to the time of the day (temporal variability of traffic) and decisions about energy management must be made taking into account the renewable energy source availability during a rather long period of time. Proactive control methods are very suitable in this case as they exploit forecast information to make control decisions and prediction data could be easily obtained. On the other hand, for short-time scale, reactive control mechanisms are very useful as they provide instantaneous response based on the current state of the system. This brings more control on the quality experience provided for users. Over a short-timescale, cell selection decisions are made assuming that the operational transitions of the base station due to traffic dynamics are nearly static. However, we need a fast response to abrupt fluctuations in the energy source at our disposal and reactive association schemes are more appropriate. In contrast, the integration of reactive methods for an optimal usage of battery storage is difficult as rapid energy fluctuations cannot be anticipated.
1) Short-timescale: Initially, the UE-BS association
prob-lem is analyzed over the short-timescale with a reactive control strategy, considering a hybrid powered network without battery support, with wind considered as a renewable energy source. The wind profile is highly fluctuating which has a significant effect on UE-BS association dynamics. Also wind behaves differently when compared with photovoltaic energy, in the fact that it could be available for very long periods without diurnal interruption, which justifies the absence of batteries in our assumption. The on-grid consumption at the macrocellular level is reduced by load balancing supported on hybrid pow-ered small cells by means of a green renewable energy aware policy for UE-BS association. This first part of the models in
this paper rely on estimations of wind of the region of Moscow, Russian Federation. This scenario is particularly interesting as it provides an insight into the potential capabilities of wind to power a wireless network in a region with a great wind potential but which is less attractive in terms of solar energy throughout the year. In addition, some other UE-BS association mechanisms are introduced for the sake of com-parison. A traditional best-signal UE-BS association scheme; a discrete branch-and-bound UE-BS association optimizer and last but not least, a greedy association algorithm based on the transmission rate and the signal level provided, as presented in [7]. To evaluate in a more complete way the performance of our proposal at this timescale, an analysis of computational complexity and user experience are made in comparison with the benchmark schemes.
2) Long-timescale: Later in the paper, the problem is
ana-lyzed over a long-timescale with a proactive control strategy to manage the aggregated BS traffic load per hour and a Photo-voltaic (PV) system with storage energy support. This study corresponds to an extended analysis of our work in [8], which uses solar radiation data from the Vall´e de Aburr´a region, Medellin, Colombia. The results of this second part provide useful insights without loss of generality and are valid for other kinds of renewable energy based systems. A model predictive controller (MPC) based on a traffic flow perspective is evaluated to reduce grid energy consumption over the long-timescale. The MPC incorporates weather forecasts in the flow allocation decision process. In the control field, MPC appears as a general way in global industry to solve control problems with multiple variables and heterogeneous characteristics [9]. For this reason, it is fairly common to find applications of MPC in communication systems. For instance, in [10], authors apply MPC to manage the power signal in the BS and reduce the negative impact of disturbance in the transmission process. Likewise, the reduction of co-channel interference through distributed power adaptation using MPC is addressed in [11]. To the best of our knowledge, the MPC approach has not yet been proposed for energy management in HetNets powered with renewable energy. In order to provide a wider analysis of our proposals, the MPC analysis is extended by adding granular traffic variability and compared with the traditional best-signal and our own UE-BS green association mechanism for short-time scale using battery support in order to provide some useful insights on the advantages of storage management.
B. Contributions and Outline
A novel reactive energy-aware UE-BS association and a proactive energy management schemes are proposed to reduce grid consumption in HetNets powered by hybrid sources, considering the different characteristics of short- and long-timescale behaviors and the unique characteristics of wind and solar energy sources. In particular, the contributions of this paper are the following:
irrespective of whether other BSs provide better signal levels. For the green SCBS nodes, it is considered that the absence of batteries make it possible to evaluate the real impact of the association mechanism on the grid consumption reduction, as well the viability of avoiding the need to use a storage system, fully relying on the surrounding green sources. This is particularly attractive for forms of energy like wind which can be continuously present for long periods of time. An analysis of user experience and complexity is provided, which is sensible for the resolution in the short-timescale.
2) For the long-timescale case, a proactive control mech-anism based on MPC is presented that includes the current system state and weather forecast in the energy management process. In addition, the MPC solution has a low complexity with respect to other type of optimal strategies, which makes it possible to be implemented in real systems. This solution when combined with a storage system is particularly relevant in the solar energy context.
3) Finally, the proactive control mechanism is extended to more granular traffic and compared with the reactive control approach. It is shown how MPC with battery support performs better than the best signal and green UE-BS association in terms of storage management. Nevertheless, in absence of storage the much simpler reactive UE-BS green association mechanism is more adequate. This lead us to conclude that whole solution should be a joint approach of our short and long-time scale mechanisms.
This paper is organized as follows: In Section II, a selection of related works on the Green UE-BS Association mechanisms for Radio Access Heterogeneous Networks is provided. The system model considered used in the paper is described in Section III. Section IV presents the proposed renewable energy aware UE-BS association algorithm for the short-timescale cases, as well as the characteristics of our case study. In Section V the MPC scheme for the long-timescale case is presented. In Section VI, the performance of the proposed mechanisms are evaluated for the different scenarios in short and long-time scale. Finally, in Section VII the conclusions are provided.
II. RELATEDWORKS
In Green Radio, particular attention has been given to BS topology management approaches including load balancing and traffic redistribution by switching off a number of BSs during low traffic periods also known as night zones [12]. This is related to the concept of cell zooming, which is a form of cell-breathing applied for energy efficient topology manage-ment to enable sleep modes in underutilized BS infrastructure. This algorithm is firstly described in [13]. Other authors extend the work in this direction by providing solutions which deals with proper load balancing and congestion management in works like [14] and [15]. The work is further extended in [16], which provides insights on how to perform the cell-breathing, BS switching-off and traffic offloading for Hetnets with small cells. This work is later complemented in [17] which deals in addition with hybrid energy for HetNets by proposing a UE-BS association multimetric approach. In [18]
authors present a combined radio resource management for green Het-Nets which use differentiated policies based on traffic which emphasizes sleep modes for low traffic and load balancing for higher traffic demands. Authors in [19] propose hybrid scenarios with on-grid and renewable energy powered small cells coexisting by means of coordinated ON/OFF small cell layer schemes, while providing offloading support for the load of macrocellular layer. A Hybrid Hetnet cloud based scenario is studied in [20], while proposing a joint energy aware centralized scheme which splits the solution for 1) UE association method for short-timescale rapid traffic fluctuations 2) a BS Operation (ON/OFF) state mechanism in order to deal with the overall network consumption. Other approaches like [21] consider more innovative heterogeneous scenarios including Drone BS systems which could provide support to the land infrastructure and facilitate the topology reconfiguration.
Many other works avoid the use of sleep modes mostly relying on the renewable energy possibilities. In [22] for example, a load balancing mechanism for cell selection is presented, which redistributes load toward renewable energy powered cells by topology management based on dynamic variation of cell sizes. Also in the same direction, a cell size optimization algorithm is proposed for hybrid energy supplied radio access networks in [23]. The problem is divided in two phases: 1) green/on-grid energy allocation problem for the cell layout 2) cell adaptation based on the results of energy allocation. On the other hand, an offline gradient descent based method combined with a heuristic online mechanism for Green UE association are proposed in [24]. The same team from [24] provides a more extended optimization analysis for HetNets environments in [25] by providing a two-dimensional time/space optimization approach. In [26], a virtualized dis-tributed algorithm is proposed to define green UE-BS associ-ations in a Cloud/Soft RAN architecture, where decisions are performed into a centralized server which provides a global UE-BS association pairing mechanism based on collecting network information related to energy resources and load in order to further effectuate the BS topology reconfiguration and UE association. On the other hand, authors in [27] provide a deep study on how the traditional UE association based on best received signal could cause network congestion and unbalance while an energy aware metric provides inherently better resource usage and load balancing. In [28] a contribution to the energy aware UE association is done by providing a iterative mechanism of traffic load estimation for centralized (or virtualized) decision mechanisms. Very recently, in [29] a reinforcement learning decision making approach is used for Renewable Energy HetNets. The goal of this approach is to to determine an optimal policy for scheduling and resource allocation which maximizes energy efficiency by following the stochastic behavior and dynamics of the renewable energy availability and channel conditions.
Fig. 2: Scenario: A HetNet powered by hybrid Power Grid sources: a) SCBS using solar panel with a storage system b) SCBS powered with a wind turbine system c) MBS fully powered by the conventional electrical grid.
two benchmark approaches, a discrete optimizer and greedy algorithm, which are rather generic and provide good insights for analysis. Our short-time scale proposal is a component of our overall idea, which aims to establish a low complex-ity method, which provides instantaneous response to user requirements in scenarios when storage is not necessarily available. For the long-time scale, the capabilities of the Model Predictive Control (MPC) provide a boost on the autonomy of the renewable energy based infrastructure, which could be only exploited in the presence of storage. Both approaches should be perceived as complementary to each other by exploiting the best of each approach in specific scenarios.
III. SYSTEMMODEL
We consider a single Macro Base Station (MBS) and multiple Small Cell Base Stations (SCBS) powered with a renewable energy supply. In this way, as shown in Fig. 2, it is possible to have a MBS powered by on-grid energy and a deployment of SCBSs powered solely by renewable energy. Also if needed, these SCBSs could be connected to a battery storage system. The MBS provides the main coverage and capacity, whereas the SCBSs deployed in the MBS coverage are placed to enhance the network capacity and offload traffic from the MBS.
A geographical area L ⊂ R2 is defined, where B base
stations andU users are deployed. We considerx∈Ldenotes a location andj∈B corresponds to the index of thej-th BS. We define by convention that MBS is represented by j = 1. Each time slot has a length of τ seconds and our time of analysis corresponds to T time slots where t ∈ T is the t -th time slot [30]. The SCBSs update -the respective cell sizes everyτseconds by changing the transmission power according to the amount of available renewable energy.
A. Renewable Energy Generation Model
Traditionally, when speaking about renewable power sources for cellular systems, solar and wind power are con-sidered as the most important, mainly due to their degree of technology development and their energy potential. In order to determine the variation in the amount of renewable energy it is possible to combine validated models like the System Advisor Model- SAM developed by NREL (National
Renewable Energy Laboratory) [31] and the real data on the behavior of green sources in the geographical area of interest. Over short-timescales, wind is the selected energy source. In this case, estimated data has been used to characterize a Weibull probability distribution that represents the expected wind speed in a specific location and a time interval [32]. From this prediction, it is possible to determine an approximation of the energy produced by a micro turbine in a given period of time. The Weibull distribution used in a wind system design is:
p(v) = k
c
v
c
k−1
e−(v c)
k
(1)
wherevis the wind speed in m/s,c is the scale parameter of the distribution andk is the shape parameter.
For the long-timescale case, a different renewable energy source model is introduced. Solar radiation data is used from Medell´ın provided by the Colombian Institute of Hydrol-ogy, Meteorology and Environmental Studies - IDEAM [33]. Specifically, the IDEAM model provides information about the amount ofkWh/m2in the target area. This information,
com-bined with technical characteristics of solar panels, provides the photovoltaic energy availability per hour to power green small cells.
At the t-th time slot, the available renewable energy EG t,j
at the SCBSs j depends on the renewable energy generation rate ξt in the time slot plus the stored energy EtG−1,j, and
renewable energy consumption Ct−1,j in the previous time
slot as follows:
Et,jG =EtG−1,j−Ct−1,j+ξt (2)
B. Energy Consumption Model
The ICT-EARTH project provides a power model for the base station, which consists of a static and a dynamic power component. The static component is related to the minimal energy required for normal operation of the BS (e.g. power supply, air conditioning). This corresponds to the power con-sumption of a BS in idle mode. In contrast, the dynamic power component is originated by the traffic load and it can be approximated by a linear model. Therefore, the power consumption for a BS j is a function of traffic load given by [5]:
Pj= ∆jPjT(ρj(t)) +Pjs (3)
where∆j is the slope of load-dependent power consumption,
PT
j is the transmission power, ρj(t)is the traffic load at t-th
time slot andPs
j is the static power component. The EARTH
model can be adjusted for any kind of BS by modifying the model parameters.
C. Traffic Model
We consider that downlink traffic behaves as an inhomo-geneous Poisson point process with arrival rate per unit area
mean valueµ(x)[34]. In this sense, a traffic request arriving atxwhere useriis located, converts the useriinto an active user. Another key element is the user transmission rate. In a time slot renewable energy availability and/or network traffic requests change considerably. According to the above, if a mobile user i at location xis associated with a BS j in the
t-th time slot, the transmission rate for this user rt,i(x) can
be expressed according to the resource blocks (RBs) assigned and its modulation scheme [35]. The transmission rate for each user is fixed in a given time slot according to the mobile user modulation scheme which depends on conditions of channel. In our model, each BS assigns one RB to each active connected user until availability is finished. A user with a resource block assigned has guaranteed its allocation throughout the time interval. It is assumed that a user can only be associated with one BS (MBS or SCBS) in each time slot. Assuming also that mobile users are uniformly distributed in the coverage area of all the BSs, the normalized traffic load on a BS in one time slot, can be expressed as the relationship between the number of active users per BS at the time slot, and the amount of available resources to serve users (i.e. a max. number of users simultaneously) [18]. If the number of active users is larger than the available resources in a BS and association with another BS is not possible, a new incoming user cannot be served.
For simplicity, we consider that our system uses two dif-ferent bands for the MBS and SCBSs sets with known and static frequency reuse [26]. This makes it possible to assume a static value of interference from neighboring SCBSs into another SCBS, while assuming orthogonality between the MBS and the SCBS layer. Moreover, taking into account the current existence of Inter-Cell Interference Coordination (ICIC) schemes for fixed small cell deployments with backhaul support, the assumption of a static value could be accepted as valid for future deployments of this type with shared pool of resources [36].
In the long timescale case, the traffic profiles presented in [37] are used to model the load traffic of the MBS. Such measurements were done at 30-minute intervals in cells of a mobile network operator. In this way, it is possible to establish a normalized profile for weekdays and another for weekends. Furthermore, from the daily profiles, it is possible to define the maximum MBS power consumption.
IV. REACTIVECONTROLSCHEME: CELLSELECTION
ALGORITHM
Given the impact of active users in the overall energy con-sumption, one can focus on minimizing the on-grid consump-tion by balancing the downlink traffic loads among BSs with an appropriate UE-BS association scheme. In this first part, we propose a reactive control scheme that modifies the BS selection procedure by giving priority to green BSs over a grid-powered MBS. Initially we compare with a best received signal association method. Then a branch-and-bound optimization and transmission rate aware heuristics are also included [7]. In this scope, storage is not considered in order to show the capabilities of the algorithms with this type of limitations.
Nevertheless, wind power is considered as it perfectly fits with this scheme due to the continuous availability of this energy resource.
A. Cell Selection Algorithm
To overcome the perceived negative environmental and economic impacts of on-grid energy with respect to renewable energy, a user association policy incentives users to connect to renewable energy cells. The objective of the algorithm is to check first the possibility to attach one user request to a green SCBS according to a fitness function, even if the received signal level of the MBS is stronger. The output of the algorithm is the association matrixYi,jwithi= 1,2, ..., Uand
j = 1,2, ..., B. Therefore, yi,j = 1 if useri is served by the
BSjand 0 otherwise. The proposed user association algorithm can be condensed in the next steps:
1. Definition of initial system parameters. The system
defines users positions U(x) = {U1(x1), . . . ,UN(xN)},
renewable energy potential for each SCBS and MBS trans-mission powerPT
j .
2. Definition of initial signal level available for each user.
All users are associated with a virtual BS zero at the begin-ning of the process, to enable comparison. The theoretical received signal level from BS zero si,0, is a very small
number equivalent to a base station without transmission power. Next, the system calculates signal level matrixSi,j
withi = 1,2, ..., U andj = 1,2, ..., B. Where si,j is the
received signal level for the userifrom the BSj. For this calculation, the user position, transmission power of BS, path loss, and antenna gain are considered.
3. Checking signal levels from green base stations The
system executes a loop verification of the user’s received signal, starting with the green SCBSs, si,j with j =
2,3, ..., B. The system selects the SCBS that provides the best signal level. If the signal level is higher than the threshold ϕ, the user is connected with the green base station, otherwise, the system checks the MBS level. If none of the received signals is enough to provide service, the user is associated with the BS zero and accounted as an unserved user.
4. Assigning users to green BSs. If the user iis connected
with a green SCBSj and this BS has available resources, a fixed number of resource blocks is assigned to the user until the transmission is finished, andyi,j = 1. If the SCBS
has no available resources, the centralized manager checks if another green SCBS can be used to serve the user. If some neighbour SCBS has resources, the user is connected to a new green SCBS. If no green SCBS has resources nor enough renewable energy in the time slot of interest, the user is assigned to the MBS and yi,1 = 1. It is important
Fig. 3: Diagram of the Cell Selection Algorithm using a green-policy
5. Computation of Grid consumption and number of
served users. Finally, the amount of grid consumption is
calculated for the time slot:
Gridcon=
∆(j=1)P(Tj=1)
UA
U
X
i=1
yi,1+SC (4)
where UA is the total availability for active users in the
MBS andSCcorresponds to the static Power Consumption
of the MBS. Also the total number of UEs redistributed to the SCBSs is calculated in order to have load balancing statistics.
The purpose of this heuristic algorithm is that at each time slot, the network utilizes the available renewable energy, with on grid energy left as a last resource. A graphical explanation is provided in Fig. 3. For this scenario, we consider that
UM
j is the maximum number of users that a BS can serve
in a time instant. For the SCBSs, UM
j allows up to 100
users for j = 2, ..., B, while UM
j=1 is equal to UA for the
MBS. We have dimensioned the MBS to accept up to 3 times more UEs than a single SCBS at maximum capacity, by assuming a 3-sector BS site with specific assigned frequency bands per sector. Nevertheless, we make the assumption of using an omnidirectional antenna site to simplify the macrocell modeling. The rate of UE arrivals is relatively slow such that the MBS can serve the total of active incoming UEs even when the SCBS layer is not available.
B. Benchmark Association Strategies
In this subsection, two additional UE-BS association mecha-nisms are introduced for comparison. The first scheme is based on a discrete branch-and-bound discrete optimizer to assign UEs to BSs and the second uses a greedy algorithm to select the best BS for a UE.
The optimal UE-BS policy to reduce the overall system grid consumption can be obtained by solving the following optimization problem:
min
y = T
X
t=1
U
X
i=1
yi,1 (5)
s.t.
U
X
i=1
yi,j≤UjM j= 2,3, . . . , B (6)
yi,jsi,j≥ϕ (7)
US =
PB
j=1
PU
i=1yi,j
UA ≥ε
(8)
X
j∈B
yi,j ≤1 ∀i∈U (9)
yi,j∈ {0,1} ∀i,∀j (10)
where Eq. (5) is the objective function, which focuses on mini-mizing consumption from the grid with an optimal assignment of active users to available BSs over each time slot. Equations (6)-(10) are the problem constraints: Eq. (6) establishes that a BSj can serve a maximum ofUM
j users simultaneously; Eq.
(7) means the user’s received signal level constraint, where
si,j is the signal level received by user ifrom BS j andϕis
the minimum signal level required by a user to have service; Eq. (8) stands for the minimum ratio of users served(US)out
of a total of active users(UA); Eq. (9) requires that a user is
served only by one BS in a time slot; and Eq. (10) establishes that yi,j is a binary variable. In the same way, ε represents
a QoS criteria for the discrete optimizer and it is defined as 85% of active users.
The second method is based on a greedy algorithm. This algorithm allows ranking the BSs according to the following utility function:
wi,j=ϕnorm+
ri,j
RM
(11)
whereϕnormis the normalized signal level received by a user
with respect to the best-signal level. The second term is the normalized transmission rate that for the UE i from a BS j
in a time slot, ri,j is the transmission rate offered by BS j
andRM is the maximum possible user rate, - i.e., when the
modulation scheme is QAM64.
C. Case Study
The considered case study scenario is composed of one MBS and several (4, 16 and 36) overlapping SCBSs providing a second layer deployment. The MBS is powered by on-grid energy and is always active, ensuring permanent coverage over the geographic area. It is important to note that according to the coverage characteristics of the SCBSs, 36 SCBSs are required to cover the MBS coverage area. In the same way, to evaluate the contribution of SCBSs in the energy efficiency of the HetNet, the number of base stations is tested for reduced configurations with 4 SCBSs and 16 SCBSs cases. These values were selected to limit the small cell layer coverage by 10% and 50% of the network at full deployment (36SCBSs +1MBS), while keeping the symmetry of SCBSs with respect to the MBS. The QoS objective is defined as a reduction of the average transmission rate lower than 5%. This percentage is equivalent to the degradation caused by changing the QoS classes in LTE Networks [38].
The technical parameters of the simulation are based on a LTE system [35] located within a geographical area of 3.5km2with the wind profile parameters for Moscow. The
ge-ographical characteristics of Moscow result in a high average wind speed. Moscow is located in the northern hemisphere, with altitude 156 m.a.s.l., and seasonal temperatures between -10 ◦C in winter and 24 ◦C in summer [39]. To estimate the average wind speed in Moscow, we use [40], where the authors develop a study of wind conditions in the center of Moscow using measurements over two years. They present a characterization of wind behavior according to the season, time day, and altitude of measurement station. In order to choose conditions according to high traffic data scenarios, an average wind speed for daytime in summer, measured between 60 and 80 m is selected. The mean wind speed in these conditions is 3.6 m/s with standard deviation σ = 2.9. Therefore, it is possible to define three sectors for Moscow city, with the following average wind speed: 4.0 m/s, 3.6 m/s and 4.5 m/s [41], [42].
According to [5], the load traffic consumption slope is 4.7 for the MBS and4.0for SCBS. The static power consumption of the MBS is 130W and 6.8W for a small cell. The maximum transmission power of the MBS is 43 dBm and 22 dBm for the small cells. Users move according to a random walk point model [43] with an average speed of 4 km/h.
Each SCBS has an associated micro turbine that provides renewable energy, without a battery system. Solar energy dynamics are not taken into account here, but will be discussed in the next section. The reason to select in the short-timescale case a scenario without batteries is that it allows the dynamics of the UE-BS association to be seen without being influenced by a storage system which will converge to some stable level of accumulated energy, thereby preventing the association mecha-nism to be analyzed in presence of environmental fluctuations. In addition, for the wind case it is possible to rely on the continuous availability of the renewable energy source, which makes it less critical the necessity of a storage system. Lag power time is not considered in this model. The simulation parameters are shown in Table I.
Parameter Value
Coverage Area (L) 3.5km2
Pool of users (U) up to 1000 UE
(not simultaneously activated)
System LTE
BW LTE 20 MHz (100RBs) SCBS Layer 20 MHz for each MBS sector RB Allocation one RB per connection MBS/SCBS Antenna Type Omnidirectional
N MBS / N. SCBS A single MBS + 4 - 16 - 36 SCBSs Tx power MBS (PT
j=1) 43 dBm
Max. Simult UE MBS (UM
j=1=UA) up to∼300 UE
Max. Simult UE SCBS (UM
j,j=2,...B)
up to∼100 UE
Tx power SCBS (PT
j,j=2,...B)
22 dBm max
Static Power Cons. MBS (Ps
j=1)
130 W Static Power Cons. SCBS (Ps
j,j=2,...B)
6.8 W
Consumption Slope MBS (∆j=1)
4.7 Consumption Slope SCBS (∆j,j=2,...B)
4.0
Pathloss Model Cost 231 model Antenna Gain 15 dBi Signal Level Threshold (ϕ) -107.5 dBm Simulation time step (τ) 1s Size of request file 500 kb
[image:8.612.331.544.49.330.2]Mobility Model Random walk point Mobility Speed 4 km/h
TABLE I: Simulation Parameters
Given the average wind potentially available, a commercial micro turbine was selected with a start-up threshold wind speed of 2 m/s and an energy potential of 26W for wind speeds between 2m/s and 3m/s.
In order to capture most of benefits of wind power, these microturbines could be deployed on the roof-top of buildings, with power distributed by cables for the indoor and outdoor SCBSs nearby. Wind dynamics are updated every minute and the simulation time step corresponds to 1 second. There are 3 possible renewable energy scenarios shown in Fig. 4, where (a) SCBSs have not enough renewable energy, (b) the SCBSs of only one sector have renewable energy to operate and (c, d) one or more sectors have available renewable energy. In the figure the big red circle represents the MBS coverage area whereas the green smaller circles are the SCBS coverage areas. BS locations are represented as color diamonds.
V. PROACTIVECONTROLSCHEME: TRAFFICFLOW- MPC For long-timescale, a proactive MPC scheme based on a traffic flow is evaluated to reduce grid energy consumption on a HetNet where SCBSs are powered by Photovoltaic (PV) en-ergy with enen-ergy storage system. The MPC is implemented to incorporate a weather forecast in the flow allocation decision process. This model is quite suitable when a storage system is affordable or absolutely necessary to be included into the system. In this section, the traffic behavior is treated in an aggregated form. This means that the average load of a BSj, i.e.,ρj per hour basis, is considered instead of individual
UE-BS associations considered for the reactive control scheme in the short-timescale scenario.
MBS Coverage Area BS Location SCBS Coverage Area
m
0 1000 2000 3000 4000 0
500 1000 1500 2000 2500 3000 3500 4000
0 1000 2000 3000 4000 0
500 1000 1500 2000 2500 3000 3500 4000
0 1000 2000 3000 4000 0
500 1000 1500 2000 2500 3000 3500 4000
0 1000 2000 3000 4000 0
500 1000 1500 2000 2500 3000 3500 4000
m m m m
[image:9.612.61.557.56.193.2](a) (b) (c) (d)
Fig. 4: SCBS coverage area as a function of Green energy availability
BS 1
(MBS)
BS
2 BS
3
BS
i
BS B-1
BS B
xB,1
x1,B x1,2
x2,1
x3,1 x1,3
x2,3 x3,2
xi,3 x3,i xi,B-1
xB-1,i x1,B-1 xB-1,1
xB-1,B xB,B-1 xi,1
[image:9.612.74.274.232.392.2]x1,i
Fig. 5: Traffic flow approximation.
included and PV is used instead of using wind energy. The goal is to minimize on-grid consumption by balancing downlink traffic loads among the green SCBSs. The SCBSs update their state (on/off) every hour by changing the transmission power according to the amount of renewable energy available at their location. If the energy provided by a PV panel is more than the amount required for a given SCBS, it is stored in the battery. The stored energy is used when the energy produced by the PV panel is insufficient to power the SCBS. This is a particular relevant for the solar energy in comparison to the wind scenarios, which is more likely to be continuously available.
A mechanism based on traffic flows is considered to solve a linear optimization problem of load assignment at the BS. This perspective uses a relaxation of the discrete problem and generates a solution with the optimal flow exchanged between BSs. In this case, a flow is a real value representing an aggregation of users, in other words, the traffic load density of a BS in a time slot. This provides a solution with the optimal flows exchanged between BSs [44]. Fig. 5 presents an illustration of the system, where each node represents a base station and the variablexi,jis the flow sending from BS
i to BSj.
The mechanism uses input information from a matrix Fi,j
with the potential flows that can be exchanged between BSs in each time slot. This matrix is built from the active BSs
ac-cording to the renewable energy available, the SCBS capacity and the BS adjacency matrix. TheF matrix is a combination between the base station adjacency matrix and the information related to resource block availability in each of one of the BSs. This matrix is useful to define the maximum base station capacity, which in short-timescale would be equivalent to the constraint provided by the parameter UM
j . This BS capacity
information can be provided to the controller by collecting the data through the backhaul. The potential matrix flow and the available capacity in each BS are used as constraints of a linear optimization problem that minimizes the sum of flows from any base station to the MBS. The Fi,j matrix can be
described as follows:
Fi,j=
y1,1a1,1C1 . . . y1,ja1,jCj
..
. ... ...
yi,1ai,1C1 . . . yi,jai,jCj
(12)
whereyi,1=1 if BSjhas sufficient renewable energy to operate
in the time slot and yi,j=0 otherwise. Likewise, if ai,j=1 BS
i is adjacent to BSj, this means that a user served by BS i
can be transferred to BSj due to such an adjacency. Finally,
Cj is the number of resource blocks available to serve users
on the BSj in the time slot.
On the other hand, a MPC is an advanced computer-based control approach that uses a mathematical model to predict the system evolution and calculate its optimal inputs according to a cost function during a N step prediction horizon. At each time step, optimal inputs are calculated for the next N
time steps according to a cost function. The first component associated to the next incoming slot is obtained from the optimal input sequence and then applied. Any of the following
N−1remaining elements of the input sequence are discarded and therefore not used. This procedure can be depicted as a sliding window optimization process throughout the time, as the process is repeated at the next time step and so on [45]. In general, the MPC model can be written as:
x(k+ 1) =x(k) +u(k) +w(k) (13)
Fig. 6: MPC Scheme.
control actions are related with the flows to exchange load between BSs, and last but not least, the traffic and weather forecast are the disturbances. This type of modeling allows predicting future states of the system from an initial state
x(0)considering the effect of weather and traffic forecast. The MPC is based on the traffic flow scheme and incorporates a prediction horizon that allows it to take into account the forecast of the renewable energy source and the network characteristics in the decision-making process. The general scheme of the controller appears in the Fig. 6.
The MPC optimization problem is described in equations (14) - (17):
min
∀xi,j(k)
N−1
X
k=0
B
X
i=1
xi,1(k+ 1) (14)
s.t.
B
X
i=1
xi,j(k)≤Fi,j(k) j= 1, . . . , B, k= 0, . . . , N−1, (15)
B
X
j=1
xi,j(k) =xi(k) i= 1, . . . , B, k= 0, . . . , N−1, (16)
0≤xi,j(k) i= 1, . . . , B, j= 1, . . . , B, k= 0, . . . , N−1, (17)
where xi,j(k+ 1) is the traffic flow from BS i to BS j in
a future time slot of the prediction horizon. Eq. (14) is the objective function, which seeks to minimize the flows to the MBS (BS 1) and hence reduces the overall consumption from the grid of the cellular network. The constraint in Eq. (15) specifies that the flow between two BSs cannot exceed the limits established by the potential flows matrix. Constraint in Eq. (16) imposes flow conservation. It means that summations of flows cannot exceed the load of originating BS i. Finally, Eq. (17) defines that flows must be positive. Once the solution to this problem is found, a rounding process is executed to obtain integer values and assign users to BSs according to these values.
The solution of the optimization problem is a sequence of
N matrices X(k) ∈ ZB×B that define the flows exchanged between BSs and they minimize grid consumption along the prediction horizon
X(k) =
x1,1(k) x1,2(k) . . . x1,B(k)
..
. ... ... ...
xB,1(k) xB,2(k) . . . xB,B(k)
(18)
fork= 0, . . . , N−1. Only the components of the optimal ma-trix flowsX(0)are actually applied. The rest of the sequence is discarded. It is important to notice that the choice of the sizeN for the prediction horizon is fundamental.Nshould be large enough to provide enough visibility to the predictor for making a decision, however not too large asN could increase unnecessarily the computation process. Actually, there exists an optimal N which provides the best optimization solution. A valueNlarger than the optimal could introduce error due to the fact that obtained inputs based on far remote future entries of forecast information could introduce inaccuracies.
The MPC could be used for other types of renewable energy and not just PV. However, in order to exploit the energy management capabilities of this approach a storage system is required. The MPC implementation is not modeled based on individual UE-BS associations as we have done for short-timescale case. Our model here is based instead on BS traffic flows. This makes difficult to granularly deal with specific user quality requirements in the short-timescale. Notice that transitions depend on the capability of load balancing from one BS to another. This is represented by the matrixF, which determines if flows can be fully transferred or not. If the overall QoS requirements are increased, many of these paths would disappear and some UEs should stay in their original BSs which provide best transmission conditions but at a high energetic cost if the power comes from the grid. This brings a sort of trade-off between network capacity performance and energy efficiency as some QoS sacrifice should be done to reduce on-grid consumption. It must be noted that although MPC solution brings a long-time scale energy management still the network should require a reactive association approach in the short-time scale to respond to abrupt fluctuations and instantaneous UE requirements in the scenario.
For analysis of MPC proposal we have chosen the solar be-havior from the city of Medell´ın using the model as described in subsection III-A. Valle de Aburr´a, Medell´ın, Colombia, is very representative of Equatorial region (22◦C, 68% humid-ity). This region has been historically dominated by fuel based energy supply and hydroelectric systems. Although hydroelec-tric power is a renewable energy source, the construction of the dam structure and the energy central facilities may impact on the ecosystem, life species and social communities around [46]. Considering the favorable geographical conditions of Latin-America, renewable energies should be good choice for the continent strategical development.
VI. ANALYSIS OF THERESULTS
A. Analysis of green user-BS association mechanism (Short-timescale, Moscow City)
mentioned, the system at full deployment is composed by one on-grid MBS and several SCBSs. These SCBSs depend on the availability of renewable energy and can increase the cell size up to 200m (22dBm max). A number of 36 SCBS are required to completely cover the geographical area of 3.5km2. In addition, a pool of 1000 potential users is considered in the coverage area.
Firstly, the results throughout time are presented taking the small cell deployment at full capacity. In Fig. 7, a full 36 SCBSs deployment is depicted while the renewable energy conditions change in time. In the short-timescale, the temporal variability of traffic on the cellular network is not considered, and for this reason a simulation horizon of 1 hour (3600 time slots) is sufficient to evaluate the behavior of proposed association mechanism. The figure shows the contrast of the grid consumption for the best signal and green energy policy for the city of Moscow. A reduction in the grid consumption can be observed when a larger number of SCBSs become op-erationally active. Such an energy reduction is more effective for the implemented green association policy. It is noticeable that the strength of the presented green policy becomes more significant due to the high wind speed profiles of the city of Moscow. This makes it possible that a larger number of SCBSs can be active for a longer period, while offloading traffic load from the MBS, therefore reducing the on-grid power consumption.
0 5 10 15 20 25 30 35 40 45 50
1 6 11 16 21 26 31 36 41 46 51 56 2.0 2.5 3.0 3.5 4.0 4.5 5.0 5.5 6.0 6.5 7.0
Ac
ti
v
e
S
C
B
S
s
Time (minutes)
ki
lo
-Jo
u
le
s
MBS On-Grid Consumption
[image:11.612.330.540.51.211.2]Active SCBSs Signal Level Policy (kJ) Green Policy (kJ)
Fig. 7: Comparison of grid Consumption according to wind potential.
In these simulations, at the best wind conditions the full SCBS layer (36SCBSs) + MBS deployment can cover up to 90% of the users of the deployed pool. Now we conduct an analysis to observe the effect on capacity as we gradually change the number of SCBSs. This makes it possible to find the optimal deployment configuration where the downlink throughput is increased and on-grid consumption is effectively reduced. We effectuate this analysis for 4, 16 and finally 36 SCBSs full deployment.
As mentioned before, for the sake of comparison, two new association schemes were included, a discrete optimizer and a greedy algorithm. The simulation time is two hours with time slots of one second. Also in this case, the temporal variability of traffic is not considered as 2 hours is a still a short period of time where we may consider traffic as nearly constant. As
2.92
3.53
4.14
2.95
3.67
4.25
2.95
3.64 4.32
2.74 3.17
3.96
2.00 2.50 3.00 3.50 4.00 4.50 4 SCBS
16 SCBS 36 SCBS
Mbits/Joule Efficiency Metric
Signal Level Policy (Mbits/J) Green Policy (Mbits/J) Discrete Optimizer (Mbits/J) Greedy Algorithm (Mbits/J)
9.1%
14.8%
7.9% 283Mbps
291Mbps 303Mbps
276Mbps(-2.5%) 282Mbps(-2.9%) 294Mbps(-3.2%)
255Mbps(-9.9%) 272Mbps(-6.5%) 285Mbps(-5.9%)
[image:11.612.65.278.380.539.2]274Mbps(-3.2%) 280Mbps(-3.8%) 296Mbps(-2.3%)
Fig. 8:Mbits/JEnergy Efficiency Metric
mentioned previously in Fig. 7, thanks to the inclusion of the green SCBSs, we observe a significant reduction of the on-grid consumption, which is also observable in Table II for the different UE-BS association mechanisms. It can be seen that the discrete optimizer has the best energy savings for all cases, followed by the proposed Green Policy, which reduces the grid consumption up to 34% with respect to the case using MBS On-grid only. It is important to note that the greedy algorithm has a lower consumption than the best-signal level policy and slightly near than our proposed green policy. This greedy algorithm has an enhanced approach to the one of the pure best signal approach as it allows some optimization of the global resource allocation while still targets somehow the best signal to optimize the spectrum efficiency.
Due to the wind potential, Moscow city appears to be a good candidate to implement such kind of initiatives using wind energy. Notice that the on-grid energy is not reduced by the same amount as we increase the density of SCBSs. This means that including more SCBSs may not necessarily help to reduce proportionally the network consumption, but could actually lead to over-dimensioning, impacting both CAPEX/OPEX if the renewable energy resources or the amount of energy are insufficient to exploit the installed infrastructure. This can be a relevant criterion to be taken into account as a designer must choose the right density of small cells in function of the available resources.
Number of SCBS
Average Grid Consumption -Best Signal level
(kJ)
Savings Green Policy vs Best Signal level(%)
Savings Green Policy vs. On-Grid only Scenario(%)
Savings Discrete Optimizer vs. Best Signal level
(%)
Savings Discrete Optimizer vs. On-Grid only Scenario(%)
Savings Greedy Alg. vs. Best Signal level(%)
Savings Greedy Alg. vs On-Grid only Scenario
(%)
On Grid 380 - - -
-4 SCBS 374 9.6 11.1 16.6 17.9 10.4 11.8
16 SCBS 331 15.7 26.6 19.3 29.7 14.5 25.5
[image:12.612.54.567.51.122.2]36 SCBS 282 10.6 33.7 14.5 36.6 9.7 32.4
TABLE II: On-grid Energy Consumption reduction for each of the association schemes analyzed
figures. With respect to the greedy approach, we can see values are very tight in terms of throughput with respect to the green policy, which is also reflected in the resulting Mbits/J metric. Regarding the complexity, the solution for the optimization problem formulated in Eq. (6), i.e. discrete optimizer, leads to a exponential combinatorial number of possibilities. Regarding the computational time required for the simulations, Table III shows a comparison of the results of implementing the different association mechanisms with 36 SCBS and different number of users in the network. It can be observed that the optimizer increases its computational time notably when the number of users grows. With respect to the proposed green policy, we can observe lower computational time with respect to the discrete optimizer and the greedy scheme. Such time values remain practically constant despite the growth of users, thus representing a good option for improving consumption in scenarios with a large number of users.
User Association
Scheme 500 Users 750 Users 1000 Users Signal Level Policy 179.6 249.2 273.8
[image:12.612.78.272.372.426.2]Green Policy 236,8 297.1 318.6 Discrete Optimizer 1532.6 4385.7 7574.1 Greedy Algorithm 341.6 416.3 425.9
TABLE III: Computation Time for the Simulations[s]
Mechanism 2Mbps≥ri 2Mbps> ri≥1.2Mbps ri>1.2Mbps
Signal Level
Policy 1.9% 20.4% 77.7%
Green Policy 1.2% 15.1% 83.7%
Discrete
Optimizer 1.0% 13.7% 85.3%
Greedy
[image:12.612.56.294.461.532.2]Algorithm 1.1% 14.0% 84.9%
TABLE IV: Evaluation of User experience
In addition, we present an evaluation of the user experience from the UE throughput perspective. Given their reactive characteristics, it is relevant to analyze this here, as short-timescale algorithms are intended to respond to instantaneous UE requests. In Table. IV, we divide the UE throughput distribution in equidistant ranges taking into account that UE throughput for our simulations ranges from 600kbps to a little bit more than 2Mbps. The percentage of the population of UEs in each of theses ranges is shown. As observed, the best signal approach presents the best throughput levels. In contrast, we observe around approximately 5-7% degradation shift for the other mechanisms including our green association approach. Nevertheless, the green association presents a little bit less degradation than approaches like the discrete optimizer as our technique is able to find a better balance of signal level, while economizes on-grid energy. In contrast, the discrete optimizer
is absolutely aimed to maximize such energy reduction ne-glecting the quality of the UE-BS association.
These results show that renewable energies like wind are a feasible alternative to supply next generation cellular networks. However, it is important to mention that as seen in the results correct planning of the solution must be carried out to avoid over-provisioning or sub-utilization of the installed small cell infrastructure. On one hand, there exists some point where the density of the small cells may exceed the traffic demand without providing additional energy savings and therefore an optimal balance must be found. On the other hand, the success of using a green small cell deployment greatly depends on the availability of renewable energy to allow the operation of the deployed green SCBSs as in the case of Moscow which counts with high speed wind profiles.
B. MPC (Long-timescale, Medell´ın city)
The following analysis is extended from our work in [8]. The case study as mentioned earlier uses some solar behavior data from Medell´ın city. Our scenario is composed of one MBS and 8 overlapping SCBSs. In this case, each SCBS has a renewable energy storage system. In contrast to the short-timescale case, the temporal variability of traffic on the cellular network is considered in this case. The time slot granularity corresponds to 1 hour in order to observe the behavior of the proposed solutions over 10 days, including traffic patterns for weekdays and the weekend. For displaying the results we concentrate on a window of 72 hours, one day during the weekend and two weekdays, as the traffic patterns only differ significantly during this transition. The MPC target is to manage the renewable energy available and optimize its use according to the storage capacity and the weather and consumption forecasts.
To evaluate the performance of the MPC, several predic-tion horizons (N) were used. Table V shows a performance comparison between a reactive flow optimizer strategy (N=1) and the best MPC horizon. It can be observed that both mechanisms reduce the average grid consumption, but MPC provides greater reductions. The best response of the MPC corresponds to N=5, where the lowest on-grid consumption is obtained. This horizon size makes it possible to make the most accurate decisions based on the forecasts. A higher N could result in an error due to including estimations of far remote future slots. The power grid consumption saved with MPC is 22 kJ compared to the baseline scenario (On-grid energy only) which represents 13% savings.
Mechanism Avg. Grid Consumption
(kJ) Savings (%)
On-grid energy only 168
-Reactive flow optimizer (N=1) 152 9.5
MPC (N=2) 150 10.7
MPC (N=5) 146 13.1
MPC (N=6) 147 12.5
[image:13.612.50.300.53.121.2]MPC (N=9) 149 11.3
TABLE V: MPC Performance Comparison
(a)
(b)
Fig. 9: a) Long-timescale grid consumption b) Stored Energy Pattern Behavior
horizon of MPC is set to 5 hours. It can be observed that for both schemes, reactive flow optimizer and MPC, it is possible to reduce the grid consumption in the network and take advantage of the renewable energy available. However, it is remarkable that in some periods the MPC makes the decision to use grid energy even when renewable energy is available. Here, it is important to note that MPC uses weather and traffic forecast, to decide when is better to use renewable energy and when to store it with the target of reducing overall grid consumption. It means that the predictive strategy with its far-sighted solution, allows the storage of renewable energy for use during periods of high traffic load where such energy is not available. This makes it possible to boost the SCBSs autonomy, while the association can be refined by a reactive green Association technique in the short-timescale for better response to instantaneous UE requirement needs.
An important design decision during the planning process is to determine the energy storage capacity of the batteries. Fig. 10 shows the grid consumption behavior with different levels of storage capacity. It is possible to observe that by increasing storage capacity up to 70W-h at each SCBS, it reduces grid consumption up to 22%. Increasing the capacity more does not improve grid consumption savings, since there exists a minimal idle power consumption for the MBS required to guarantee coverage. In addition, we can observe that for other schemes like flow optimizer or the case where prediction window is set to N=2, the required optimal storage capacities
needed actually is higher as a result of not being capable to fully exploit the prediction knowledge in the decision making process and being more prone to allocate renewable energy in the current time slots.
0 20 40 60 80 100 120 140 160
Energy Storage Capacity (Wh)
100 110 120 130 140
Storage Capacity Behaviour
Flow Optimization MPC(N=2) MPC(N=5)
A
v
g.
O
n
-G
ri
d
C
o
n
su
m
pti
on
(
k
J)
On-grid Only Comsumption=168kJ
Fig. 10: Average Grid Consumption vs Energy Storage Capacity.
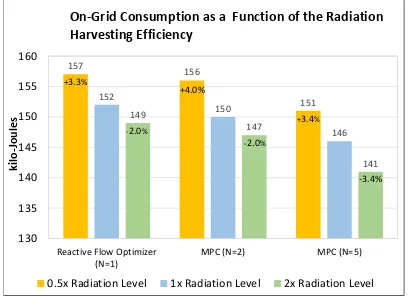
Finally, we provide an analysis of the radiation harvesting efficiency and its impact on the on-grid energy reduction in Fig. 11. This change of the efficiency is just a illustrative way to understand what happens when the renewable energy availability increases. We notice how when reduce the effi-ciency to 50% the attained savings are reduced around 3-4% with respect to 1.0× efficiency, whereas when we increase the radiation harvesting efficiency by 2 times, the enhancement could be just around 2% (N=1, N=2) and maximum up to 3.4% (N=5). It is interesting to notice that the changes on the on-grid consumption are not strictly proportional to the changes on the harvesting efficiency. The reason is that there are other network constraints like the radio resource and storage capacities, as well as the SCBS neighbor availability in the surroundings that could limit the load redistribution. These elements are fundamental for a correct dimensioning of the small cell radio access network infrastructure.
We have observed how the MPC approach provides an effi-cient way of managing energy over long-timescale, in contrast with the short-timescale association algorithm that is intended to address rapid decisions to respond to the fluctuations of a renewable energy sources. MPC in combination with a storage system is a robust and efficient solution when the environmental conditions slowly change and planning based on a forecast is possible. This approach matches well with
157
156
151 152
150
146 149
147
141
130 135 140 145 150 155 160
Reactive Flow Optimizer (N=1)
MPC (N=2) MPC (N=5)
On-Grid Consumption as a Function of the Radiation Harvesting Efficiency
0.5x Radiation Level 1x Radiation Level 2x Radiation Level +3.3%
-2.0%
-2.0% +4.0%
-3.4% +3.4%
ki
lo
-Jo
u
le
[image:13.612.61.284.72.386.2]s
[image:13.612.334.539.117.214.2] [image:13.612.333.538.572.720.2]the behavior of solar radiation in the daytime period and the correct utilization of storage infrastructure.
C. Comparison of Reactive and Proactive strategies in a
common scenario and synthesis toward a joint approach
To evaluate the performance of the proposed mechanisms, a new scenario with spatial and temporal traffic variability is considered. To include the temporal variability of traffic, three different arrival rates per area unit λ(x)are used along the simulation horizon. The prediction horizon is N = 5, the number of users set to 1000 and the renewable source used is wind. The deployment consists of 8 SCBSs and one MBS, where each SCBS has a battery with 30 W of capacity, fully charged at t= 0.
0 0.1 0.2 0.3 0.4 0.5 0.6 0.7 0.8 0.9 1
N
o
rma
lize
d
B
S
L
o
a
d
10 20 30 40 50 a)
0 0.1 0.2 0.3 0.4 0.5 0.6 0.7 0.8 0.9 1
10 20 30 40 50 b)
0 0.1 0.2 0.3 0.4 0.5 0.6 0.7 0.8 0.9 1
[image:14.612.350.527.180.313.2]10 20 30 40 50 c)
Fig. 12: Normalized MBS (blue) and SCBS load(red). (a) Traditional scheme. (b) Green Policy (c) MPC scheme (N=5). On grid Consumption:a)165.3kJ, b) 138.7kJ c) 123.8kJ.
In Fig. 12, the normalized load MBS after offloading is presented with (a) the traditional signal level policy, (b) with the green policy and last but not least, (c) with the MPC scheme. It is possible to notice that the MPC scheme reduce the grid consumption up to 25% compared with best signal level policy. On the other hand, if we compare the short time scale green policy vs. the MPC approach, we notice that MPC exhibits a clear advantage of performance by reducing the on-grid consumption by 10% with respect to the green policy. MPC optimizes the battery capacity of SCBSs by using information about the weather and traffic forecasts. It is important also to note that with MPC the average load of the SCBSs changes from 17% to 43% when compared with best signal case, showing a better utilization of the available infrastructure by means of load balancing.
In the previous scenario, we have used the proactive capa-bilities of MPC to outperform Green Association assuming a very granular forecast resolution in the order of minutes. MPC could potentially be applied in these kind of scenarios but the accuracy of the prediction must be guaranteed with a good time resolution which is difficult. We can actually notice that reactive and proactive approaches are complementary to each other instead of competitors. In large regions with different kind of geography, we can imagine a two-layer scheme, where an upper management layer operating with a wide view of the system is responsible for the deployment of optimal energy planning strategies by deciding on the evolution of the network and the best options depending on the geography and renewable resources available. On the other hand, a physical layer of customized deployed infrastructure where proactive and reactive mechanisms can be used depending on the particular characteristics of each geographical environment, implementation and financial aspects, i.e. CAPEX/OPEX. If
[image:14.612.48.306.240.321.2]we consider a combined approach as in a hierarchical ar-chitecture, the proactive mechanism could exploit the long-timescale dynamics of energy renewable sources while the reactive green mechanism can deal with rapid fluctuations or changes in the scenario. This means that while the long-term knowledge makes it possible to optimize the energy autonomy of SCBSs, the short-time scale is more suitable for responding to specific UE requirements at lower time granularity. This idea is illustrated in Fig. 13.
Fig. 13: Energy management & Planning Architecture
VII. CONCLUSION
Two different energy management schemes for HetNets powered by hybrid energy sources were presented. First of all, a reactive UE-BS association scheme operating over the short-time scale was proposed. The idea of this association policy is to prioritize renewable energy consumption over grid electricity consumption by preferring BS nodes powered by renewable power. The green policy has shown good perspec-tives of implementation due to its low complexity, high energy efficiency and low degradation in terms of the user experi-ence. In addition, a proactive MPC scheme has been studied for a long-timescale case to minimize grid consumption by implementing a traffic flow strategy. It is shown how the MPC based scheme results in low grid energy consumption by providing an energy management storage framework. Finally, it is important to note that the proposed green policy and MPC could be combined in a hierarchical control scheme over the same network applied to specific situations where their reactive and proactive capabilities are complementary to each other and can be even jointly exploited.
ACKNOWLEDGMENT
We would like to thank the Colombian Institute COLCIEN-CIAS for the Ph.D. research grant No. 6172 and also the Spanish MEC (project ref. DPI2017-86918-R) for the financial support provided.
REFERENCES
[1] Cisco, “Cisco Visual Networking Index: Global Mobile Data Traffic Forecast Update, 2016-2021,” 2017.


![TABLE III: Computation Time for the Simulations[s]](https://thumb-us.123doks.com/thumbv2/123dok_us/1962839.157007/12.612.78.272.372.426/table-iii-computation-time-for-the-simulations-s.webp)