Measurement development.
White Rose Research Online URL for this paper: http://eprints.whiterose.ac.uk/118142/
Version: Accepted Version
Article:
Boon-itt, S, Wong, CY orcid.org/0000-0002-4933-1770 and Wong, CWY (2017) Service supply chain management process capabilities: Measurement development. International Journal of Production Economics, 193. pp. 1-11. ISSN 0925-5273
https://doi.org/10.1016/j.ijpe.2017.06.024
© 2017 Elsevier B.V. This manuscript version is made available under the CC-BY-NC-ND 4.0 license http://creativecommons.org/licenses/by-nc-nd/4.0/
eprints@whiterose.ac.uk https://eprints.whiterose.ac.uk/ Reuse
Items deposited in White Rose Research Online are protected by copyright, with all rights reserved unless indicated otherwise. They may be downloaded and/or printed for private study, or other acts as permitted by national copyright laws. The publisher or other rights holders may allow further reproduction and re-use of the full text version. This is indicated by the licence information on the White Rose Research Online record for the item.
Takedown
If you consider content in White Rose Research Online to be in breach of UK law, please notify us by
Accepted Manuscript
Service supply chain management process capabilities: Measurement development Sakun Boon-itt, Chee Yew Wong, Christina W.Y. Wong
PII: S0925-5273(17)30197-4 DOI: 10.1016/j.ijpe.2017.06.024
Reference: PROECO 6747
To appear in: International Journal of Production Economics
Received Date: 30 May 2016 Revised Date: 15 June 2017 Accepted Date: 17 June 2017
Please cite this article as: Boon-itt, S., Wong, C.Y., Wong, C.W.Y., Service supply chain management process capabilities: Measurement development, International Journal of Production Economics (2017), doi: 10.1016/j.ijpe.2017.06.024.
M
A
N
U
S
C
R
IP
T
A
C
C
E
P
T
E
D
Service supply chain management process capabilities:
Measurement development
Dr. Sakun Boon-itt, Thammasat Business School E-mail: sboonitt@tu.ac.th
M
A
N
U
S
C
R
IP
T
A
C
C
E
P
T
E
D
Service supply chain management process capabilities:
Measurement development
Abstract
The role of supply chain management processes in achieving competitive advantages in the
service industry has been widely discussed. However, due to the lack of valid measurement
scales, the effects of service supply chain management (SSCM) process capability cannot be
ascertained. This study aims to develop and validate measurement scales for SSCM process
capability constructs. The measurement scales were initially developed by literature review,
and refined by Q-sort method. The SSCM process capability is a seven-dimensional
construct; each dimension consists of a collection of unidimensional multi-item scales.
Confirmatory factor analyses of a large-scale survey confirmed the unidimensionality,
reliability, and validity of the multidimensional construct of seven SSCM process
capabilities. The validated measurement scales lay a crucial foundation for advancing
knowledge of the service supply chain by enabling future empirical studies in the field, which
previously relied on largely conceptual frameworks and descriptive accounts of SSCM
processes.
Keywords: Service supply chain; process capability; scale development; empirical
M
A
N
U
S
C
R
IP
T
A
C
C
E
P
T
E
D
1. IntroductionToday, service sectors significantly contribute, with a range of 30.4% to 87.2%, to the
gross domestic productivity (GDP) across countries of both post-industrialized and emerging
economies (World Bank, 2015). It is therefore essential to understand how service firms
compete (Schmenner, 1986). Service firms may compete on process capabilities (Roth and
Jackson, 1995) because the intrinsic potential resources that enhance customer satisfaction
and loyalty (Parasuraman et al., 1991; Prokesch, 1995) can be realized through service
delivery processes (Ray et al., 2004). An enhanced understanding of service processes is
thought to improve firm performance (Mattsson, 1994; Edvardsson 1997; Boyer et al., 2012).
So far, the management literature has examined firm-level process capabilities such as
customer contact/service (Kellogg and Chase, 1995; Ray et al., 2004), technology-mediated
process-based customer service experience (Froehle and Roth, 2004) and service
development competence (Menor and Roth, 2007) for explaining service firms’
competitiveness and profitability (Heskett et al., 1994). Beyond firm boundaries, recent
evidence has revealed the value of various inter-organizational process capabilities in the
service sectors (Gobbi and Hsuan, 2015; Giannakis, 2010; Sampson and Spring, 2012; Tang
and Rai, 2012; Zhang et al., 2011). This development justifies new efforts to unpack service
supply chain management (SSCM) processes. However, the current understanding of SSCM
processes is limited by the availability of several conceptual definitions (e.g., Ellram et al.,
2004; Baltacioglu et al., 2007; Breidbach et al., 2015) and anecdotal evidence (e.g.,
Giannakis, 2010; Sampson and Spring, 2012), short of appropriate construct measurement
scales (Chen and Paulraj, 2004) with sound psychometric properties (Venkatraman, 1989;
Cho et al., 2012; Chan et al., 2016). No effort has been made to formally develop a valid
SSCM process capability measurement scale, leading to the inability of the field to further
M
A
N
U
S
C
R
IP
T
A
C
C
E
P
T
E
D
This paper addresses this crucial gap by theoretically develops and empirically validates
new measurement scales for SSCM process capabilities. SSCM is defined as “the
management of information, processes, resources and service performance from the earliest
supplier to the ultimate customer” (Baltacioglu et al., 2007, p. 112). Drawing from the
competence-based view (Prahalad and Hamel, 1990), competence is defined as “a bundle of
aptitudes, skills, and technologies that the firm performs better than its competitors, that is
difficult to imitate and provides an advantage in the marketplace” (Coates and McDermott,
2002: p. 436). The goal of the SSCM process is to transform heterogeneous resources into
competitive service offerings. SSCM process capability is built up of several core
competencies necessary for “coordinating diverse production skills and integrate multiple
streams of technologies” (Prahalad and Hamel, 1990: p. 4). We thus view SSCM processes as
a structured set of competencies that constitute proactive, relational, coordinative (Sarkar et
al., 2009) people and technology dimensions desired to deliver specific service offerings.
The measurement scales for seven SSCM process capabilities were developed by a
reconciliation of SSCM process literature (e.g., Baltacioglu et al., 2007; Ellram et al., 2004;
Sengupta et al., 2006; Sampson and Spring, 2012). To identify processes relevant to service
settings, structural and managerial differences between service and manufacturing supply
chains (Sampson and Spring, 2012; Zhou et al., 2009) are seriously considered, in line with
the Unified Service Theory (UST). UST provides a framework to conceptualize service
operations management and unequivocally differentiate between service and manufacturing
operations issues. UST also recognizes the bidirectional nature of service supply chains
where customers may provide resources and labor or act as production managers (Sampson
and Froehle, 2006; Sampson and Spring, 2012). We incorporated features unique to service
sectors, including customer-supplier duality, service quality heterogeneity, intangibility
M
A
N
U
S
C
R
IP
T
A
C
C
E
P
T
E
D
2006; Ellram et al., 2004; Boon-itt 2009). Interviews with managers from different service
sectors were conducted to improve face validity. A two-step research design with Q-sort and
mass survey was implemented to empirically validate the measurement scales. The
empirically validated measurement scales for SSCM process capability enable future
empirical investigations of SSCM performance and benchmarking of the SSCM process in
practice.
2. Conceptual Background 2.1 Theoretical foundation
Generally, business process has been perceived as a structured set of activities for
achieving specified business outcomes (Davenport and Beers, 1995). Its potent effects on
service quality and market performance have been recognized (Roth and Jackson, 1995).
SSCM processes that are path dependent, socially complex, and casually ambiguous may lead
to competitive advantage, according to the competence-based view (Coates and McDermott,
2002; Prahalad and Hamel, 1990). Thus, we view SSCM from a process capability (Zacharia
et al., 2011) and competency perspective (Coates and McDermott, 2002). It is a higher order
of resources than the deployment of physical resources because service is less tangible
(Gorman and Thomas, 1997), context-dependent, and hard to imitate (Ray et al., 2004; Karia
and Wong, 2012).
As the foundational core of the Unified Service Theory (UST), service supply chain
management (SSCM) processes are different from those of a product supply chain in various
aspects. For instance, the distinctive feature of the SSCM is based on customer-supplier
duality. In UST, the customer provides some inputs to the transformation process in order to
produce the service (Sengupta et al., 2006; Sampson and Froehle, 2006). In UST,
M
A
N
U
S
C
R
IP
T
A
C
C
E
P
T
E
D
such as manufacturing flow management in manufacturing supply chain are not suitable for
SSCM. Simultaneity, heterogeneity and perishable are features of service industry
highlighted by UST. Simultaneity refers that customers must be present to provide the
service. The heterogeneity characteristic of service reflects the fact that service
standardization is not easy. For this reason, the service providers cannot easily predict the
pattern of the demand for a particular period or specific item. Services are also perishable
(Sullivan, 1982). If a service is not consumed when available, then there is no chance to stock
it for future use (Ellram et al., 2004). Unused capacity is lost forever. All these reasons make
the SSCM more dynamic and sophisticated in terms of the supply chain management process.
It requires a different approach and framework to implement SCM in the service industry.
We define SSCM process capabilities as the competency of an organization in
performing a bundle of activities required to manage its service supply chains. Such process
capabilities are concerned with organizing and managing inputs, outputs, and combinations
of processes (Coates and McDermott, 2002). According to the competence-based view
theory, service operations require effective management of skills and knowledge or
deployment of different people (capacity), resources (Amit and Schoemaker, 1993),
activities, and organizational routines through complex interactions with suppliers and
customers to create competitive advantage (Peng et al., 2008; Sampson and Spring, 2012).
SSCM processes are intra- and inter-organizational in nature and therefore it is important to
incorporate proactive, relational, and coordination attributes into the processes (Sarkar et al.,
2004).
To enable a wider application of the SSCM process capability conceptualization, we
ensure that the processes fit with most service settings. We first reviewed literature on
manufacturing supply chains that has identified eight SCM processes (Croxton et al., 2001;
M
A
N
U
S
C
R
IP
T
A
C
C
E
P
T
E
D
of the Global Supply Chain Forum (GSCF). We scrutinized the GSCF process model based
on a bottom-up approach to extract SSCM activities relevant to service sectors (Baltacioglu et
al., 2007). For example, some service firms offer physical goods and therefore experience
procurement processes and returns similar to manufacturers’ (Zhou et al., 2009). Also, some
procedures in delivery services can be quite tangible when physical flows are involved
(MacCarthy and Wilson, 2001; Wong et al., 2013). Finally, we incorporated some of the
common processes related to the management of demand, capacity, supplier and customer
relationships, order fulfillment and customer service. However, due to heterogeneity in
quality expectations (Ellram et al., 2004), not all service processes can be managed using
quantitative control methods as in the manufacturing sectors (Kotz and Johnson, 2002;
Puga-Leal and Pereira, 2007; Besseris, 2014). Thus, Unified Service Theory (UST) is used to
incorporate customers’ contributions as providers of labor and inputs (Maull et al., 2012;
Sampson and Froehle, 2006; Sampson and Spring, 2012).
2.2 SSCM process capability dimensions and scales
Several attempts have been made by the existing literature to identify SSCM processes
(e.g. Ellram et al., 2004; Baltacioglu et al., 2007; Breidbach et al., 2015; Wang et al., 2015;
Aitken et al., 2016). Here we extend their efforts by suggesting that SSCM process capability
can be measured in terms of seven major dimensions, namely (1) demand management (DM),
(2) capacity and resource management (CAP), (3) customer relationship management (CRM),
(4) supplier relationship management (SRM), (5) order process management (ORM), (6)
service performance management (SPM), and (7) information and technology management
(ITM).
In essence, several manufacturing-related SCM processes are eliminated. The
manufacturing flow and returns management processes tailored for manufacturing sectors are
M
A
N
U
S
C
R
IP
T
A
C
C
E
P
T
E
D
physical and returning flows of products in some service settings (Ellram et al., 2004;
Rexhausen et al., 2012). Order fulfillment and customer service management from a
manufacturing context are replaced by order process management (ORM) and service
performance management (SPM), recognizing the importance of understanding each
customer’s unique needs, their diverse roles (Sampson and Spring, 2012) and the
management of the service delivery performance (Ellram et al., 2004; Baltacioglu et al.,
2007). Product development and commercialization are more related to the design and
commercialization of new parts and products, which are not the main concerns for service
supply chains. Instead, information and technology management (ITM) is recognized as a key
process because of the importance of information-enabled and technology-mediated service
experiences (Froehle and Roth, 2004).
Demand management process capability (DM)
The management of service delivery is tricky because demand can be heterogeneous and
volatile (Ellram et al., 2004; Klassen and Rohleder, 2001; Lun et al..2013), and services
cannot be inventoried (Ellram et al., 2004). Demand management process (DM) capability is
defined as the competence in managing and balancing customer demand by using up-to-date
demand information (Klassen and Rohleder, 2001) for accurate demand forecasting and
service delivery (Berry et al., 1979; Mabert, 1982). This includes the abilities to apply
accurate service demand information to forecast, allocate, and plan resources reliably
(Handfield and Nichols, 1999; Klassen and Rohleder, 2001; Liu et al., 2016), control demand
by influencing the magnitude of its peaks and troughs against planned capacity (Crandall and
Markland, 1996), proactively stimulate demand (Ellram et al., 2004; Cho et al., 2012) and
adjust supply or match demand with capacity at an operations level (Klassen and Rohleder,
2001; LaGanga, 2011) given the fact that it is not able to store capacity in the form of
M
A
N
U
S
C
R
IP
T
A
C
C
E
P
T
E
D
Capacity and resource management process capability (CAP)
Service capacity is the highest quantity of output possible in a given time period with a
predefined level of staffing and resources (Lovelock, 1992). Since service demand is
heterogeneous and services are produced and consumed simultaneously (Sullivan, 1982),
service firms need to constantly update capacity and resource information (Baltacioglu et al.,
2007; Klassen and Rohleder, 2001). CAP capability encompasses service capacity planning,
customer job scheduling, workforce scheduling, and facilities and equipment (e.g., vehicles)
scheduling for some services (Mabert, 1982). It is a competence in managing resources and
service capacity to meet demand with an optimum service capacity (Baltacioglu et al., 2007;
Cho et al., 2012; Wen et al., 2016). This includes the ability to identify and manage tangible
resources, such as facilities, labor, inventory and capital as well as intangible resources, such
as skills, experience, and knowledge (Froehle and Roth, 2007; Kellogg and Nie, 1995;
Moeller, 2010). While Ellram et al. (2004) use the term “capacity and skills,” we have added
“resource” to consider both tangible and intangible resources to address the unique features in
service sectors in terms of labor intensity, multiple customer roles, and skillfulness of
workers (Froehle and Roth, 2004; Verma and Young, 2000; Yee et al., 2008; Sampson and
Spring, 2012).
Owing to the perishability of service capacity (Sullivan, 1982) and heterogeneity of
service demand (Ellram et al., 2004; Klassen and Rohleder, 2001), there is often inadequate
information to define available capacity (Akkermans and Voss, 2013; Baltacioglu et al.,
2007). Therefore, CAP is a unique competence in defining and constantly tracking the
available capacity to meet varying demand (Browne, 1995; Ellram et al., 2004; Mabert, 1986;
Klassen and Rohleder, 2001) by adjusting service capacity (Ng et al., 1999; Schmenner,
1986). This unique capability helps increase the utilization of capacity (Sampson and Froehle,
M
A
N
U
S
C
R
IP
T
A
C
C
E
P
T
E
D
Customer relationship management process capability (CRM)
Customer contact and relationships in service supply chains help to understand the service
needs of individual customers (Chase, 1978; Ross and Edvardsson, 2008; Cho et al., 2012).
Since every customer is different, a good understanding of customer needs is required for the
effective management of demand and capacity (Ellram et al., 2004) and maintenance of
customer loyalty and retention. CRM process capability is a competence in maintaining and
developing long-term customer relationships through such means as adopting customer
information systems and understanding customer needs (Campbell, 2003; Wilson et al., 2002;
Yang, 2012). CRM helps improve customer satisfaction via a focus in meeting customer
needs (Bitner, 1995; Srivastava et al., 1999) at corporate and operational levels (Zeithaml and
Bitner, 2003). To manage customer expectations, CRM helps communicate optimistic
information to customers, enhance opportunities to use data and information to co-create
value with customers, and improve customers’ satisfactory on service quality (Baltacioglu et
al., 2007; Berry et al., 1985; Oflac et al., 2012; Zolkiewski et al., 2007). CRM helps
customers providing input, service specification, materials, and labor to the service delivery
process (Sampson and Spring, 2012). By communicating with customers before and after
service delivery they would have a good impression of the services and tendency to maintain
long-term relationships (Kandampully, 1988).
Supplier relationship management process capability (SRM)
The relationship management literature suggests that firms establish inter-organizational
process capabilities to accomplish strategic goals and remain competitive (Doran et al., 2005;
Theoharakis et al., 2009; Chen et al., 2013; Vanpoucke et al., 2014). SRM process capability
is a competence to develop, manage and maintain a close and long-term relationship with
suppliers. SRM provides a platform for service firms to interact with suppliers (Chopra and
M
A
N
U
S
C
R
IP
T
A
C
C
E
P
T
E
D
is the core process as their main business is to source goods and services from suppliers
(Baltacioglu et al., 2007). At the operational level, SRM is a key process that supports the
planning and coordination of purchases, buffer stock, capacity and the resource and order
management process (Mabert, 1982). It also supports the establishment of service-level
agreements essential for the management of service performance (Ellram et al., 2004).
SRM process capability has been conceptualized from different perspectives in previous
studies. For example, it is argued that SRM comprises five key components, namely
coordination, cooperation, commitment, information sharing, and feedback (Carr and
Pearson, 2002; Fynes et al., 2005). From a relational capability perspective (Theoharakis et
al., 2009), SRM is about building long-term relationships with suppliers (Griffith et al.,
2006). From a process capability perspective, it coordinates service development, sourcing,
supply planning, and procurement across the value chain (Lang et al., 2002). SRM develops
and maintains boundary-spanning activities with selected suppliers (Doran et al., 2005; Likert
and Choi, 2004; Zhang et al., 2011) to build suppliers’ trust (Zhang et al., 2011). To improve
suppliers’ service quality, service firms build good relationships with key suppliers (Zhang et
al., 2011) via the development of partnership programs (Likert and Choi, 2004; Monczka and
Morgan, 1997).
Order process management process capability (OPM)
Order processing includes getting service orders from customers, checking the status of
service orders and communicating to customers about the status, and fulfilling them (Lambert
et al., 1998). Service order processing may involve order preparation, order transmittal, order
entry, order filling, and order status reporting (Croxton, 2003). However, getting service
orders from customers is different from getting product orders in manufacturing settings.
M
A
N
U
S
C
R
IP
T
A
C
C
E
P
T
E
D
or catalogs, manufacturing goods are often produced before a customer makes an order, but
services are made after an order is made. Manufacturers often define their product
specifications with no or limited customization options. However, in a service setting,
customer clarifies their expectations and may request modification to ‘standard’ services
when placing an order. The understanding of customers’ service needs is a more delicate
process because service needs cannot be fully described by standard menus or catalogs
(Metters and Marucheck, 2007; Moeller, 2010). Service needs must be carefully
communicated, clarified, and processed such that service providers fully understand the needs
of each customer (Davis-Sramek et al., 2008; Fabien, 2005) and the customers understand
exactly what they are getting (Virki and Wong, 2003). Service level agreements are not able
to cover all implicit aspects (Ellram et al., 2004). Therefore, there is a need to continuously
communicate customer needs and expectations of services.
We have specifically included OPM process capability as a key capability for SSCM.
Adapted from Baltacioglu et al. (2007), OPM has a larger scope than the service delivery
management process identified by Ellram et al. (2004), which focuses on making promises to
customers and enabling service providers to meet these promises. The scope of OPM includes
getting orders through to delivering the service to customers (Lambert et al., 1998; Lovelock
and Wirtz, 2006). From a competence-based view perspective, OPM process capability
includes the ability of firms to communicate customer orders step-by-step and correctly
(Virki and Wong, 2003) and then effectively allocate customer orders to appointment or
reservation systems (Mondschein and Weintraub, 2003). OPM process capability also
requires a focus on customer expectations or psychological needs during order processing
through interactions with customers (Chung-Herrera, 2007).
M
A
N
U
S
C
R
IP
T
A
C
C
E
P
T
E
D
SPM process capability is the ability to manage and improve the performance of services
processes (Baltacioglu et al., 2007). It is important because service quality is a comparison
between expectation and performance (Heskett et al., 1985). While Ellram et al. (2004)
consider service performance as a part of the service delivery management process, we
distinguish OPM from SPM (Baltacioglu et al., 2007). Service delivery performance can be
measured instantly while the service is being delivered. It is a multidimensional construct that
should be measured independently. For this, we refer to another similar construct known as
service quality management, which involves the use of coordinated marketing and operations
service-related information to improve management decision-making and help gain
competitive advantage (Collier, 1991). It also includes managing, measuring, modifying, and
rewarding service performance to improve performance and meet customer expectations
(Williams and Visser, 2002).
We argue that SPM process capability could be manifested in several aspects. First,
service firms with such capabilities would have a good track record of service performance to
remain competitive and profitable (Heskett et al., 1994). Next, they would have the ability to
maintain consistency in service quality and reliability of the service process (Ellram et al.,
2004; Parasuraman et al., 1991). It also includes the ability to provide services to the right
customer, in the right place, and at the right time (Caruana and Pitt, 1997), improve service
quality and fulfill customer requirements (Mattsson, 1994; Boyer et al., 2012).
Information and technology management process capability (ITM)
The management of information flow is an important SSCM process because it helps
identify demand, share information, establish expectations, define the scope of service and
the skills required of service providers, and provide feedback on performance (Ellram et al.,
2004; Ruggles, 2005). From the information-processing theory, information reduces the
M
A
N
U
S
C
R
IP
T
A
C
C
E
P
T
E
D
a critical issue facing the service industry. To reduce uncertainty, service staff need to gather,
manipulate, store, retrieve, and classify recorded information but their information processing
and memory capacity is somewhat limited. The uncertainty facing service firms (Sullivan,
1982) can be masked by adequate information-processing capabilities (Castrogiovanni and
Macy, 1990) provide by information technology. In service settings, information technology
adoption helps process customer and service performance information (Froehle and Roth,
2004; Boon-itt and Wong, 2011) and share quality information with service staff. Quality
information can be created by effective management of IT, and therefore ITM is a crucial
SSCM competency. ITM supports coordination and collaboration within the supply chain to
improve service operations (Sander and Premus, 2002). In the service environment, ITM may
enhance operational efficiency and effectiveness on a real-time basis (Hayes and Thies,
1991).
We define ITM process capability as the competence in adopting information technology
and systems that support SSCM processes. We view ITM process capability as a
technology-enabled process capability that provides an effective flow of information for DM, capacity
and resource management, CRM, SRM, and OPM (Baltacioglu et al., 2007). From a
competence-based perspective, ITM process capability is the process in which information
technology is utilized to generate and share information in assisting decision making (Ray et
al., 2005). ITM process capability is, therefore, a crucial enabler of key functions in using
up-to-date information to make decisions. ITM extends the information flow from a service firm
to its suppliers and customers to facilitate inter-organizational information sharing
M
A
N
U
S
C
R
IP
T
A
C
C
E
P
T
E
D
3. Development and validation of measurement scales and scales
Following prior operations management studies (e.g., Li et al., 2005; O’Leary-Kelly and
Vokurka, 1998; Swafford et al., 2006; Lu et al., 2012), we performed a two-stage approach
for developing and validating the SSCM multi-item measurement scales as follows.
3.1 Stage 1: Item generation and pre-testing
Measurement scales were generated and pre-tested in three steps (Schwab, 1980). First,
measurement scales were initially generated through an extensive literature review to
conceptualize the constructs based on sound theories comprehensively (Churchill, 1979;
MacKenzie et al., 2011). The literature was searched from academic databases including
Science Direct, Emerald, Springer-Link Journals, IEEE Xplore, Academic Search Premier,
and World Scientific Net using keywords “supply chain”, “logistics”, “service,” “operations,”
and “management”. As shown in Appendix A (the supplementary document), constructs were
defined and their respective dimensions were identified based on the construct definitions.
The measurement scales were derived from the extant empirical studies of SSCM processes
(e.g., Baltacioglu et al., 2007; Ellram et al., 2004) grounded in the Competence-based view to
reflect the focus on process capability and Unified Service Theory (UST) to reflect the
bidirectional nature of service supply chains (Sampson and Spring, 2012).
Second, to ensure the practical relevance of the measurement scales, we refined the
domain of SSCM process capabilities by using a series of interviews. We interviewed 15
practitioners from low and high contact service sectors, such as banking, insurance, logistics
and transportation, and healthcare to identify each SSCM process capability. We discussed
the initial SSCM process capability dimensions and scales established from the literature
review. Based on the responses from these practitioners, all the dimensions and scales
established based on the literature review, including those proposed by Baltacioglu et al.
M
A
N
U
S
C
R
IP
T
A
C
C
E
P
T
E
D
to reflect SSCM process capability. New scales were added wherever deemed necessary. In
addition, redundant and ambiguous scales were either modified or eliminated. This step
enabled us to generate an initial set of scales for each SSCM process capability, which were
further reviewed by four academicians specialized in service operations management and
SCM. Finally, 46 initial scales were identified (Appendix A).
Third, we sorted scales using four rounds of Q-sort procedures with two independent
judges; each round was used to assess initial construct validity and the reliability of the
measurement scales. This method requires experts to act as judges and sort the scales into
several groups, with each group corresponding to a factor or dimension (Moore and
Benbasat, 1991). Three evaluation indices are used: (1) inter-judge agreement, (2) Cohen’s
Kappa, and (3) Moore and Benbasat’s average placement ratio (Moore and Benbasat, 1991).
Agreement between the judges represents face validity and placement of scales to theoretical
constructs represents content validity (Moore and Benbasat, 1991). According to Li et al.
(2005), Cohen’s Kappa measures the ‘proportion of joint judgment in which there is an
agreement after chance agreement is excluded’. A Cohen’s Kappa score greater than 0.70
(Jarvenpaa, 1989; Li et al., 2005) and a placement ratio more than 0.76 are considered
acceptable.
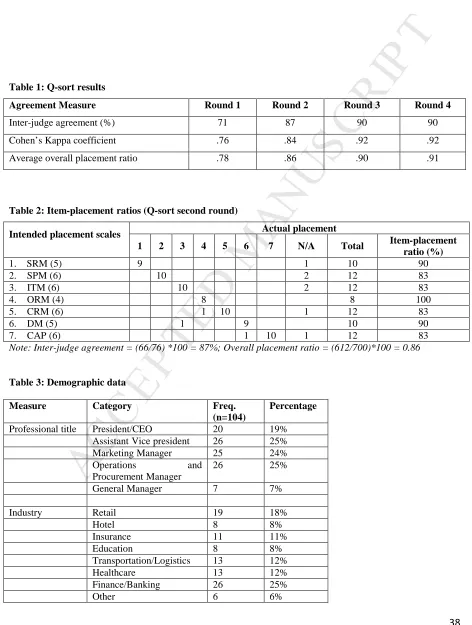
--Insert Table 1: Q-sort results--
Practitioners working in areas related to service operations management from low and
high contact service sectors were invited to participate in the four rounds of Q-sort. Table 1
shows how the inter-judge agreement scores improved over the Q-sort rounds. Though the
inter-judge agreement level (71%) and Cohen’s Kappa coefficient (0.76) are acceptable (Li et
al., 2005) in the first round, the average overall placement ratio was in the border-line at 0.78.
M
A
N
U
S
C
R
IP
T
A
C
C
E
P
T
E
D
category different from that intended) to identify ambiguous scales (i.e., scales placed in
more than one category) and indeterminate scales (i.e., scales placed in the “not applicable”
category) were reworded or eliminated based on the feedback from the judges. As a result,
eight scales were removed after the first round of Q-sort (scales labeled ‘a’ in Appendix A).
The remaining 38 reworded scales were used for the second round. Table 1 shows all the
inter-judge agreement measures are acceptable. Though the results provide preliminary
evidence of measurement validity and reliability, the off-diagonal scales in the placement
matrix were removed as aligned with the feedback from the judges. As a result, 10 scales
were further removed (scales labelled ‘b’ in Appendix A). We present the second round of
item-placement ratio in Table 2 as an example of the placement matrix. Each of the capability
reflecting SSCM process capabilities is placed in the rows of the table.
--Insert Table 2: Item-placement ratios (Q-sort second round)--
In the third round of Q-sort, comprising 28 scales for sorting, the inter-judge agreement
(90%), average overall placement ratio (0.90) and Cohen’s Kappa score 0.92 were improved
from the previous round after further elimination of ambiguous scales in a second round of
Q-sort. The fourth round exhibited an inter-judge agreement score very similar to that in the
third round. The Q-sort results suggest an excellent level of inter-judge agreement, indicating
a high level of reliability and construct validity for the initial SSCM process capability
measurement scales. Finally, each of the construct dimensions consists of the least four
measurement scales, which is desirable for structural equation modeling (Hinkin, 1995). The
final 28 scales capturing the seven dimensions of SSCM process capabilities were used in the
M
A
N
U
S
C
R
IP
T
A
C
C
E
P
T
E
D
3.2 Stage 2: Large-scale surveyTo empirically verify measurement reliability and validity, we conducted a large-scale
survey questionnaire. Based on the results from Q-sort, we designed a survey questionnaire
and asked practitioners to review. Some statements were refined in accordance with their
suggestions. In addition, a pilot study was conducted to pretest the questionnaire with 25
managers. Consequently, the final version of the questionnaire, consisting of 28 scales, was
developed. In the survey, managers were asked to indicate their level of agreement on each
measurement item by using a five-point Likert scale anchored by “1” as “strongly disagree”
to “5” as “strongly agree”. We also included demographic variables, such as industry,
professional title, experience, and firm size in the questionnaire.
3.2.1 Data collection
Mass mail survey was conducted in the Thai service industries. The English version of
the questionnaire was then translated into Thai by a bilingual native of Thailand. Another
bilingual native of Thailand proofread the English version and noted ambiguities that could
confuse respondents. The questionnaire was then revised accordingly. The revised
questionnaire in Thai was reviewed by several Thai practitioners and academicians familiar
with service operations management and SSCM. Their comments primarily focused on the
clarification of the instructions and refinement of item wording. The questionnaire was
further amended based on their feedback.
A mailing list was obtained from two sources: (1) Thailand Business Directory and (2)
Ministry of Commerce. Respondents were operations managers as well as CEOs, presidents,
vice presidents, directors, or managers of service firms who are presumed to have adequate
knowledge concerning the service operations and SSCM of their organizations. The sample
M
A
N
U
S
C
R
IP
T
A
C
C
E
P
T
E
D
(Mersha, 1990) including high and low contact services, to embrace the diversity of the
service sectors (Chase and Tansik, 1983; Skaggs and Galli-Debicella, 2012; Soteriou and
Chase, 1998). Low-contact services include financial/banking, retailing, and
transportation/logistics and high-contact services include hotels, education, and healthcare.
These sectors have a broad presence in the Thai economy. The final mailing list contained
660 organizations. Since the questionnaires were sent by bulk mail, the mailing addresses
were verified. To maximize response rate, the researchers called respondents to explain the
research purpose and asked them to participate before sending the questionnaires with a cover
letter indicating the contribution of this study. The questionnaire was send out in two phases.
In the first phase, 76 responses were received. The reminder was then sent to targeted
respondents who did not respond, and consequently, we received 28 additional responses in
the second phase. There were 104 usable responses, with a response rate of 16%, which is
comparable to prior studies using a key informant approach (Frohlich, 2002; Wong et al.,
2011). Table 3 presents the demographic data. Non-response bias was first tested by using the
extrapolation method suggested by Armstrong and Overton (1977). A comparison between
early and late response showed no statistical differences across all demographic data
including professional title, industry, experience and firm size between non-responding and
responding firms at p < 0.05, which suggests no non-response bias. . Furthermore, we tested
for multivariate normality and kurtosis, and no violations were found.
--Insert Table 3: Demographic data--
Common method variance is addressed as follows. First, we collected data through
in-depth interviews, Q-sort, and a large-scale survey to reduce bias from the use of a single
source of data. The collection of data from these three approaches enables data triangulation,
reducing the problem of common method variance. Second, we used the years of tenure of
M
A
N
U
S
C
R
IP
T
A
C
C
E
P
T
E
D
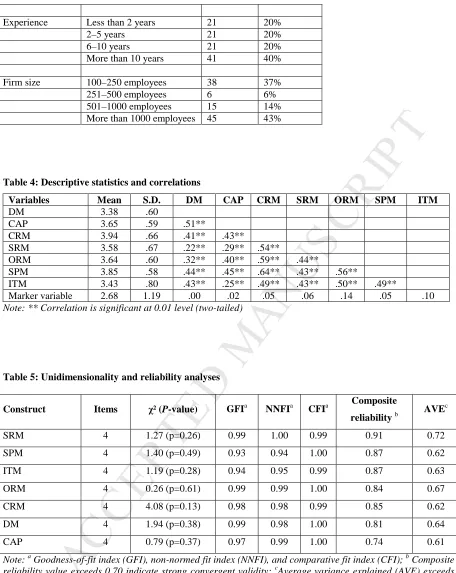
common method variance is an issue. As shown in Table 4, the marker variable was not
significantly related to any of the variables. Third, we conducted Harman’s one-factor test to
examine if the chi-square of a single latent factor accounts for the hypothesized
seven-construct model. The results indicated significant differences between the chi-square values
of the two models. The fit in the one-dimensional model was significantly worse than the
seven-construct model. These results suggest that common method variance is not an issue.
Insert Table 4: Descriptive statistics and correlations --3.2.2 Construct validity and reliability
To assess construct validity and reliability, confirmatory factor analysis (CFA) was
conducted on each SSCM process capability construct. To test the unidimensionality, we
examined if a single latent variable (construct) underlies a set of measurement scales
(Anderson and Gerbing, 1988). Table 5 indicates that all models exhibit fit indices (GFI,
NNFI and CFI) greater than 0.9, implying a satisfactory fit and all scales are valid in
reflecting their corresponding constructs (unidimensionality). All the composite reliability
values exceeded the 0.70 threshold, suggesting adequate scale reliability and that the scales
sufficiently represent their respective constructs (Bagozzi and Yi, 1998).
--Insert Table 5: Unidimensionality and reliability analyses--
Convergent validity is assessed by examining the AVE values and standardized path
loading. The AVE values exceeded 0.5 as shown in Table 5, indicating that a large amount of
the variance is captured by the measurement scales (Hair et al., 2010). In addition, the CFA
results lend support to the first-order model of SSCM process capability with χ2 = 486.12, df
= 329, p < 0.001, CFI = 0.90, TLI = 0.90, and SRMR = 0.07. The magnitude and sign of the
M
A
N
U
S
C
R
IP
T
A
C
C
E
P
T
E
D
scales are highly significant related to their corresponding construct with loadings ranging
from 0.518 to 0.925, providing evidence of the convergent validity of the scales.
--Insert Table 6: First-order CFA results --
To assess the discriminant validity, CFA was conducted on each pair of constructs (21
pairs in total) by comparing the chi-square difference between the unconstructed model (i.e.,
the latent factors were freely correlated) and the constrained model (i.e., the correlation
between the latent factors was constrained to one). The chi-square differences of each pair of
latent factors are statistically significant at p < 0.05, suggesting that the measurement scales
capture their respective constructs (Appendix B in the supplementary documents). Thus, the
discriminant validity of each multi-item measurement scale was established.
3.2.3 First- and second-order model comparison
Based on our theorization and competence-based theory, seven process capabilities are a
priori factors of the SSCM process capabilities of firms. We, therefore, tested if these
capabilities reflect the SSCM process capabilities and form a high-order factor in three steps.
First, we developed a first-order model, where the seven process capabilities are correlated
but do not reflect a common latent factor. The loadings of the measurement scales on their
respective latent factors are summarized in Table 6.
Second, we developed a second-order model, where the seven process capabilities reflect
SSCM process capability as a higher-order latent factor. The second-order model has
significant χ2 statistics (χ2 = 506.41, df = 343, p < 0.001), and the fit indices meet their
respective thresholds (CFI = 0.90, TLI = 0.90, SRMR = 0.07). Figure 1 shows the
M
A
N
U
S
C
R
IP
T
A
C
C
E
P
T
E
D
variance in the first-order factors explained by the second-order factors are: 0.38 (DM), 0.38
(CAP), 0.76 (CRM), 0.35 (SRM), 0.60 (OPM), 0.49 (ITM), and 0.69 (SPM). These results
provide preliminary support that the higher-order model gives a good account of the
covariance among the first-order factors. Third, to further verify the efficacy of the two
models, we compared the χ2 statistics of the first- and second-order models. We computed the
target coefficient (i.e., first-order model χ2/second-order model χ2) and obtained T = 0.96,
which is very close to the theoretical upper limit of 1.0. This means the relationship among
the second-order factors accounts for 96% of the first-order factors. Thus, SSCM process
capability can be conceptualized as a second-order multidimensional construct with the seven
first-order variables.
3.2.4 Nomological validity
The nomological validity of the SSCM process capabilities measure was tested to ensure the
construct structure was consistent with the literature and in line with the theory on service
performance. Specifically, we tested if the second-order construct (i.e., SSCM process
capabilities) sufficiently predicted the outcome variables in terms of service quality and
customer satisfaction. Following Liu et al. (2012), we tested the predictive efficiency of
SSCM process capabilities by computing the ratio of the R2 of the first-order factors–
performance outcomes model and the R2 of the second-order factors–performance outcomes
model of the two regressions. The R2 of the first-order factors–performance outcomes model
was 0.653 for service quality and 0.462 for customer satisfaction. The R2 of the second-order
factors–performance outcomes model was 0.643 for service quality and 0.444 for customer
satisfaction. The predictive efficiency of the second-order construct was 0.643/0.653 = 98%
for service quality and 0.444/0.462 = 96% for customer satisfaction. This means the SSCM
M
A
N
U
S
C
R
IP
T
A
C
C
E
P
T
E
D
and customer service explained by the seven first-order variables, respectively. These high,
predictive efficiency scores indicate that the second-order variables can replace the role of the
first-order variables in predicting the performance outcomes, providing evidence that
nomological validity is established.
4. Discussion and conclusions
This study advances theory and our understanding of SSCM through the conceptual
development and empirical validation of a set of multi-item scales of SSCM process
capabilities. From anecdotal accounts of the various SSCM processes, this paper advances the
field by laying down the theoretical foundation and rigorously testing their measurement
scales. With such empirically validated construct measurement scales with sound
psychometric properties further meaningful empirical investigations are made possible
(Venkatraman, 1989). This is achieved by scrutinizing existing conceptualizations of SSCM
processes based on the competence-based theoretical lens, and then placing the newly
developed SSCM process capability measurement scale under rigorous empirical tests based
on the Q-sort method and a survey of a wide range of service sectors. Such reliable and
validated measurement scales make it possible to examine how service firms develop their
SSCM process capabilities to achieve service quality and performance.
Consistent with the Unified Service Theory and competence-based views, this study
ascertains that SSCM process capability as a second-order construct comprises seven key
SSCM process capabilities, each represented by a unidimensional multi-item scale. SSCM
process capability is found to be a bundling of seven facets of processes, which cover the
ability to (i) manage and balance customer demand, (ii) manage capacity and resources of
services, (iii) maintain and develop long-term customer relationships, (iv) develop and
maintain a close and long-term relationship with suppliers as partners, (v) organize responses
M
A
N
U
S
C
R
IP
T
A
C
C
E
P
T
E
D
to support and collaborate with supply chain partners to improve service supply chain
operations. These measurement scales are specially developed for the service sector with
unique characteristics (Ellram et al., 2004; Sampson and Spring, 2012) while incorporating
processes similar to manufacturing settings (Zhou et al., 2009).
Our findings provide some crucial theoretical and practical implications into SSCM
processes. The development of SSCM process capability scales represents a crucial step
toward further theoretical advancement. While earlier studies suggest that
inter-organizational or SSCM process capabilities are valuable for service firms (Maull et al.,
2012; Sampson and Spring, 2012; Tang and Rai, 2012; Zhang et al., 2011), this study
theoretically develops and empirically proves the value of SSCM process capabilities. With
our empirically validated measurement scales, it is now possible to further examine, for
example, the effects of various antecedent, consequent, and contingency factors to better
understand how service firms may achieve and utilize their capabilities to improve
performance in future studies. The measurement provides a foundation of research for future
SSCM studies.
The measurement provides a comprehensive list of organizational activities for managers
to communicate with various functions to develop SSCM process capabilities for the
development and improvement of the services supply chain. The measurement also facilitates
managers to plan resources, develop infrastructure (e.g., information systems and
technologies) and to establish SSCM process capabilities. The analysis of our survey data
provides initial evidence that SSCM process capabilities significantly explain service quality
and customer satisfaction for Thai service firms. Having the SSCM process capabilities
would be beneficial to service firms in achieving competitive advantage.
Furthermore, the measurement scales for SSCM process capabilities developed by this
M
A
N
U
S
C
R
IP
T
A
C
C
E
P
T
E
D
of this study, service managers may now expand their benchmarking or diagnostic scope
from the typical internal service capabilities developed decades ago to SSCM process
capabilities. Such capabilities may bring about new competitive advantage owing to the
increased use of outsourcing in many service sectors. Further research may explore how
service managers from different sectors view the importance of each SSCM process and how
they manage to develop such capabilities in reality.
The validated measurement also enables service firms to track and monitor their SSCM
process capabilities, enabling them to maintain records of their service supply chain
development. The multi-facet characteristics of SSCM process capabilities provide a
direction for departments to work jointly together to achieve and improve SSCM process
capabilities. The measurement is also useful for communicating for the implementation of
SSCM processes between managers and staff.
As with all research, there are some limitations that should be noted. First, the data for
this study is cross-sectional that limits the ability to determine the causal phenomenon. Future
research should include other types of data such as longitudinal data for the analysis. In
addition, this study used of a single respondent from each firm. Future study should attempt
to collect additional data sources for the scale validation to minimize the possibility of bias in
the response to the survey questions. Finally, future research should extend the study to other
service industries from both different developing and developed countries.
References
Aitken, J., Childerhouse, P., Deakins, E., and Towill, D. (2016), “A comparative study of
manufacturing and service sector supply chain integration via the uncertainty circle
model” The International Journal of Logistics Management, Vol. 27, No. 1, pp. 188-205.
Amit, R. and Schoemaker, P.J. (1993), “Strategic assets and organizational rent”, Strategic
M
A
N
U
S
C
R
IP
T
A
C
C
E
P
T
E
D
Anderson, J.C. and Gerbing, D.W. (1988), “Structural equation modeling in practices: a
review and recommended two-step approach”, Psychology Bulletin, Vol. 103, pp.
411-423.
Armstrong, J.S. and Overton, T.S. (1977), “Estimating nonresponse bias in mail surveys”,
Journal of Marketing Research, Vol. 14, pp. 396-402.
Bagozzi, R.P. and Yi, Y. (1998), “On the evaluation of structural equation models”, Journal
of the Academy of Marketing Science, Vol. 16, pp. 74-94.
Baltacioglu, T., Ada, E., Kaplan, M., Melike, Y.O., Kaplan and Y.C. (2007), “A new
framework for service supply chains”, The Service Industries Journal, Vol. 27 No. 2, pp.
105-124.
Berry, L.L., Zeithaml, V.A. and Parasuraman. A. (1985), “Quality counts in services, too”,
Business Horizons, May–June, pp. 44-52.
Berry, W.L., Mabert, V.A. and Marcus, M. (1979), “Forecasting teller windows demand with
exponential smoothing”, Academy of Management Journal, Vol. 22 No. 1, pp. 129-137.
Besseris, G. (2014), “Robust process capability performance: an interpretation of key indices
from a nonparametric viewpoint”, The TQM Journal, Vol. 26, No. 5, pp. 445-462.
Bitner, J.M. (1995), Building service relationships: it's all about promises. Journal of the
Academy of Marketing Science, Vol. 23 No. 4, pp. 246-251.
Boyer, K.K., Gardner, J.W. and Schweikhart, S. (2012), “Process quality improvement: an
examination of general vs. outcome-specific climate and practices in hospital”, Journal
of Operations Management, Vol. 30, 325-339.
Boon-itt, S. (2009), “The effect of internal and external supply chain integration on product
quality and innovation: Evidence from Thai automotive industry”, International Journal
of Integrated Supply Management, Vol., 5, No. 2, pp. 97-112
M
A
N
U
S
C
R
IP
T
A
C
C
E
P
T
E
D
uncertainties on the relationship between supply chain integration and customer
delivery performance." International Journal of Physical Distribution and Logistics
Management, Vol. 41, No. 3, pp. 253-276.
Breidbach, C. F., Reefke, H. and Wood, L. C. (2015), “Investigating the formation of service
supply chains”, The Service Industries Journal, Vol.35 No.1-2, pp. 5-23.
Browne, J. (1995), “Forecasting demand for services”, Industrial Engineering, Vol. 27 No. 2,
pp. 16-17.
Campbell, A.J. (2003), “Creating customer knowledge competence: managing CRM
programs strategically”, Industrial Marketing Management, Vol. 32, 375-383.
Carr, A.S. and Pearson, J.N. (2002), “The impact of purchasing and supplier involvement on
strategic purchasing and its impact on firm’s performance”, International of Operations
and Production Management, Vol. 22 No. 9/10, pp. 1032-1053,
Caruana, A., and Pitt, L.F. (1997), “Right first time in service: a check list for best practices
and the link to performance”, The Journal of Services Marketing, Vol. 11 No. 6, pp.
366–374.
Castrogiovanni, G.J. and Macy, B.A. (1990), “Organizational information-processing
capabilities and degree of employee participation: a longitudinal field experiment”,
Group & Organization Studies, Vol. 15 No. 3, pp. 313–336.
Chan, T.Y., Wong, C.W.Y., Lai, K.H., Lun, V.Y.H., Ng, C.T., and Ngai, E.W.T. (2016) “
Green service: Construct development and measurement validation”, Production and
Operations Management, Vol. 23, No. 3, pp. 437-437
Chase, R.B. and Tansik, D.A. (1983), “The customer contact model for organizational
M
A
N
U
S
C
R
IP
T
A
C
C
E
P
T
E
D
Chen, D.Q., Preston, D.S. and Xia, W. (2013), “Enhancing hospital supply chain
performance: a relational view and empirical test”, Journal of Operations Management,
Vol. 31, pp. 391-408.
Chen, J.J. and Paulraj, A. (2004), “Towards a theory of supply chain management: the
constructs and measurements”, Journal of Operations Management, Vol. 22, pp.
119-150.
Cho, D.W., Young, H.L., Ahn, S.H. and Hwang, M.K. (2012), “A framework for measuring
the performance of service supply chain management”, Computer & Industrial
Engineering, Vol. 62, pp. 801–818.
Chopra, S. and Meindl, P. (2004), Supply Chain Management: Strategy, Planning, and
Operations, Prentice Hall.
Chung-Herrera, B.G. (2007), “Customers’ psychological needs in different service
industries”, Journal of Service Marketing, Vol. 21 No. 4, pp. 263-269.
Churchill, G.A. (1979), “A paradigm for developing better measures of marketing
constructs”, Journal of Marketing Research, Vol. 16, 64-73.
Coates, T.T. and McDermott, C.M. (2002), “An exploratory analysis of new competencies: a
resource-based view perspective”, Journal of Operations Management, Vol. 20, pp.
435-450.
Collier, D.A. (1991), “A service quality process map for credit card processing”, Decision
Sciences, Vol. 22 No. 2, pp. 406-420.
Croxton, K.L., Garcia-Dastugue, S.J., Lambert, D.M. and Rogers, D.S. (2001), “The supply
chain management processes”, International Journal of Logistics Management, Vol. 12
No. 2, pp. 13-35.
Croxton, K.L. (2003), “The order fulfillment process”, International Journal of Logistics
M
A
N
U
S
C
R
IP
T
A
C
C
E
P
T
E
D
Davenport, T.H. and Beers, M.C. (1995), “Managing information about processes”, Journal
of Management Information Systems, Vol. 12 No. 1, pp. 57–80.
Davis-Sramek, B., Mentzer, J.T. and Stand, T.P. (2008), “Creating consumer durable retailer
customer loyalty through order fulfillment service operations”, Journal of Operations
Management, Vol. 26, 781-797.
Doran, D., Thomas, P. and Caldwell, N. (2005), “Examining buyer-supplier relationships
within a service sector context”, Supply Chain Management: An International Journal,
Vol. 10 No. 3/4, pp. 272-277.
Edvardsson, B. (1997), “Quality in new service development: Key concepts and a frame of
reference”, International Journal of Production Economics, Vol. 52 No. 1, pp. 31-46.
Ellram, L.M., Tate, W.L. and Billington, C. (2004), “Understanding and managing the
services supply chain”, Journal of Supply Chain Management, Vol. 40 No. 4, pp. 17-32.
Fabien, L. (2005), “Design and implementation of a service guarantee”, The Journal of
Services Marketing, Vol. 19No. 1, pp. 33-38.
Froehle, C.M. and Roth, A.V. (2004), “New measurement scales for evaluating perceptions
of the technology-mediated customer service experience”, Journal of Operations
Management, Vol. 22, 1-21.
Froehle, C.M. and Roth, A.V. (2007), “A resource-process framework of new service
development”, Production and Operations Management, Vol. 16 No. 2, 169-188.
Frohlich, M.T. (2002), “Techniques for improving response rates in OM survey research”,
Journal of Operations Management, Vol. 20 No. 1, pp. 53-62.
Fynes, B., Voss, C. and de Burca, S. (2005), “The impact of supply chain relationship
dynamics on manufacturing performance”, International Journal of Operations &
M
A
N
U
S
C
R
IP
T
A
C
C
E
P
T
E
D
Galbraith, J. (1974), “Organization design: an information processing view”, Interfaces, Vol.
4 No. 3, pp. 28 pp. 36.
Giannakis, M. (2010), “Conceptualizing and managing service supply chains”, The Service
Industries Journal, Vol. 31 No. 11, pp. 1809-1823.
Gobbi, C. and Hsuan, J. (2015), “Collaborative purchasing of complex technologies in
healthcare: Implications for alignment strategies”, International Journal of Operations
and Production Management, Vol. 35 No. 3, pp. 430-455.
Gorman, P. and Thomas, H. (1997), “The theory and practice of competence-based
competition”, Long Range Planning, Vol. 30 No. 4, pp. 615-620.
Griffith, D.A., Harvey, M.G., and Lusch, R.F. (2006), “Social exchange in supply chain
relationships: the resulting benefits of procedural and distributive justice”, Journal of
Operations Management, Vol. 24 No. 2, pp. 85-98.
Hair, J.F., Black, W.C., Babin, B.J. and Anderson, R.E. (2010), Multivariate Data Analysis,
7th ed, Prentice Hall, Englewood Clifts.
Handfield, R.B. and Nichols, E.L. (1999), Introduction to Supply Chain Management,
Prentice-Hall, New Jersey.
Hayes, R.M. and Thies, E.A. (1991), “Management of technology in service firms”, Journal
of Operations Management, Vol. 10 No. 3, pp. 388-397.
Heskett, J.L., Jones, T.O., Lovemen, G.W., Sasser, W.E., and Schlesinger, L.A. (1994),
“Putting the service-profit chain to work”, Harvard Business Review, Vol. 72, pp.
164-170.
Hinkin, T.R. (1995), “A review of scale development practices in the study of organizations”,
Journal of Management, Vol. 21 No. 5, pp. 967-988.
Jarvenpaa, S.L. (1989), “The effect of task demands and graphical format on information