Int. J. Electrochem. Sci., 6 (2011) 3178 - 3195
International Journal of
ELECTROCHEMICAL
SCIENCE
www.electrochemsci.org
Highly Selective and Sensitive Thiocyanate PVC Membrane
Electrodes Based on Modified Zeolite ZSM-5
Atefeh Badri*, and Pouya Pouladsaz
Department of Chemistry, Islamic Azad University, Shahreza Branch, P.O. Box 311-86145, Shahreza, Isfahan, Iran
*
E-mail: atefebadri@gmail.com
Received: 12 June 2011 / Accepted: 11 July 2011 / Published: 1 August 2011
A highly selective membrane electrode based on surfactant modified zeolite is presented. The proposed electrode shows very good selectivity for thiocyanate ions over a wide variety of common inorganic and organic anions. The sensor displays a near Nernstian slope of −58.9 ± 0.9 mV per decade. The working concentration range of the electrode is 1.00×10⁻⁶
- 1.10×10⁻¹ M with a detection limit of 8.33×10⁻⁷ M . The response time of the sensor in whole concentration ranges is very short (<10 s). The response of the sensor is independent on the pH range of 2.0–10.1. The best performance was obtained with a membrane composition of 25.5% PVC, 64.5% dioctyl phthalate, 10% modified zeolite ZSM-5. It was successfully applied to direct determination of thiocyanate in water samples and as an indicator electrode for titration of thiocyanate ions with AgNO3 solution.
Keywords: Thiocyanate, Surfactant modified zeolite ZSM-5 (SMZ), potentiometry, Ion selective membraine electrode (ISE), Poly vinyl chloride (PVC)
1. INTRODUCTION
Thiocyanate finds many industrial applications and though not as toxic as cyanide, it is harmful to aquatic life. Its determination at low levels in water and industrial effluents is therefore important. Thiocyanate sensors are potentially useful for detecting this compound in biological samples (e.g. urine and saliva), where elevated levels of thiocyanate correlate with excessive cigarette smoking. If the content of thiocyanate ion is a little higher in the body than normal, the protein dialysis will be affected and it may even result in coma. Due to the urgent need for selective potentiometric determination of trace amounts thiocyanate ion, especially in food, biological and water samples, many coordination compounds have been employed as an ionophore in the construction of ISEs thiocyanate ion [2–10].
Recent decade scientific researches introduced several PVC based sensors for different anions, such as I− [11–13], SCN- [3, 4, 9], SO4 2− [14–19], ClO4− [20], NO2− [21, 22].
In this work, we report the use of a surfactant-modified zeolite ZSM-5 as an excellent ionophore for the preparation of a highly selective and sensitive polymeric membrane sensor for thiocyanate ion. The proposed sensor resulted in selectivity coefficients superior to those reported for other thiocyanate-selective electrodes.
2. EXPERIMENTAL 2.1. Reagents and chemicals
Sodium silicate used was the product of Merck and its composition is SiO2 (25.2-28.5%), Na2O (7.5-8.5%), H2O (63%). Chloridric acid (37%), sulfuric acid (98%), sodium hydroxide (98%), tetrapropylammonium bromide (TPABr 98%), Aluminum sulfate eighteen hydrate (>99.3%), sodium chloride (99.5%) were supplied from Merck.
The polymeric matrix was prepared from high relative molecular weight polyvinyl chloride (PVC). Reagent grade dioctylphthalate (DOP), tetrahydrofuran (THF) and hexadecyltrimethylammonium bromide (HDTMABr) were purchased from Aldrich or Fluka and used as received. Sodium and potassium salts of all anions were of the highest purity available (all from Merck) and used without any further purification. The pH of solutions was adjusted with sodium hydroxide or hydrochloric acid solution as appropriate. All other reagents used were of analytical reagent grade. De-ionized water was used throughout the experiments. A 0.1M stock solution of thiocyanate was prepared by dissolving an appropriate, accurate amount of KSCN. The standard 1.0×10⁻⁷–1.0×10⁻¹M solutions of thiocyanate were prepared daily by sequential dilution of the appropriate stock solution with doubly distilled water.
2.2. Synthesis and modification of ZSM-5 zeolite
sulfuric acid were added with vigorous stirring. 15.0000 g (0.07125 mol SiO2) of sodium silicate solution was subsequently added and the mixture was stirred for 60 min. The pH of the mixture was 9.38. The mixture was transferred into the autoclave. The autoclave was kept into an oven at 110 °C for about 2 h. Then, the temperature was increased to 230 °C and kept at that level for another 5 h. The solid phase obtained was filtered out, washed with water several times, dried at 110 °C for about 12-14 h and subsequently calcined at 540 °C for 3 h [23].
For preparation of surfactant modified zeolite (SMZ), the Na-ZSM-5 zeolite (2 g) was mixed with 100 mL of 50 mM HDTMA solutions, and stirred for 24 h on a magnetic stirrer. The mixture was then centrifuged at 5000 rpm for 20 min and the resulting SMZ was dried in air.
2.3. Characterization of the synthesized zeolite and the SMZ
The X-ray diffraction patterns of zeolite ZSM-5 was determined using a Bruker diffractometer, D8ADVANCE, X-ray tube anode: Cu, wavelength: 1.5406 (Cu Kα radiation), filter: Ni. Fourier transformation infrared (FT-IR) spectra of samples, on KBr pellets, were recorded with a Nicolet single beam FT-IR (Impact 400D) spectrometer in the range of 400-4000 cm-1. All samples were stored in a desiccator until the FT-IR analysis and KBr of spectrometry grade was also heated at 25 ◦C to remove the adsorbed water before pressing. Then 1mg dry powdered sample was mixed with 100 mg KBr, followed by compressing the mixture to pellets with 12 mm diameter and investigating by the FT-IR spectrometer.
2.4. Electrode preparation
The procedure to prepare the best PVC membrane was to mix thoroughly 25.5 mg of powdered PVC, 10.0 mg of SMZ as ionophore and 64.5 mg of plasticizer DOP. Then the mixture was dissolved in 3 mL of dry THF. The resulting clear mixture was evaporated slowly until an oily concentrated mixture was obtained. A Pyrex tube (5 mm i.d.) was dipped into the mixture for about 10 s so that a nontransparent membrane of about 0.3 mm thickness is formed. The tube was then pulled out from the mixture and kept at room temperature for about 2 h. The tube was then filled with internal solution (1.0×10⁻² M KSCN). The electrode was finally conditioned for 16 h by soaking in a 1.0×10⁻²
M KSCN solution. A silver/silver chloride electrode was used as an internal reference electrode. The electrode was instantly ready for use.
2.5. Potentiometric measurements
were reported versus this reference electrode. The cells for millivolt measurements were of the following type:
Ag/AgCl, KCl (3M) | internal solution KSCN (1.0 × 10⁻² M) |electrode membrane | test solution | Ag/AgCl, KCl (3M)
The potential reading of each solution was recorded when it became stable, and then plotted as a logarithmic function of SCN- anion concentration. The activities of anions were based on the activity-coefficient data () calculated from the modified form of Debye-Huckel Equation [24], which is applicable to any ion and is as follows:
(1)
where is the ionic strength and Z is the valency. All measurements were carried out at room temperature. The pH measurements were performed using a corning model 125 pH meter equipped with a combined electrode.
3. RESULTS AND DISCUSSION
3.1. Synthesized zeolite and SMZ characterization
3.1.1. X-ray diffraction studies
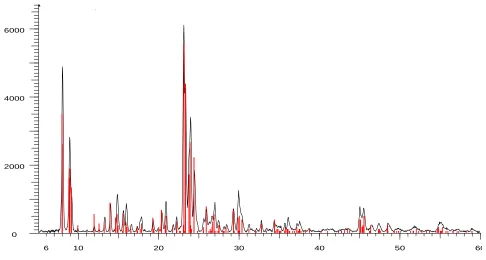
Synthesized ZSM-5 zeolite was characterized by X-ray diffraction.
0 2000 4000 6000
6 10 20 30 40 50 60
[image:4.596.56.542.480.740.2]
Figure 1 shows representative XRD patterns of sample synthesized. The measurements were conducted in continuous /2 scan refraction mode. The anode was operated at 30 KV and 15 mA the 2 angles were measured 5–60 at the rate of 2.min-1. The characteristic lines at 2θ of 7.9, 8.8, 23.1, 23.8 and 24.5 are observed from XRD pattern that show a good agreement with the data of Na- ZSM-5 zeolite [25]. The crystallinity of the prepared sample was calculated using the ratio of the sum of the areas of the most intense peaks for zeolite ZSM-5 sample (in above mentioned 2θ values) to the same peaks for the standard (zeolite ZSM-5) and multiplying by 100. This analysis shows that the product has a typical zeolite ZSM-5 structure with no amorphous material.
3.1.2. FT-IR studies
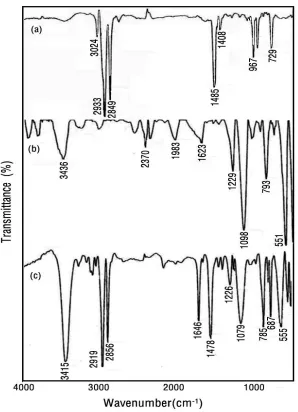
FT-IR lattice vibration spectra were used to investigate the influence of surfactant on the zeolite framework.
[image:5.596.153.451.321.733.2]
Representative spectra of zeolite HDTMA, ZSM-5 and SMZ in the range of 400–4000cm−1 are shown in Fig. 2. According to Fig. 2b, the observed frequencies at 3436, 1623, 1098 and 551cm−1 agrees with the infrared spectral data, which has been obtained for zeolite ZSM-5 by Flanigen et al. [26]. The IR pattern of SMZ-ZSM-5 shows characteristic peaks at 2919, 2856, 1478 and 687 cm–1 in fig. 3c, which indicate the incorporation of HDTMA into the zeolite structure. There is a slight shift in peaks at each wavenumber, however, both of the patterns are nearly the same. Specially, the prescence of peaks at 2919, 2856 and 1478 cm-1 in SMZ spectrum (related to C-H, C-C and N-C vibrations in the surfactants, respectively), that are absent in the Na- ZSM-5 spectrum, confirm loading of HDTMA on zeolite surface.
3.2. Theoretical considerations of SMZ and electrode behavior
As previously mentioned, the SMZ can be used for sorption of anionic species. This is based on the conceptual model which was illustrated graphically in the previous work [27]. At low concentrations, HDTMA forms a monolayer on the zeolite surface with the hydrophobic ends of the molecules turned toward the solution. With increasing coverage, a second HDTMA layer is also formed. This bilayer structure causes arrangement of positively charged functional groups toward the solution, which can serve as sorption sites for anions [28]. Complete formation of the second layer, means that sorbed HDTMA concentration is twice of the external cation exchange capacity (ECEC).
Preliminary experiments showed that when SMZ is mixed with a solution containing thiocyanate anion, the concentration of thiocyanate in the remaining solution is decreased. Therefore, we were prompted to use the SMZ as an active ingredient for construction of a potentiometric sensor for this anion. The sorption mechanism can be shown by the following reaction:
R4N+ in SMZ + ClO4− R4N+ ClO4− (2)
where R4N+ represents the anion-exchange sites of HDTMA surfactant on SMZ. According to the above discussions, when proposed electrode is immersed in thiocyanate solutions, anion exchange reaction takes place between anions on the electrode surface (Br−) and ClO4− in solution.
3.3. Optimization of the membrane composition
[image:7.596.71.527.158.326.2]
behavior. Electrodes which were prepared at 100 and 200 mM HDTMA solution do not show a Nernstian behavior.
Table 1. Potentiometric response of the electrode toward different anions (n=4).
Anion Slope(mV.decade-1) r2 Linear range (-log C)
ClO4- 46.7 ± 0.8 0.9809 ± 0.08 5.2-1.1
ClO3- 36.1 ± 0.9 0.9903 ± 0.08 5.0-3.1
SO42- 19.2 ± 1.1 0.9393 ± 0.04 4.8-2.1
SO32- 20.2 ± 0.9 0.9807 ± 0.07 5.1-1.9
C2O42 17.1 ± 0.9 0.9866 ± 0.04 4.8-1.9
I- 41.2 ± 0.8 0.9791 ± 0.08 5.1-2.6
NO3- 18.1 ± 0.8 0.9870 ± 0.008 4.1-2.1
HPO42- 30.4±1.4 0.9678 ± 0.009 5.1-2.0
SCN- 60.7 ± 1.6 0.9933 ± 0.005 6.6-1.2
Br- 34.3 ± 0.9 0.9661±0.004 4.8-2.0
Table 2. Optimization the modifier amount.
Electrode Modifier percentage Slope (mV. decade-1) (n=5)
A 4%(NaZSM-5+100 mM HDTMA) -42.0 ± 1.1
B 10%( NaZSM-5+100 mM HDTMA) -53.1 ± 0.5 C 15%( NaZSM-5+100 mM HDTMA) -45.1 ± 0.7
D 4%( NaZSM-5+200 mM HDTMA) -42.5 ± 0.8
E 10%( NaZSM-5+200 mM HDTMA) -53.1 ± 0.5 F 15%( NaZSM-5+200 mM HDTMA) -56.1 ± 0.8
G 4%( NaZSM-5+50 mM HDTMA) -40.1 ± 1.1
*H 10%( NaZSM-5+50 mM HDTMA) -58.7 ± 0.3 I 15%( NaZSM-5+50 mM HDTMA) -41.1 ± 0.8
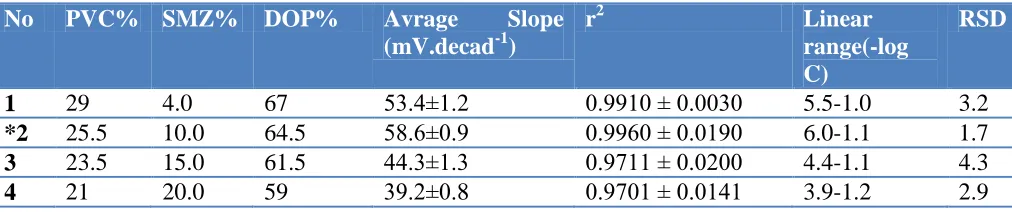
Table 3. Composition and potentiometric characterization of thiocyanate selective electrode based on SMZ-PVC membrane (n=4).
No PVC% SMZ% DOP% Avrage Slope
(mV.decad-1)
r2 Linear
range(-log C)
RSD
1 29 4.0 67 53.4±1.2 0.9910 ± 0.0030 5.5-1.0 3.2
*2 25.5 10.0 64.5 58.6±0.9 0.9960 ± 0.0190 6.0-1.1 1.7
3 23.5 15.0 61.5 44.3±1.3 0.9711 ± 0.0200 4.4-1.1 4.3
4 21 20.0 59 39.2±0.8 0.9701 ± 0.0141 3.9-1.2 2.9
[image:7.596.44.550.597.703.2]
were obtained by Wingenfelder et al. [29] for antimonate sorption studies. They found that, in the treatments about two times of the ECEC, the zeolite took up over 98% of the initial HDTMA in solution. When the applied HDTMA concentrations were over two times as high as the ECEC, the zeolite took up 84% of the initial HDTMA concentration.
The potential response of a sensor is greatly related to the membrane ingredients [30-34]. The ratio of membrane ingredients were optimized so that the membranes develop reproducible, noiseless and stable potentials. Composition of the membranes, which resulted in the best performance, is shown in Table 3 along with their potentiometric characteristics. As it can be seen, electrodes made from membranes containing 10% (w/w) zeolite in the presence of 25.5% polymer, 64.5% dioctylphthalate were found to be the optimum one in the development of this sensor (membrane no. 2, Table 3). Thus, this membrane composition was used for subsequent works.
3.4. Effect of internal reference solution
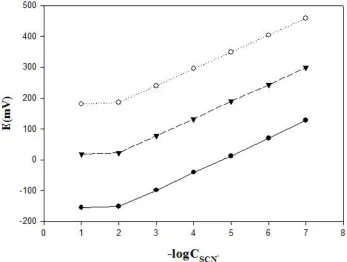
The concentration of the internal solution (KSCN) in the electrode was changed from 1.0×10⁻² to 1.0 ×10⁻⁴ M and the emf-pSCN− plots were obtained and the results are shown in Fig. 3.
Figure 3. Effect of concentration of internal reference solution on the electrode response at various thiocyanate concentrations in the range of 1.0×10⁻¹ M-1.0×10⁻³ M.
[image:8.596.117.464.377.639.2][image:9.596.146.452.191.341.2]
smooth functioning of the electrode system. Then conditioning time was studied by changing the time of being electrode in conditioning situation (Table 4). The obtained results showed the best Nernstian behavior was for 16 h.
Table 4. Conditioning time results for SMZ-PVC membrane electrode (10% modifier; -logC = 6 - 2; ) n=5).
r 2 Slope (mV.decade-1)
t (h)
0.9893 ± 0.0377 38.0 ± 0.9
4
0.9877 ± 0.0438 39.9 ± 1.6
6
0.9699 ± 0.0069 40.9 ± 0.9
8
0.9899 ± 0.0066 46.7 ± 0.4
10
0.9901 ± 0.0038 49.9 ± 0.9
12
0.9870 ± 0.0080 59.3 ± 0.9
*16
0.9982 ± 0.0723 52.4 ± 0.9
18
0.9191 ± 0.0132 53.8 ± 1.2
24
0.9694 ± 0.0066 55.5 ± 0.9
48
3.5. Effect of pH
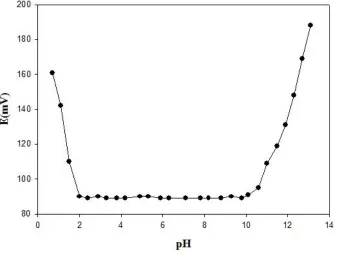
The influence of pH of the test solution (1.0×10⁻³ M thiocyanate) on the potential response of the SMZ-membrane sensor was tested in the pH range 1.1–13.1 (adjusted with either HCl or NaOH) and the results are shown in Fig. 4.
[image:9.596.123.460.476.729.2]
As seen, the membrane electrode can be suitably used in the pH range 2.0–10.1. A pH of 6.0 was adjusted with 0.1 mol L−1 acetic acid-acetate buffer was used for further studies. However, drastic potential changes are observed at higher and lower pH values. This is most probably due to the simultaneous response of the electrode to SCN− and OH−, at pH > 10.1, and some ionophore protonation and consequent diminished responsivity to SCN− and/or simultaneous response to thiocyanate and chloride ions, at pH < 2.0.
3.6. Effect of ionic strength on the response of the electrode
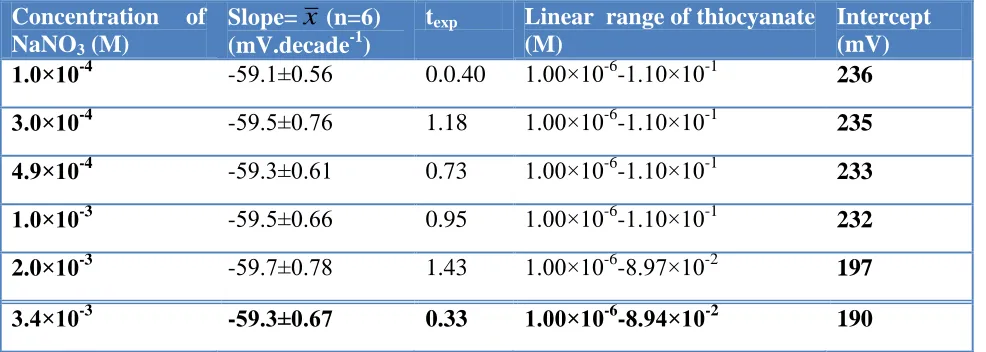
[image:10.596.55.548.317.493.2]The effect of ionic strength (1.0×10⁻⁴ to 3.4×10⁻³ M NaNO3) on the calibration curve of the SMZ-PVC electrodes was investigated and the obtained results are listed in Table 5.
Table 5. Effect of ionic strength on optimized SMZ-PVC membrane electrode response.
Concentration of NaNO3 (M)
Slope=x (n=6) (mV.decade-1)
texp Linear range of thiocyanate
(M)
Intercept (mV)
1.0×10⁻⁴
-59.1±0.56 0.0.40 1.00×10⁻⁶-1.10×10⁻¹ 236 3.0×10⁻⁴
-59.5±0.76 1.18 1.00×10⁻⁶-1.10×10⁻¹ 235 4.9×10⁻⁴
-59.3±0.61 0.73 1.00×10⁻⁶-1.10×10⁻¹ 233 1.0×10⁻³
-59.5±0.66 0.95 1.00×10⁻⁶-1.10×10⁻¹ 232 2.0×10⁻³ -59.7±0.78 1.43 1.00×10⁻⁶-8.97×10⁻² 197 3.4×10⁻³
-59.3±0.67 0.33 1.00×10⁻⁶-8.94×10⁻² 190 Note: t 0.05, 5 =2.57 (Ref. 35)
The electrode response has a Nernstian slope with linear range of 1.00×10⁻⁶
3.7. Effect of temperature
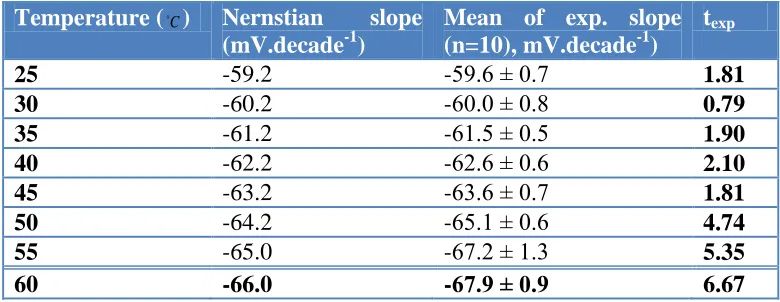
[image:11.596.103.493.204.355.2]To investigate the thermal stability of the electrode, calibration curves (Ecell versus log aSCN-) were constructed at different temperatures covering the range 25–60 ◦C. The electrode exhibited good Nernstian behavior in the range of 25–45 ◦C. The results are shown in Table 6.
Table 6. Effect of temperature on optimized SMZ-PVC electrode behavior.
Temperature (C) Nernstian slope (mV.decade-1)
Mean of exp. slope (n=10), mV.decade-1)
texp
25 -59.2 -59.6 ± 0.7 1.81
30 -60.2 -60.0 ± 0.8 0.79
35 -61.2 -61.5 ± 0.5 1.90
40 -62.2 -62.6 ± 0.6 2.10
45 -63.2 -63.6 ± 0.7 1.81
50 -64.2 -65.1 ± 0.6 4.74
55 -65.0 -67.2 ± 1.3 5.35
60 -66.0 -67.9 ± 0.9 6.67
Note: t 0.05, 9 =2.26 (Ref. 35)
Experimental slope calculated from Eq. (3) which is applicable to any temperature:
(3)
where n is the valancy, R, T and F are the universal gas constant, the absolute temperature and the Faraday constant.
The Nernstian and experimental slope values at each temperature were compared statistically, showing conformity of the slopes for 10 replicates. The results prove the validation of the obtained results with the expected values in the temperature range of 25–45 ◦C. However, at temperatures higher than 45 ◦C the slopes show a significant deviation from the theoretical values. This deviation may be related to desorption of the surfactant from SMZ and destruction of the electrode surface.
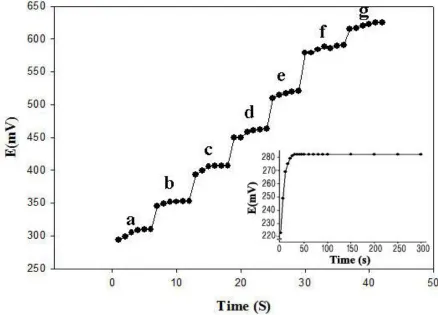
3.8. Response time
The potential generated by the membrane (when it’s remained constant in one solution of thiocyanate) remained constant for 5 min, after which it started slow deviating (−0.5% per min).
Figure 5. Response time of the SMZ-PVC to different concentration of thiocyanate (pH=5.5) in the range of 1×10⁻⁷ to 6×10⁻¹ M (in sequence of “g” to “a” in figure), (Inset: Static response time of the proposed membrane electrode towards SCN- ions)
The static response time of the membrane electrode thus obtained was <10 s. The potential reading stays constant, to within ±1mV, for at least 5 min (the inset of Fig. 5).
3.9. Definition of interference (Selectivity coefficients)
[image:12.596.65.503.133.448.2]
and interfering ions. The potentiometric selectivity coefficients of the proposed electrode, in the optimized analytical procedure, are calculated using the following equation [37] and summarized in Table 7:
(4)
[image:13.596.72.524.290.422.2]Where is the potentiometric selectivity coefficient, Ei the measured cell potential at primary ion activity ai (SCN-), Ej the measured cell potential at interference ion activity aj, n and m are the charges of the primary and interference ion, respectively. R, T and F have their common meaning.
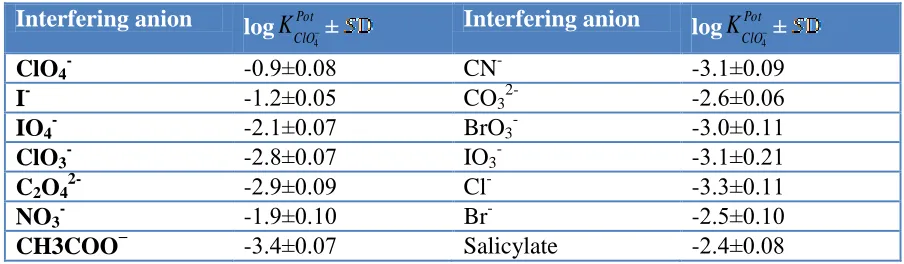
Table 7. Potentiometric selectivity coefficients of various interfering anions (n=4).
Interfering anion log Pot ClO
K 4±
Interfering anion log Pot ClO
K 4 ±
ClO4- -0.9±0.08 CN- -3.1±0.09
I- -1.2±0.05 CO32- -2.6±0.06
IO4- -2.1±0.07 BrO3- -3.0±0.11
ClO3- -2.8±0.07 IO3- -3.1±0.21
C2O42- -2.9±0.09 Cl- -3.3±0.11
NO3- -1.9±0.10 Br- -2.5±0.10
CH3COO− -3.4±0.07 Salicylate -2.4±0.08
ClO4- > I- > NO3- > IO4- > Salicylate> Br- > CO32-> ClO3-> C2O42- > BrO3->IO3- = CN
-As can be seen, of the different anions tested, the largest sensitivity was obtained for thiocyanate, perchlorate, iodide, nitrate and periodate. a poorer response was observed with salicylate and the responses to other anions were practically negligible.
The selectivity sequence follows the Hofmeister Series (the selectivity based solely on lipophilicity of anions) [38], (ClO4− > SCN− > I− >NO3− >Br− >Cl− >HCO3− >CH3COO− >SO42− >HPO42−) although some slight deviations might be interpreted because of some preferential coordination of this ionophore with certain anions.
3.10. Response characteristics of the electrode
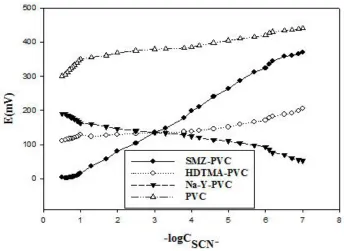
Using the optimized composition and conditions described above, the critical response characteristics of the electrode were assessed according to IUPAC recommendations [39]. The emf response of the electrode to varying concentrations of thiocyanate species indicates a linear range from 1.00×10⁻⁶
random errors. On the other hand, the proposed SMZ membrane electrode is applicable to measure SCN− anion in aqueous solutions. The lower and upper detection limits were 8.33×10⁻⁷ and 0.13 M, respectively.
Figure 6. Potentiometric response of the proposed electrodes toward thiocyanate.
Long term stability of the electrode was investigated by taking the response of the optimized electrode in a period of 30 days. Potentiometric measurements were performed every day during the first week and then every three days for the rest of the period. The electrode retained its full activity during this period. The relative standard deviations (RSD) of a single electrode (within electrode variation) were determined every 30 s during a period of 0-120s, (n=5). This process was repeated 10 times. The RSD values were between 0.5 and 1.4%. The small relative standard deviations (0.2–1.0%) and hence good repeatability of the electrodes indicates that the PVC membrane is homogeneous.
The reproducibility of the potentiometric response of the optimized electrode was also investigated by carrying the measurements on four independent electrodes with the same composition. These measurements were also performed in 10 replicates. The obtained relative standard deviation (between electrode variations) was less than 1.5%. The validity of results was investigated by “g” value statistical test, g-test [35], as:
2 2 2 2 1
2
...sk s
s
s highest g
(5)
[image:14.596.121.465.148.399.2]
0.5017 (4 class, 10 replicate in each class) [35] indicating that there is no significant difference between the behavior of the four independent electrodes and those compositions are homogeneous.
Table 8. Comparison of some characteristics of the proposed electrode with previous SCN− ISEs.
Ref. Slope
(mVdecade−1)
Working pH range
Linear range (M) DL (M) Ionophore
Proposed electrode
−58.9 ± 0.9 2.0–10.1 1.00×10⁻⁶–1.01×10⁻¹ 8.33×10⁻⁷ SMZ
[40] -56.3 2.0-8.0 6.0×10⁻⁶–1.0×10⁻² 5. 0×10−6 Tetra-midepyridine [40] -58.3 2.0-8.0 1.0×10⁻⁵–1.0×10⁻² 5. 0×10−6 Hexa-imidepyridine [41] -57.0 5.0 9.0×10⁻⁷–1.0×10⁻¹ 7.0×10⁻⁷ [Cu(II)2-BBSTA] [42] -56.5 3.5–8.5 1.0×10⁻⁶–1.0×10⁻¹ 7.0×10⁻⁷ [Zn(BDSH)]
[43] -58.7 3.0–8.0 1.0×10⁻⁵–1.0×10⁻¹ 4.0×10⁻⁶ Rh[(trpy)(bpy)Cl](PF6)2 [44] -57.6 3.9–9.2 1.0×10⁻⁶–1.0×10⁻¹ 5.0×10⁻⁷ CCT
[44] -58.7 4.3–9.8 1.0×10⁻⁶–1.0×10⁻¹ 5.7×10⁻⁷ NOBP
[45] -52.0 2.0–3.0 3.0×10⁻⁵–1.0×10⁻¹ 2.5×10⁻⁵ Calix[4]arene
Some response characteristics of the proposed electrode compared with other thiocyanate selective electrodes and the obtained results are summarized in Table 8. As can be seen from Table 8, in some cases, selectivity coefficient and dynamic linear range that were obtained for the proposed electrode are superior and comparable to those reported previously for other thiocyanate-selective membrane electrodes based on variety of different ionophores. It is important to note that in all cases in Table 8, response time, stability and electrode response independent pH range for the proposed SMZ-PVC are much better than those reported for other compared electrodes. The SMZ-PVC has applicability in a wide pH range (2.0–10.1), for acidic to basic solutions. High stability of the electrode is another advantage of proposed electrode that it in turn causes an increasing of precision. In investigation of reproducibility and repeatability, the RSD values for our SMZ-PVC (1.3–2.4%) are smaller than others (2–5%). This shows the SMZ-PVC has a better precision.
3.11. Practical application
The optimized membrane thiocyanate electrode was successfully used for potentiometric determination of SCN− via Ag+ titrations. Fig. 7 shows the titration curve of 10mL of a 1.0×10⁻² M thiocyanate solution titrated with 1×10⁻²
[image:15.596.17.574.159.339.2][image:16.596.122.455.73.325.2]
Figure 7. Potentiometric titration curve for 10 ml of 1.0× 10⁻² M SCN- solution with 1.0 ×10⁻² M AgNO3 using the proposed sensor as an indicator electrode (n=5).
Table 9. Determination of thiocyanate in drinking and river water.
Samples Added thiocyanate ( ml / g μ ) Foundet thiocyanate ( ml / g μ ) Recovery(%)
Tap Water of Isfahan -0 -1.4 0.21 ± 1.33 95.0 2.3 0.44 ± 2.15 93.5 3.0 0.32 ± 2.92 97.3 5.3 0.45 ± 5.23 98.1
The River Water of Zayandeh Rood in
Isfahan -0 -10.1 0.23 ± 10.16 100.6 15.3 0.55 ± 15.14 99.3 20.2 0.35 ± 20.0 1 99.1 25.4 0.88 ± 25.12 98.9 4. CONCLUSIONS
[image:16.596.66.529.423.603.2]
ACKNOWLEDGMENT
We wish to acknowledge the financial support from the Research Council of Islamic Azad University, Shahreza Branch.
References
1. V. K. Gupta, R. N. Goyal, and R. A. Sharma, Int. J. Electrochem. Sci., 4 (2009) 156
2. S. S. Hassan, M. H. Abou Ghalia, A. G. E. Amr, and A. H. K. Mohamed, Anal. Chim. Acta, 482 (2003) 9
3. T. Poursaberi, M. Salavati-Niasari, S. Khodabakhsh, L. Haji-agha Babaei, M. Yousefi, S. Rouhani, and M. R. Ganjali, Anal. Lett., 34 (2001) 2621
4. M. R. Ganjali, T. Poursaberi, F. Basiripour, M. Salavati-Niasari, M. Yousefi, and M. Shamsipur, J. Anal. Chem., 370 (2001) 1091
5. M. K. Amini, A. Rafi, M. Ghaedi, M. H. Habibi, and M. M. Zohory, Microchem. J., 75 (2003) 143 6. A.Abbaspour, M. A. Kamyabi, A. R. Esmaeilbeig, and R. Kia, Talanta, 57 (2002) 859
7. M. M. Ardakani, A. A. Ensafi, M. Salavati-Niasari, and S. Mihoseini Chahooki, Anal. Chim. Acta, 462 (2002) 25
8. X. Huang, Y. Chai, R. Yuan, X. Wang, and Q. Li, Anal. Sci., 20 (2004) 1185
9. M. R. Ganjali, M. Yousefi, M. Javanbakht, T. Poursaberi, M. Salavati-Niasari, L. Haji-agha Babaei, E. Latifi, and M. Shamsipur, Anal. Sci., 18 (2002) 887
10.J. Y. Dai, Y. Q. Chai, R. Yuan, Y. S. Zhang, Y. Liu, X. Zhong, and D. P. Tang, Chem. Lett., 34 (2005) 62
11.T. Poursaberi, M. Hosseini, M. Taghizadeh, H. Pirelahi, M. Shamsipur, and M. R. Ganjali, Microchem. J., 72 (2002) 77
12.M. R. Ganjali, T. Poursaberi, M. Hosseini, M. Salavati-Niasari, M. Yousefi, and M. Shamsipur, Anal. Sci., 18 (2002) 289
13.M. R. Ganjali, A. Daftari, F. Mizani, and M. Salavati-Niasari, Bull. Korean Chem. Soc., 24 (2003) 14.M. Shamsipur, M. Yousefi, M. Hosseini, M. R. Ganjali, H. Sharghi, and H. Naemi, Anal. Chem.,
73 (2001) 2869
15.M. Shamsipur, M. Yousefi, M. R. Ganjali, T. Poursaberi, and M. Faal-Rastgar, Sensor Actuator B, 82 (2002) 105
16.M. R. Ganjali, V. Akbar, A. Daftari, P. Norouzi, H. Pirelahi, and A. Mouradzadegan, J. Chin. Chem. Soc., 51 (2004) 309
17.M. R. Ganjali, M. Ghorbani, A. Daftari, P. Norouzi, H. Pirelahi, and H. D. Dargahani, Bull. Korean Chem. Soc., 25 (2004) 172
18.M. R. Ganjali, F. Mizani, H. Pirelahi, M. Taghizadeh, and J. Amani, Can. J. Anal. Sci. Spect., 47 (2002) 157
19.M. R. Ganjali, M. R. Pourjavid, M. shamsipur, T. Poursaberi, M. Rezapour, M. Javanbakht, and H. Sharghi, Anal. Sci., 19 (2003) 995
20.M. R. Ganjali, M. Yousefi, T. Poursaberi, L. Naji, M. Salavati-Niasari, and M. Shamsipur, Electroanalysis, 18 (2003) 1476
21.M. Shamsipur, M. Javanbakht, A. R. Hassaninejad, H. Sharghi, M. R. Ganjali, M. F. Mousavi, Electroanalysis, 15 (2003) 1251
22.M. R. Ganjali, M. Rezapour, M. R. Pourjavid, and M. Salavati-Niasari, Anal. Sci., 19 (2003) 1127 23.M. Ghiaci, F. Seyedeyn-Azad, and R. Kia, Mater. Res. Bull., 39 (2004) 1257
24.R. Buck, and V. Cosofret, Pure Appl. Chem., 65 (1993) 1849
25.H. Robson, Verified Syntheses of Zeolitic Materials, Elsevier, Amsterdam, (2001)
27.A.Nezamzadeh-Ejhieh, and N. Masoudipour, Anal. Chim. Acta, 658 (2010) 68 28.Z. Li, and R. S. Bowman, Environ. Sci. Technol., 31 (1997) 2407
29.U. Wingenfelder, G. Furrer, and R. Schulin, Micropor. Mesopor. Mat., 95 (2006) 265
30.M. R. Ganjali, P. Norouzi, A. Atrian, F. Faridbod, S. Meghdadi, and M. Giahi, Mater. Sci. Eng. C, 29 (2009) 205
31.V. K. Gupta, A. K. Jain and G. Maheshwari, Int. J. Electrochem. Sci., 2 (2007) 102
32.M. R. Ganjali, R. Nemati, F. Faridbod, P. Norouzi, and F. Darviche, Int. J. Electrochem. Sci., 3 (2008) 1288
33.V. K. Gupta, R. N. Goyal and R. A. Sharma, Int. J. Electrochem. Sci., 4 (2009) 156 34.V. K. Gupta, M. Al Hayat, A. K. Singh and M. K. Pal, Anal. Chim. Acta, 634 (2009) 36
35.R. L. Anderson, Practical Statistics for Analytical Chemists, Van Nostrand Reinhold, New York, (1987)
36.G. Dimeski, Clin. Biochem. Rev. Suppl (i), 29 (2008) 43
37.Y. Umezawa, P. Buhlmann, K. Umezawa, K. Tohda, and S. Amemiya, Pure Appl. Chem., 72 (2000) 1851
38.F. Hofmeister, Arch. Exp. Patol. Pharmakol., 24 (1988) 247
39.G. G. Guibault, R. A. Durst, M. S. Frant, H. Freiser, E. H. Hansen, T.S. Light, E. Pungor, G. Rechnitz, N. M. Rice, W. Simon, and J. D. R. Thomas, Pure Appl. Chem., 48 (1976) 127
40.S. S. M. Hassan, M. H. A. Ghalia, A. G. E-Amr, and A. H. K. Mohamed, Anal. Chim. Acta, 482 (2003) 9
41.R. Yuan, X. L. Wang, L. Xu, Y. Q. Chai, Z. Y. Sun, X. Q. Huang, X. Q. Li, Q. Zhao, and L. Zhou, Electrochem. Commun., 5 (2003) 717
42.M. Mazloum-Ardakani, A. Sadeghi, and M. Salavati-Niassari, Talanta, 66 (2005) 837
43.M. Shamsipour, S. Ershad, N. Samadi, A. R. Rezvani, and H. Haddadzadeh, Talanta, 65 (2005) 991
44.M. R. Ganjali, H. A. Zamani, and F. Malekzadegan, Anal. Chim. Acta, 555 (2006) 336 45.S. Erden, A. Demirel, S. Memon, M. Yılmaz, E. Canel, and E. Kılıç, Sensor Actuator B, 113
(2006) 290