4-27-1999
Capillary electrophoresis-fluorescence line
narrowing system (CE-FLNS) for on-line structural
characterization
Ryszard J. Jankowiak
Iowa State University
Peter A. Shields
Iowa State University
Gerald J. Small
Follow this and additional works at:
http://lib.dr.iastate.edu/patents
Part of the
Chemistry Commons
This Article is brought to you for free and open access by the Iowa State University Research Foundation, Inc. at Iowa State University Digital Repository. It has been accepted for inclusion in Iowa State University Patents by an authorized administrator of Iowa State University Digital Repository. For more information, please contactdigirep@iastate.edu.
Recommended Citation
Jankowiak, Ryszard J.; Shields, Peter A.; and Small, Gerald J., "Capillary electrophoresis-fluorescence line narrowing system (CE-FLNS) for on-line structural characterization" (1999).Iowa State University Patents. 89.
for on-line structural characterization
Abstract
Capillary electrophoresis (CE) is interfaced with low temperature fluorescenceline-narrowing (FLN)
spectroscopy for on-line structural characterization of separated molecular analytes.
Keywords
Ames Laboratory, Vhrmidytu
Disciplines
Chemistry
J
ankowiak et al.
[45]
Date of Patent:
Apr. 27, 1999
[54] CAPILLARY ELECTROPHORESIS
FLUORESCENCE LINE NARROWING
SYSTEM (CE-FLNS) FOR ON-LINE
STRUCTURAL CHARACTERIZATION [75] Inventors: Ryszard J. J ankowiak; Gerald J.
Small, both of Ames, Iowa; Peter A.
Shields, Reading, Mass.
[73] Assignee: Iowa State University Research Foundation, Inc., Ames, Iowa
[21] Appl. No.: 08/870,952
[22] Filed: Jun. 6, 1997Related US. Application Data
[60] Provisional application No. 60/019,276, Jun. 7, 1996.
[51] Int. Cl.6 ... .. G01N 21/03
[52] . 356/318; 356/246; 356/344
[58] Field of Search ... .. 356/317, 318,
356/417, 344, 246; 204/601, 603
[56] References Cited
PUBLICATIONS
X.C. Huang et al., “Capillary Array Electrophoresis Using
Laser—EXcited Confocal Fluorescence Detection”, Anal. Chem, 64 , pp. 967—972 (1992).R. Jankowiak et al., “Capillary Electrohphoresis—Fluores
cence Line—Narrowing System for On—Line Structural Char
acterization of Molecular Analytes”, Anal. Chem, 68, pp.
2549—2553 (1996).
R. Jankowiak et al., “Capillary Electrophoresis—Fluores
cence Line—Narrowing System for On—Line Structural Char
acterization of Molecular Analytes”, Chemical Abstracts.,
125, p. 1304, Ref.No. 125:131244e (1996).
R. Jankowiak et al., “Fluorescence Line Narrowing: A High—Resolution Window on DNA and Protein Damage
from Chemical Carcinogens”, Chem. Res. Toxicol, 4, pp.
256—269 (1991).
R. J ankowiak et al., “Fluorescence Line Narrowing—Non photochemical Hole Burning Spectrometry: Femtomole
Detection and High Selectivity for Intact DNA—PAH Adducts”, Chem. Res. Toxicol, 1, pp. 60—68 (1988).
R. Jankowiak et al., “Laser Spectroscopic Studies of DNA
Adduct Structure Types from Enantiomeric Diol Epoxides of BenZo[a]pyrene”, Chem. Res. Toxicol, 3, pp. 39—46
(1990).
R. J ankowiak et al., “Spectral Hole—Burning Spectroscopy in Amorphous Molecular Solids and Proteins”, Chem Rev.,
93, pp. 1471—1502 (1993).
CE. KientZ et al., “Eluent Jet Interface for Combining Capillary Liquid Flows with Electron Impact Mass Spec trometry”, Anal. Chem, 68, pp. 675—681 (1996).
W.—H. Kim et al., “Hyperquenched Glassy Films of Water:
A Study by Hole Burning”, J. Phys. Chem, 99, pp. 7300—7310 (1995).
W.G. Kuhr, “Capillary Electrophoresis”, Anal. Chem, 62, pp. 403 R—414 R (1990).
T.T. Lee et al., “High—Sensitivity Laser—Induced Fluores cence Detection of Native Proteins in Capillary Electro phoresis”, Journal of Chromatography, 595, pp. 319—325
(1992).
T.T. Lee et al., “Quantitative Determination of Native Pro
teins in Individual Human Erythrocytes by Capillary Zone Electrophoresis with Laser—Induced Fluorescence Detec
tion”, Anal. Chem, 64, pp. 3045—3051 (1992).
(List continued on neXt page.)
Primary Examiner—Richard A. Rosenberger
Attorney, Agent, or Firm—Meuting, Raasch & Gebhardt,
PA.
[57] ABSTRACT
Capillary electrophoresis (CE) is interfaced with low tem
perature ?uorescence line-narrowing (FLN) spectroscopy
for on-line structural characterization of separated molecularanalytes.
29 Claims, 12 Drawing Sheets
PUBLICATIONS
K.—M. Li et al., “Identi?cation and Quantitation of DibenZo
[a,l]pyrene—DNA Adducts Formed by Rat Liver Microsomes in Vitro: Preponderance of Depurinating
Adducts”, Biochemistry, 34, pp. 8043—8049 (1995).
L. Licklider et al., “On—Line Microreactors/Capillary Elec
trophoresis/Mass Spectrometry for the Analysis of Proteins and Peptides”, Anal. Chem, 67, pp. 4170—4177 (1995). IS. Lurie, “Analysis of Seized Drugs by Capillary Electro phoresis”, Analysis ofAddictive and Misused Drugs, edited
by John A. Adamovics; Pub. by Marcel Dekker, Inc., NeW York, NY (1995), pp. 151—219.
R.E. Milofsky et al., “Native Fluorescence Detection of
Nucleic Acids and DNA Restriction Fragments in Capillary
Electrophoresis”, Anal. Chem, 65, pp. 153—157 (1993).
L. Nakhimovsky et al., “Handbook of LoW Temperature
Electronic Spectra of Polycyclic Aromatic Hydrocarbons”,
Physical Science Data 40, Table of Contents, pp. xi—xiii.
S. Nie et al., “Ultrasensitive Fluorescence Detection of Polycyclic Aromatic Hydrocarbons in Capillary Electr phoresis”, Anal. Chem, 65, pp. 3571—3575 (1993).
R1. Personov, “Site Selection Spectroscopy of Complex Molecules in Solutions and Its Applications”, Spectroscopy and Excitation Dynamics of Condensed Molecular Systems,
North—Ho1land Publishing Company, Chapter 10, pp. 555—619 (1983).
E.G. Rogan et al., “Identi?cation and Quantitation of BenZo [a]pyrene—DNA Adducts Formed in Mouse Skin”, Chem.
Res. Toxicol., 6, pp. 356—363 (1993).
M.J. Sanders et al., “Identi?cation of Polycyclic Aromatic Hydrocarbon Metabolites in Mixtures Using Fluorescence
Line NarroWing Spectrometry”, Anal. Chem, 57, pp. 1148—1152 (1985).
J.B. Shear et al., “Automated Velocity Programming for
Increased Detection Zone Residence Times in Capillary Electrophoresis”, Anal. Chem, 65, pp. 3708—3712 (1993). J.B. Shear et al., “Optimizing Fluorescence Detection in
Chemical Separations for Analyte Bands Traveling at Dif
ferent Velocities”, Anal. Chem, 65, pp. 2977—2982 (1993).
Y. Shi et al., “Capillary Zone Electrophoresis of Neutral
Organic Molecules in Organic—Aqueous Solution”, Jour nal of High Resolution Chromatography, 17, pp. 713—718
(1994).
Y. Shi et al., “HPCZE of Nonionic Compounds Using a
Novel Anionic Surfactant Additive”, Anal. Chem, 67, pp.
3023—3027 (1995).
M. Suh, “Conformational studies of the (+)—trans, (—)—trans,
(+)—cis, and (—)—cis adducts of anti—benZo[a]pyrene diole
poxide to N2—dG in duplex oligonucleotides using polyacry
lamide gel electrophoresis and loW—temperature ?uores cence spectroscopy”, Biophysical Chemistry, 56, pp. 281—296 (1995).M. Suh et al., “Flanking Base Effects on the Structural
Conformation of the (+)—trans—anti—benZol[a]pyrene diole
poxide adduct to N2—dG in Sequence—De?ned Oligonucle otides”, Carcinogenesis, 15, pp. 2891—2898 (1994). M. Suh et al., “Formation and Persistence of BenZo[a]
pyrene—DNA Adducts in Mouse Epidermis in vivo: Impor tance of Adduct Conformation”, Carcinogenesis, 16, pp.
2561—2569 (1995).
H.SWerdloW et al., “Three DNA Sequencing Methods Using Capillary Gel Electrophoresis and Laser—Induced Fluores
cence”, Anal. Chem, pp. 2835—2841 (1991).
J. Tehrani et al., “Capillary Electrophoresis: An Integrated System With a Unique Sp1it—FloW Sample Introduction
Mechanism”, Journal of High Resolution Chromatography, 14, pp. 10—14 (1991).
S. Terabe et al., “Electrokinetic Chromatography With Micellar Solution and Open—Tubu1ar Capillary”, Anal.
Chem, 57, pp. 834—841 (1985).
S. Terabe et al., “Electrokinetic Separations With Micellar Solutions and Open—Tubu1ar Capillaries”, Anal. Chem, 56,
pp. 111—113 (1984).
S. Terabe et al., “Separation of highly hydrophobic com
pounds by cyclodextrin—modi?ed miceller eletrokinetic chromatography”, Journal of Chromatography, 516, pp. 23—30 (1990).
I.B. Weinstein et al, “BenZo[a]pyrene Diol Epoxides as
Intermediates in Nucleic Acid Binding in vitro and in vivo”,
Science, 193, pp. 592—594 (1976).
JD. Winefordner et al., “Solvents for Phosphorimetry”,
Analytical Chemistry, 35, pp. 2211—2222, 2212 (1963).
D. ZamZoW et al., “Capillary electrophoresis—?uorescence line narroWing (CE—FLN) system for DNA adduct charac
teriZation”, from the book distributed at the Jun. 9—13 meeting of DNA Adducts and Mutations in Human Biomoni toring, Karolinska Institutet, Stockholm, SWeden (1996). R. J ankoWiak et al., “Conformational Studies of Stereoiso meric Tetrols Derived from syn— and anti—DibenZo[a,1]
pyrene Diol Epoxides”, Chemical Research in Toxicology,
10, pp. 677—686 (1997).
D. ZamZoW et al., “Capillary E1ectrophoresis—F1uores
cence Line—NarroWing (CE—FLN) System for DNAAdduct
CharacteriZation”,Mol. Cryst. Liq. Cryst., 291, pp. 155—162
(1996).
CA. Angell et al., “Glass—Forming Composition Regions
and Glass Transition Temperatures for Aqueous Electrolyte
Solutions”, The Journal of Chemical Physics, 52, pp. 1058—1068 (1970).
F. Ariese et al., “Conformational Studies of Depurinating DNA Adducts from syn—DibenZo[a,1]pyrene Diolepoxide”, Carcinogenesis, 17, pp. 829—837 (1996).
RS. BroWn et al., “Cyc1odextrin—Modi?ed Capillary Elec
trophoresis: Determination of Polycyclic Aromatic Hydro
carbons in Contaminated Soils”, Anal. Chem, 68, pp.
287—292 (1996).
D. Chen et al., “Sing1e—Molecule Detection in Capillary
Electrophoresis: Molecular Shot Noise as a Fundamental
Limit to Chemical Analysis”,Anal. Chem, 68, pp. 690—696
(1996).
DB. Craig, “Detection of Attomolar Concentrations of
Alkaline Phosphatase by Capillary Electrophoresis Using
Laser—Induced Fluorescence Detection”, Anal. Chem, 68, pp. 697—700 (1996).
PD. Devanesan et al., “Identi?cation and Quantitation of
7,12—DimethylbenZ[a]anthracene—DNA Adducts Formed in Mouse Skin”, Chem. Res. Toxicol., 6, pp. 364—371 (1993). B. Hogan et al., “Determination of Intracellular Species at the Level of a Single Erythrocyte via Capillary Electro phoresis With Direct and Indirect Fluorescence Detection”,
Anal. Chem, 64, pp. 2841—2845 (1992).
B. Hogan et al., “Sing1e—ce1l Analysis at the Level of a
Single Human Erythrocyte”, Trends in Analytical Chemis
(
mwom
Fig. 2a
256
2|6 235
(
24521
236 \ 225
206/
\zos
204) [203 >
202
‘
Fig. 2b
2|3
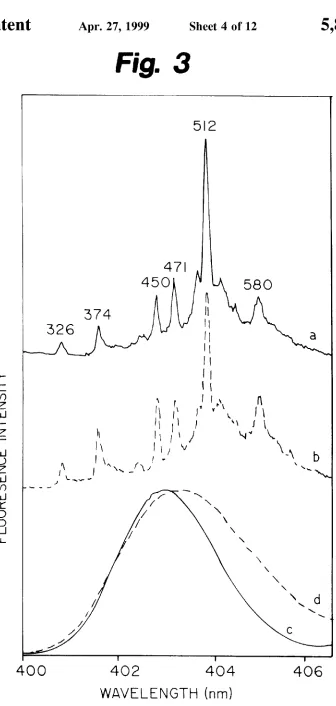
Fig. 3
FLUORESENCE INTENSITY
326
47|
450
374
[image:8.557.117.453.37.743.2]Fig. 43
II
IV V
I
III
7
a
9
lb
n
TIME (MINUTES)
Fig. 4b
A
(0,0)11
)
AllSNlLNI HUNT-38380015
/
'
37o
/
4|o
45o
mmm
0mm
m+m
0mm
i
mmv
wmv
mwm
\<
wmm
wwv
M
2
9v
:
mmv
.wmm
mmv
mam
Fig. 6
9L“)
k
E,
(c)
(b)
,
(a)
370
372
574
WAVELENGTH (nm)
Fig. 7a
a
b
\
4'4
46
48
Fig. 7b
47|
45‘
558
(c)
I T I
400
464
408
WAVELENGTH (nm)
Fig. 7c
I I T
400
464
408
[image:12.557.189.377.62.745.2] [image:12.557.191.378.80.406.2]Fig. 8a
11
4'4
4'8
TIME (MINUTES)
Fig. 8b
534
556
497
453
749
698
847
376
378
380
[image:13.557.190.377.54.735.2]Fig. 8c
580
400
4532
4'04
406
WAVELENGTH (nm)
Fig. 93
II
30
'
4o
'
50
[image:14.557.185.392.61.419.2] [image:14.557.188.364.463.737.2]Fig. 9b
II
30
1
4'0
'
50
TIME (MINUTES)
Fig. 9d
444
5l9
353
298
II
420
‘
4‘24
'
42a
WAVELENGTH (nm)
42o
'
4'24
'
42s
[image:15.557.327.494.333.572.2] [image:15.557.92.261.488.731.2]Fig. 103
III
IV
35
Fig. 10b
40
45
TIME (MINUTES)
439
522
392
36
\
350
4051
w
42:
4'23 '
4'25 '
427
[image:16.557.139.417.54.725.2]FLUORESCENCE LINE NARROWING
SYSTEM (CE-FLNS) FOR ON-LINE
STRUCTURAL CHARACTERIZATION This application claims the bene?t of US. Provisional
Application No. 60/019276, ?led Jun. 7, 1996.
STATEMENT OF GOVERNMENT RIGHTS
This invention Was made With government support under
grants from the United States Department of Energy (Contract No. W-7405-Eng-82). The US. government has certain rights in this invention.
BACKGROUND OF THE INVENTION
Capillary electrophoresis (CE) is a Widely used analytical and bioanalytical separation technique. It is also ?nding
considerable use in biomedical research With neW applica
tions continually emerging. Capillary electrophoresis has
been used for analysis of amino acids, peptides, proteins, nucleic acid bases, DNA oligonucleotides and numerousorganic molecules. Both small ions and large biomolecules can be separated (J. Tehrani et al., High Res. Chr0m, 14, 10—14 (1991)). Electrophoresis is a poWerful approach for
gene mapping (R. Milofsky et al.,Anal. Chem, 65, 153—157 (1993)); x. Huang et al.,Anal. Chem, 64, 967—972 (1992))
and DNA sequencing SWerdloW et al.,Anal. Chem, 63,
2835—2841 (1991)). Recently, the chemical analysis of indi
vidual cells by CE has attracted much attention (B. Hogan et al., Anal. Chem., 64, (1992); B. Hogan et al., TrendsAnal.
Chem, 12, 4—9 (1993)).
Polycyclic aromatic hydrocarbons (PAH) constitute a
potent class of chemical carcinogens. The ability to analyZe
PAH in small volumes at attomole levels opens many
opportunities for studying intracellular uptake, metabolism, and carcinogen-DNA adduct formation, all of Which are important factors in mutagenesis and tumorigenesis. Various
protocols for separation of PAH by CE have already been established. In micellar electrokinetic capillary chromatography, introduced by Terabe et al. (S. Terabe et al., Anal. Chem, 56, 111—116 (1984); S. Terabe et al., Anal. Chem, 57, 834—839 (1985); S. Terabe et al, J. Chr0m, 516,
23—31 (1990)), micelles Were used as a pseudophase. Nie et
al. (S. Nie et al., Anal. Chem, 65, 3571—3575 (1993)) developed an approach based on solvophobic association of PAH analytes With tetraalkylammonium ions in a mixed
acetonitrile-Water solvent. Yan and coWorkers (T. Lee,Anal.
Chem, 64, 3045—3051 (1992)) demonstrated that capillary
electrochromatography can be used for separation of priority PAH. Shi and FritZ (Y. Shi et al., Anal. Chem, 67, 3023—3027 (1995); Y. Shi et al,.IHigh Res. Chrom, 117, 713 (1994)) established that excellent separation of PAH by CE
can be achieved by the addition of sodium dioctyl sulfos
uccinate (DOSS) to an acetonitrile-Water electrolyte. Very recently, BroWn et al. (R. S. BroWn et al.,Anal. Chem, 68,
287—292 (1996)) described a separation method for PAH
using cyclodextrin-modi?ed CE. All these approaches are
able to detect PAH at sub-femtomole levels, a detectability
required, for example, in the study of PAH-induced carcino
genesis.
In CE, analyte molecules are typically probed, i.e.,
detected, only brie?y as they traverse detection Zones
located either on-line or in a post-column ?oW cell. The
narroWness of this temporal detection WindoW effectively
limits the signal to noise ratio (J. Shear et al.,Anal. Chem, 65, 3708—3712 (1993)). The most Widely used detection
10 15 20 30 35 40 45 50 55 60 65
limited. Fluorescence, particularly laser-induced ?uores cence (LIF), has also been used for detection, outperforming absorbance in sensitivity of detection by several orders of magnitude. HoWever, the brief time available for determi
nation of an analyte also poses a problem for LIF detection,
especially When loW intensity continuous Wave (CW) lasers incapable of providing high induced absorption rates are
used (J. Shear et al., Anal. Chem, 65, 2977—2982 (1993)).
Zare and coWorkers (J. Shear et al, Anal. Chem, 65,
3708—3712 (1993)) shoWed that velocity programming for
increased detection Zone residence times in CE is necessary
to improve both the accuracy of quantitation and detection
limits. The use of intense pulsed lasers in CE-LIF for the
analysis of molecular analytes at ambient temperature pro duces a stronger detectable signal, but is accompanied by
problem of analyte photodegradation.
Efforts to improve analyte resolution in CE are also
important, particularly as detection sensitivity increases. In
the case of CE-LIF, hoWever, the emphasis has been on laser-induced ?uorescence providing superior detection limits, i.e., analyte resolution is still provided by CE. At best, LIF With detection at ambient temperature can provide only
very limited spectral resolution due to large vibronic ?uo rescence bandWidths (about 500 cm_1). Resolution betWeen monomethylated isomers of a PAH Would, for example, have to be provided by the physical separation process of
CE.
It is Well-recognized that analysis of chemically complex samples often requires a tWo-step analytical approach
(separation folloWed by analyte characteriZation). Research
involving analytical separation methods such as high per
formance liquid chromatography (HPLC) and CE has been
greatly advanced by recent efforts to couple these separation techniques With sensitive spectroscopic methods that go
beyond simple detection of molecular analytes by producing
structural information about the separated analytes. For example, HPLC has been coupled With NMR spectroscopy for direct analysis of complex mixtures from both synthetic and biological origins. Interfacing CE With mass spectros copy (MS) has been demonstrated; and capillary Zone elec trophoresis coupled With electrospray MS has been used for separation and subsequent detection of DNA adducts. Cap illary electrochromatography has been coupled to MS for
analysis of pharmaceutical drugs.
The utility of laser-induced ?uorescence detection of
molecular analytes is Well-established. HoWever, its use as a
detection method in CE has been limited by the brief time
available for interrogation of an analyte, and, When pulsed
lasers are used at ambient temperature, photodegradation of
the separated analytes. Further, laser-induced ?uorescence at
ambient temperature does not provide structural information about the analytes of interest. There is, therefore, a need in the art for a system that successfully interfaces ?uorescence spectroscopy With a capillary electrophoresis apparatus in a
manner and under conditions that alloW structural charac
teriZation of closely related analytes.
SUMMARY OF THE INVENTION
The present invention provides a system for use in cap
illary electrophoresis that utiliZes a specially designed cap
illary cryostat containing an optically accessible sample chamber to facilitate loW-temperature laser-induced ?uores
cence spectroscopic analysis of separated analytes. In addi
tion to the capillary cryostat, the system includes a spectrally
?uorescence emission from the target species, and a
Wavelength-dispersive detection system positioned to detect ?uorescence emission from the target species.
The capillary cryostat of the invention includes a capillary
having a transparent annular Wall forming the interior por
tion for placement of the target species, and a capillary
encasement having a transparent portion that surrounds at
least a portion of the transparent annular capillary Wall, thus
forming the optically accessible sample chamber. Acryogen
delivery line is operatively connected to the capillary
encasement at an inlet end, and an exit line is operatively connected to the capillary encasement at an outlet end. A
stress relief means is provided proximal to the inlet end of the capillary encasement for reducing turbulence of a cryo
gen entering the capillary encasement.
The invention further provides a method for performing
capillary electrophoresis of a sample containing a ?uores
cent target species comprising:
(a) providing a capillary cryostat comprising:
(i) a capillary comprising a transparent annular Wall;
and
(ii) a capillary encasement comprising a transparent portion, Wherein at least a portion of the transparent
annular Wall of said capillary is surrounded by the transparent portion of the capillary encasement to form an optically accessible sample chamber; said
capillary encasement further comprising a transpar ent annular Wall forming a lumen surrounding the
portion of the transparent annular Wall of said cap illary that is surrounded by the transparent portion of
the capillary encasement;
(b) electrophoresing the sample through the capillary to position the target species in the optically accessible
sample chamber;
(c) freezing the target species by introducing a cryogen
into the lumen of the capillary encasement;
(d) irradiating the froZen target species to induce ?uores
cence emission from target species; and (e) detecting the ?uorescence emission.
The method can be used to obtain non-line narroWing (NLN) spectra (preferably at 77K using liquid nitrogen as the cryogen) and ?uorescence line narroWing (FLN) spectra
preferably at 4.2K using liquid helium as the cryogen). These spectra can be analyZed by comparing the resulting high resolution FLN ?ngerprint spectra of a target species With available libraries containing FLN spectra of standard
compounds to obtain structural information about the sepa rated analytes.
The present invention permits on-line, high resolution ?uorescence spectroscopy of electrophoretically separated analytes by alloWing loW temperature excitation and detec
tion. ImmobiliZation of the electrophoretically separated
analytes, by freeZing, alloWs spectroscopic interrogation for
essentially unlimited periods of time. On-line structural
characteriZation of closely related analytes using ?uores
cence line-narroWing spectroscopy (FLNS) can thereby be
achieved.
BRIEF DESCRIPTION OF THE DRAWINGS FIG. 1 is a schematic diagram of a CE-FLN system used
for structural characteriZation of molecular analytes; HV,
high voltage; GND, ground.
FIG. 2 is a schematic diagram of a capillary cryostat. FIG. 2A is a schematic enlargement of an inlet portion of a capillary cryostat.
10 15 20 25 30 35 40 45 50 55 60 65
a capillary cryostat.
FIG. 3 depicts FLN spectra of B[a]P in (a) ethanol and (b) the CE buffer, obtained at 4.2K for an excitation Wavelength
of 395.7 nm. Modes are labeled With their excited state
vibrational frequencies in cm_1. NLN ?uorescence origin
bands of B[a] in ethanol and CE-buffer matrices are shoWn as spectra (c) and (d), respectively.
FIG. 4 depicts a three-dimensional plot of NLN ?uores cence spectra obtained by translating the capillary through the laser excitation and ?uorescence observation region for
l-hydroxyprene (I) and pyrene (II). Laser excitation Wave length 308 nm, T=77K, translation speed 0.65 mm/sec. Each
trace represents a 1 second integrated ?uorescence signal. Fluorescence (0,0) origin bands are indicated. ShoWn in the inset is the ?uorescence electropherogram for the 5-PAH
mixture, generated from the three-dimensional plots of NLN ?uorescence vs. capillary position. Buffer, 40 mM sodium
dioctyl sulfrosuccinate, 8 mM sodium borate, 30% (v/v) acetonitrile in Water, pH 9; capillary length, 95 cm; applied
voltage, 25 kV; current, 60 MA. The labeled peaks are
l-hydroxyprene (1), pyrene (II), B[a]A (III), B[e]P (IV), and
B[a]P
FIG. 5 depicts FLN spectra of the CE-separated analytes:
l-hydroxyprene (I), pyrene (II), B[a]A (III), B[e]P (IV).
Laser excitation Wavelength 365.2 nm, 369.0 nm, 3.78.0 nm, and 378.0 nm, respectively; T=4.2K. Peaks are labeled With
their excited state vibrational frequencies, in cm_1.
FIG. 6 depicts FLN spectra of pyrene as a function of time
(temperature) after opening the valve of the helium transfer line to the capillary cryostat; )tex=369.6 nm. Spectrum (a)
Was obtained at room temperature and spectra (b)—(e) Were
obtained 30, 35, 40, and 50 seconds, respectively, after opening the valve of the helium transfer line.
FIG. 7 depicts room temperature ?uorescence electro pherograms for a mixture of (a) B[a]P-d12 and (b) B[a]P
using a CE buffer consisting of 40 mM sodium bis(2
ethylhexyl) sulfosuccinate and 8 mM sodium borate in acetonitrileWater (30% v/v), pH 9; capillary, 75 pm id. and
85 cm length; applied voltage, 25 kV; current, 50 MA. FLN
spectra in the CE-buffer matrix at T=4.2K, )tex=395.7 nm,
Were obtained for the CE-separated analytes (a) and Spectra (c) and (d) are from the library of FLN spectra of
PAHs for B[a]P-d12 and B[a]P, respectively. The FLN peaks
are labeled With their S1 vibrational frequencies, in cm_1. FIG. 8 depicts (A) room-temperature ?uorescence elec
tropherogram for a mixture of (I) B[e]P and (I) B[a]P; (B) FLN spectra of CE-separated B[e]P (I) obtained in the
CE-buffer matrix at T=4.2K using )tex=369.0 nm (upper) and
)tex=365.8 nm (loWer spectrum); and (C) FLN spectra of
CE-separated B[a]P (II) obtained in the CE-buffer matrix at T=4.2K using )t€x=395.7 nm (upper) and )tex=393.8 nm (loWer spectrum). The FLN peaks are labeled With their S1
vibrational frequencies, in cm_1.
FIG. 9 depicts room temperature ?uorescence electro
pherograms (Frames A and B) obtained for tWo different DBP-N3Ade adduct samples. FLN spectra for the CE-separated analytes (I and II) are shoWn in Frames C and
D using )tex=416.0 nm; T=4.2K. The FLN peaks are labeled
With their S1 vibrational frequencies, in cm_1. See text for
discussion.
FIG. 10 depicts a room-temperature ?uorescence electro
pherogram obtained during separation of a mixture of (II)
DBP-N7Ade, (III) DPB-NlAde, and (IV) DPB-N3Ade. An
labeled With their S1 vibrational frequencies, in cm_1.
DETAILED DESCRIPTION OF THE INVENTION
Fluorescence line-narroWing spectroscopy (FLNS) is a
simple and practical analytical methodology. In recent years, the proWess of FLNS has been convincingly demonstrated
by in vitro and in vivo studies of DNA damage from carcinogenic PAH such as benZo[a]pyrene, 7,12
dimethylbenZ[a]anthracene, and the most potent PAH car cinogen currently knoWn, dibenZo[a,l]pyrene. FLNS is
capable of distinguishing betWeen a given PAH metabolite
covalently bound to different DNA bases (R. JankoWiak et
al., Chem. Res. Toxicol. 1991, 4, 256—269; R. JankoWiak, et al., Chem. Res. Toxicol. 1988, 1, 60—68) and to different nucleophilic centers of a given base (K-M. Li et al., Bio chemistry 1995, 34, 8043—8049; P. D. Devanesan et al.,
Chem. Res. Toxicol. 1993, 6, 364—371). FLNS has even been used to distinguish betWeen a given metabolite bound in
helix-external, partially base-stacked, and intercalated con formations (R. JankoWiak, et al., Chem. Res. Toxicol. 1988,
1, 60—68; M. Suh et al., Biophys. Chem. 1995, 56, 281—296; M. Suh et al., Carcinogenesis 1995, 16, 2561—2569).
The present invention successfully interfaces ?uorescence
line-narroWing (FLN) spectroscopy With capillary electro phoresis (CE) so as to provide on-line structural character iZation of electrophoretically separated, structurally similar
molecular analytes. The CE-FLN apparatus of the invention
alloWs loW temperature, on-line ?uorescence detection of
CE-separated analytes under both non line-narroWing and
line-narroWing conditions, making possible the production
of both three-dimensional electropherograms and high resolution spectra at the temperature of liquid helium (about 4.2K). LoW temperature measurements often result in higher quantum yields of many analytes, thus increasing the detec tion limits. Signi?cantly improved overall resolution and
structural characteriZation (“?ngerprinting” ) of molecular
analytes is thereby achieved, and analyte detection levels are typically in the sub-femtomole range.
The present invention provides a CE-FLN system (e.g., FIG. 1) comprising an capillary cryostat having an optically
accessible loW-temperature sample chamber, a spectrally
narroW excitation source, and a Wavelength-dispersive
detection system. The capillary cyrostat (e.g., FIG. 2) includes a capillary having a transparent annular Wall that forms an interior portion suitable for placement of a target species, and a capillary encasement at least a portion of
Which is transparent. The transparent portion of the capillary
encasement surrounds at least a portion of the transparent
annular capillary Wall to form the optically accessible
sample chamber.
The spectrally narroW excitation source is positioned to
direct a beam of light into the interior portion of the capillary
to induce ?uorescence emission from a target species.
Preferably, the excitation beam passes through the transpar ent portion of the capillary encasement prior to contacting the target species. The Wavelength-dispersive detection sys
tem is positioned to detect the ?uorescence emission from
the target species, and is preferably positioned to detect the
target species emission through the transparent portion of
the capillary encasement.
In a preferred embodiment, the capillary cryostat is
mounted on a translational stage capable of moving the
sample chamber along a capillary axis, relative to the
excitation source. Optionally, the system can include addi
15 25 35 45 55 65
voltage poWer supply, automated sample introduction and ?oW control system, and additional UV absorption or ?uo
rescence detectors to monitor the migration rates of the
analytes.
The term “optically accessible” means transparent to light, preferably light having Wavelengths about equal to the Wavelengths of the excitation source and the analyte emis
sion. Transparency to light having a Wavelength of about
200—1000 nm is preferred, more preferably about 250—850
nm. The term “loW-temperature” means a temperature beloW 100K, preferably about 2K.—90K., more preferably
about 4K.—80K.
The apparatus of the invention can be used in either
capillary Zone electrophoresis (CZE) or capillary gel elec trophoresis (CGE). When the apparatus is in use, the cap illary preferably contains an eluant that, When froZen, is
transparent to light; i.e., that forms a disordered matrix upon freeZing. The choice of eluant is dependent on the application, and the eluant can comprise an organic or aqueous buffer, preferably an aqueous buffer comprising a salt. Alternatively, the eluant can comprise a gel (such as a
polyacrylamide), or any other matrix suitable for use in
capillary electrophoresis that forms a disordered matrix upon freeZing.
Capillaries
That portion of the capillary that forms part of the sample
chamber is optically accessible, as described above. Preferably, the capillary is fabricated from UV-transparent
fused silica capillary tubing. The optimum internal diameter of the capillary depends on the application or experiment:
larger diameters produce stronger signals because they alloW interrogation of a greater amount of analyte, but narroW diameters are generally associated With higher resolution electrophoretic separations. Typically the internal diameter of the capillary ranges from 50—100 pm, although it is to be understood that any internal diameter suitable for capillary
electrophoresis is suitable for the capillary present as part of
the sample chamber, provided it ?ts Within the capillary
encasement.
The present invention is not limited by the length of the
capillary; the capillary need only be sufficiently long to effectuate the desired electrophoretic separation and acco modate the capillary cyrostat. Preferably, the capillary is 50—100 cm in length, more preferably 60—80 cm in length.
The section of the capillary to be cooled (i.e., that section
that forms part of the sample chamber) has a loW thermal capacity, ensuring rapid freeZing of the capillary contents When the cryogen is introduced. This ensures rapid freeZing
of the capillary contents When the capillary cryostat is ?lled With a cryogenic ?uid, producing immobiliZed “plugs”
containing separated analytes ready for further interrogation.
Rapid freeZing is advantageous because it minimiZes analyte band dispersion Within the capillary.Capillary Cryostat (CC)
Referring noW to FIG. 2, a capillary cryostat 200 accord
ing to the invention is shoWn. Acryogen enters the capillary
cryostat 200 through an entry port 201 from a cryogen
storage container and cryogen feed line (both not shoWn). The cryogen is preferably liquid nitrogen or liquid helium
(or the cold vapors from these liquids present immediately
above the liquid surface). It is preferred that entry port 201
includes a gas seal 201a to prevent the cryogen from escape
during operation. Typically, the gas seal 201a can be made
of any material capable of sealing at room temperature.
BUNA-N, available from Parker Seals, Lexington, Ken. The cryogen passes through a delivery line 202 that preferably
includes co-axial members, in particular, an outer vacuum Wall 202a and an inner vacuum Wall 202b. An outer diam
eter of the delivery line 202 is preferably about 2—3 cm and
the delivery line 202 is preferably about 40—50 cm in length.
An insulating vacuum is preferably formed betWeen the
outer vacuum Wall 202a and the inner vacuum Wall 202b.
The insulating vacuum separates these co-axial members. This is a desirable feature because, in general, external
members, such as the outer vacuum Wall 202a, remain at
ambient temperature during operation of the capillary cry
ostat and heat is not conducted to the cryogen. Internal
members, thus, such as the inner vacuum Wall 202b, expe
rience temperature changes from ambient temperature to
selected loW temperatures upon exposure to the cryogen.
A cryogen feed line (not shoWn) is preferably detachable
from the capillary cryostat by an O-ring compression ?tting 201 that is in close proximity to a taper seal 203, When the capillary cryostat is fully assembled. The compression ?t ting 201 serves to keep the cryogen feed line seated in place so that escape of the cryogen is prevented. A stagnant gas column in the delivery line 202 provides an effective means
of thermal protection from the compression ?tting. If the
cryogen Were to escape at this junction, the compression ?tting Would eventually cool to the extent as to become ineffective. An ineffective compression ?tting Would likely decrease the efficiency of the capillary cryostat by alloWing
cryogen to escape. An effective compression ?tting
decreases the likelihood of introducing cryogen turbulence
because of an improperly positioned delivery line. The taper
seal 203 is preferably in proximity to an inlet portion of a capillary encasement 206. It is preferable to reduce turbu lence in cryogen How to maximiZe capillary cryostat ef?
ciency.
It is important that the cryostat retain structural integrity
When the internal members are subjected to the selected loW temperatures. Stress relief means are provided in the capil lary cryostat. One preferable means includes a stress relief
conduit 204 that has a shape capable of accommodating siZe changes during thermal contraction, While maintaining a
cross-sectional area in the delivery line 202, upon cryogen entrance. One preferred con?guration is a coil shape, as shoWn. Preferred dimensions of a suitable coil con?guration
include an outer diameter of about 2—3 mm, a Wall thickness
of about 0.25 mm of a 305 SS tubing. In particular, the stress
relief conduit 204 provides axial compensation for the change in length of the internal components relative to the
outer components, due to the respective temperature expo
sures as described above. The compensation alleviates the
predicted perpendicular strains that may be imposed on a
capillary encasement 206, described beloW.
In order to minimiZe internal thermal stress, i.e.,
contraction, of the capillary, the cryogen passes from the
stress relief conduit 204 through a cryogen entry segment
205. Referring noW to FIG. 2A, an enlarged vieW of a
portion of the capillary cryostat around the entry segment
205 is shoWn. As the cryogen passes from the stress relief conduit 204, it ?rst passes through a diverter portion 225 of
the entry segment 205. Preferably, the diverter portion 225
is con?gured such that the cryogen is aimed in a direction substantially normal (i.e., perpendicular) to the prior path of
the cryogen in the delivery line 202 and that is substantially
parallel to a longitudinal axial direction of the capillary 216. That is, the diverter portion 225 directs the cryogen such that
it ?oWs along the length of the capillary 216. The cryogen
15 25 35 45 55 65
prevent buffeting from the cryogen. Preferably, the turbu
lence guard 235 surrounds at least a portion the capillary 216 for improved protection from turbulence.
Prior to contacting a capillary 216, the cryogen passes around a cold tube seal 245a. It is preferred that the cold tube
seal 245 be formed from a material that exhibits a similar coef?cient of thermal expansion as a capillary encasement
206, described beloW. For example, When the capillary
encasement 206 is formed from quartZ, a particularly useful material for the cold tube seal 245a is INVAR, available
from Scienti?c Alloys, Westerly, RI. Preferably, the cold
tube seal 245a is sealed to an inner annular Wall 236 of the
capillary encasement 206 With a sealant capable of With
standing the cool operating temperatures. An outer annular
Wall 246 is preferably sealed in a tube-in-socket con?gura tion using an epoxy sealant. An example of a suitable epoxy sealant is STYCAST 2850FT/24LV, available from Emerson & Cuming, Lexington, Mass. Additionally, to improve the seal betWeen the cold tube seal 245a and the capillary encasement 206, the relevant portion of the capillary encase ment 206 can be etched With hydro?uoric acid to improve epoxy adhesion thereto.
As shoWn in FIG. 2A, the cryogen entry segment 205 directs the cryogen to How in a direction substantially normal to the How betWeen the entry port 201 and a doWnstream end of the stress relief conduit 204. As shoWn
in FIG. 2A, cryogen How is directed by the diverter portion
225. It is believed that this feature functions to prevent
damage and decrease the likelihood of breakage of the
capillary upon contact With the cryogen.
Referring back to FIG. 2, the capillary 216 is housed in a
capillary encasement 206. Preferably, the capillary encase
ment 206 includes an inlet end in proximity to the cryogen
entry segment 205 and an opposing outlet end. The inlet end
provides the introduction of the cryogen to the capillary
encasement 206 While the outlet end provides the evacuation of the cryogen from the capillary encasement 206. The
capillary encasement 206 preferably includes an inner annu lar Wall 236 and an outer annular Wall 246 forming an
annular lumen 256 therebetWeen. Preferably, the annular lumen 256 is evacuated to provide a thermal barrier. Suitable
dimensions for a capillary encasement 206 are about 0.5—0.8
cm in diameter and about 6—9 cm in length. The capillary
216 is located co-axially Within the capillary encasement 206 and positioned With terminal components of the capil
lary encasement 206, discussed beloW. When used in a
CE-FLN system in according to the invention, the capillary 216 is preferably positioned in a central transparent region
(not labeled) of the capillary encasement 206.
Preferably, the capillary 216 is cooled to a temperature of
about 77K to about 4.2K by a continuous How of cryogen
through the capillary encasement 206. For example, liquid
nitrogen may be used for NLN ?uorescence and liquid
helium may be used for FLNS. The loW thermal capacity of
the capillary 216 and the small dimensions of the capillary
encasement 206 ensure rapid cooling in preferably about 1 minute or less. It Will be appreciated that cooling must be
rapid in order to produce disordered matrices as required.
At the outlet end of the capillary encasement 206, a cryogen exhaust segment 207 is provided. Referring noW to
FIG. 2B, the cryogen exhaust segment 207 is preferably substantially similar in con?guration as the cryogen entry
segment 205. The exiting cryogen passes around a cold tube seal 245b. It is preferred that the cold tube seal 245b be
example, When the capillary encasement 206 is formed from
quartz, a particularly useful material for the cold tube seal
245b is INVAR, available from Scienti?c Alloys, Westerly,
RI. Preferably, the cold tube seal 245b is sealed to an inner annular Wall 236 of the capillary encasement 206 With a sealant capable of Withstanding the cool operating tempera
tures. An outer annular Wall 246 is preferably sealed in a
tube-in-socket con?guration using an epoxy sealant. An example of a suitable epoxy sealant is STYCAST 2850FT/
24LV, available from Emerson & Cuming, Lexington, Mass.
Additionally, to improve the seal betWeen the cold tube seal
245b and the capillary encasement 206, the relevant portion
of the capillary encasement 206 can be etched With hydrof luoric acid to improve epoxy adhesion thereto.
Upon exiting the cryogen exhaust segment 207, the cryo
gen is noW ?oWing in a direction substantially normal to the
orientation of the capillary 216 and substantially parallel to
the direction of the delivery line 202 but through an exit line
209. Again, to minimiZe potential stress upon cooling and
Warming the capillary 216 during operation of the capillary cryostat, a thermal contraction belloW 208 is provided in an upstream end of an exit line 209, thus connecting the cryogen exhaust segment 207 to the exit line 209. An axial stress relief belloW 213 is also provided and is preferably
oriented in a direction substantially parallel to, and prefer ably in ?uid communication With, the capillary 216. Both belloWs (208 and 213), together, provide an extended ther
mal path from the cool area Within and to the ambient
temperature portion of the capillary encasement 206. This
minimiZes the likelihood for the accumulation of conden
sation on the capillary cryostat. Additionally, any axial contraction upon cooling and subsequent expansion upon Warming of the capillary 216 is accommodated by the axial
stress relief segment 213.
As described With respect to delivery line 202, exit line
209 preferably includes an outer vacuum Wall 209a and an inner vacuum Wall 20%. An outer diameter of the exit line
209 is preferably about 2.54 cm (1.0 in) and is preferably
about 44.5 cm in length. An evacuation valve 210 is pref erably operatively connected to exit line 209. The evacua tion valve 210 can be opened to facilitate evacuation of the
insulating vacuum, as desired. Subsequent Warning may be achieved by replacing the cryogen With nitrogen or helium
gas tempered as required. The cryogen then exits the cap illary cryostat 200 by ?oWing through exit port 211, that may
either be connected for reclamation, recycling or disposing
of the cryogen.
Sealing of the capillary 216 is accomplished by Warm gas
seals 214a and 214b that are provided in proximity to the inlet end and the outlet end of the capillary encasement, respectively. These Warm gas seals are preferably Te?on and are modi?ed to alloW threading of the capillary 216. These Warm gas seals provide both electrical and thermal isolation for the capillary. These Warm gas seals may also include
compression O-rings, Wherein escape of the cryogen is prevented by ?lling an annulus about the capillary 216 and
an inner surface of Warm gas seals 214a and 214b With a
standard vacuum grease. The grease is preferably viscous
enough to prevent bloWing out during initial cool doWn and
should freeZe in place during operation.
To provide additional support for the capillary encase
ment 206, “L-brackets” 212a and 212b are provided, Wherein the capillary encasement 206 cannot torque upon cooling and subsequent Warming, presumably due to, at least in part, the excess Weight of the cryogen feed line (not shoWn), exit line, vacuum pumping hoses (not shoWn), and
10 15 25 35 45 55 65
Preferably, these L-brackets are adapted to ride on the translator (not shoWn). Thus, these L-brackets provided both support to the capillary encasement and an attachment means of the capillary cryostat to the translator.
If desired, the temperature in the interior portion of the
capillary can be varied or controlled by adjusting the ?oW rate of the cryogenic ?uid. Optionally, the crystostat can
include a temperature monitor positioned directly opposite
the ventline.
At the loW temperature provided by the crystostat, the contents of the encapsulated portion of the capillary freeZe,
rendering the separated analytes present therein immobile. FLNS and/or NLN ?uorescence spectroscopy can then be
conducted on the stationary analytes for arbitrary detection
times, signi?cantly improving both the accuracy of quanti tation and the limit of detection.
As a component of the FLN-CE apparatus of the present invention, the crystostat is preferably attached to a transla
tion stage, more preferably a stage With an automated
controller. Finely controlled translation of the crystostat
along the longitudinal capillary axis alloWs the separated
analytes to be sequentially characteriZed by ?uorescence spectroscopy, as the capillary is translated through the laser excitation region. The length of the crystostat, and its quartZ
cell, may at times be greater than the travel distance of the
translation stage (typically about 5 cm); if the travel distance
of the automated translation is insuf?cient, the froZen cap
illary can be manually positioned to a neW location.
As an element of the CE-FLN system of the invention, the long axis of the crystostat (i.e., the capillary axis) is tilted relative to the excitation source, preferably about 30 degrees or less, to discriminate against scattered and re?ected laser
light. Further discrimination against scattered laser light and
background ?uorescence from the capillary Walls Was
obtained by spatial ?ltering.
Excitation Source
The spectrally narroW excitation source preferably emits a beam of light having a range of Wavelengths of less than about one Wavenumber. A preferred spectrally narroW exci
tation source is a laser, more preferably a tunable laser. The
laser used re?ects the excitation Wavelength needed to excite
the analyte of interest. The laser can be either a continuous
Wave (CW) laser or a pulsed laser. A nonexpressive diode can also be easily included in the CE-FLN system. An excimer pumped-dye laser is particularly preferred. For
example, an excimer (XeCl gas) pumped dye laser can be
used for analysis of analytes that absorb in the 330—900 mn region; other gases, such as Kr, can be used for analysis of analytes that absorb in the 310—1000 nm range. The average
poWer density of the laser preferably ranges from 1—100
mW/cm2.
Wavelength-Dispersive Detection System
The Wavelength-dispersive detection system comprises a
?uorescence dispersive device, such as a high resolution monochromator, and a detector. The detector is preferably a diode array detector or an image array detector. The image array detector is preferably a tWo-dimensional image array detector, more preferably a charge-coupled device (CCD) or
a charge-injection device (CID). In a particularly preferred embodiment, an optical multianalyZer (OMA) is included in
the Wavelength-dispersive detection system. Preferably, ?uorescence is collected by the detector at a right angle With respect to the excitation beam.
One-dimensional (total signal) electropherograms can be
sity at higher, including ambient, temperatures. The present apparatus thus optionally includes a second ?uorescence based detector for acquiring room temperature chromato grams. The second detector can, for example, be a photo multiplier tube or a fast-response diode.
CE Apparatus
It is to be understood that the FLNS-CE interfacing accomplished by the present invention is generally appli
cable to any modular CE apparatus or system, and that any and all such systems can be utiliZed as a component of the
apparatus of the present invention provided that the capil
laries used in such system can Withstand the local loW temperature environment of the capillary cryostat and are
fabricated from a material that alloWs effective on-line
excitation and detection of the separated analytes.
A preferred embodiment of the CE-FLN system of the invention is shoWn in FIG. 1. The apparatus includes a tunable excitation source consisting of an excimer laser 101, a dye laser 102, and a pulser 103, a spectrometer 104 housing a high resolution monochromator 105 and an optical multianalyZer (OMA) 106 With an intensi?ed diode array
detector 107, a capillary cryostat 200, and modular CE apparatus 108. As previously mentioned, the capillary cry
ostat includes a capillary encasement 206 surrounding the capillary 216. The laser 101, 102 is positioned to direct a
beam 109 of spectrally narroW light so as to irradiate a
froZen analyte inside a sample chamber formed by trans parent portions of capillary 216 and encasement 206. Fluo
rescence emitted by the froZen analyte passes through a lens
110 and is detected by the spectrometer 104. The cryostat
200 is attached to a translational stage 111 that is operated
by a translator motor 112.
The present invention also provides a method for per
forming capillary electrophoresis utiliZing the apparatus of
the invention disclosed herein. Preferably, the capillary is
?rst ?lled With an eluant capable of forming a disordered matrix upon freeZing, as described above. The method is
performed by electrophoresing a sample containing a ?uo rescent target species through a capillary to position the target species in the optically accessible sample chamber of
the capillary cryostat. At that point the capillary is rapidly cooled to a loW temperature by introducing a cryogen,
preferably a cryogenic liquid, into the inner lumen of the capillary encasement, thus freeZing the contents of the
encapsulated portion of the capillary, including the target species. The froZen target species is irradiated, preferably With a CW or pulsed laser, and the induced ?uorescence emission in CW or gated mode is detected.
Optionally, the detection step includes the acquisition of
non-line-narroWed (NLN) ?uorescence spectra, preferably
using liquid nitrogen (77K) as the cryogen, to obtain infor
mation concerning the position (Wavelength) of the ?uores cence (0,0) band and the vibronic band structure of CE-separated analytes. Knowledge of the ?uorescence ori gin band position (from the NLN spectra) is helpful in selecting the appropriate laser excitation Wavelengths for subsequent FLN characteriZation of the analyte. Acquisition
of high resolution spectra using FLNS, preferably using
liquid helium as the cryogen (4.2K), preferably folloWs. In
a preferred embodiment of the method, FLN spectra are
obtained for several excitation Wavelengths (preferably 6—8 Wavelengths) to obtain all excited state vibrational frequen cies. When multiple Wavelengths are used, each excitation
Wavelength provides a unique ?ngerprint. Structural char
acteriZation is obtained by a comparison of these spectra
With available libraries of FLN spectra of standards.
10 15 25 35 45 55 65
components of complex systems, as is demonstrated by the folloWing examples. Other examples for use of the FLN-CE apparatus of the invention include rapid detection and high
resolution structural identi?cation of the chemical com
pounds formed in the reaction of cellular macromolecules
With the electrophilic metabolites of aromatic hydrocarbons
and related chemicals. Many other important applications can be envisioned, such as the study of the relationship
betWeen adduct conformation and stereochemistry, studies
of the effect of the ?anking bases on the adduct structure of
DNA hotspots, and analysis of isomers and other closely
related compounds. Due to the sub-femtomole detection
level of the present invention, many challenging problems in
biological, medical, and forensic sciences can be addressed. There is, for example, mounting evidence that depurinating adducts may be responsible for tumor initiation. The present invention can be used to characteriZe depurinating nucleo side adducts in urine and/or supernatant form cell ensembles in vitro and in vivo. Thus, use of the present invention in
broad screening applications to detect depurinating DNA
adducts may prove to be very important for cancer treatment
and prevention.
Advantages of the invention are illustrated by the folloW ing examples. HoWever, the particular materials and
amounts thereof recited in these examples, as Well as other
conditions and details, are to be interpreted to apply broadly
in the art and should not be construed to unduly restrict or
limit the invention in any Way.
EXAMPLE I
Analyis of Polyaromatic Hydrocarbons (PAH) Using FLN
CE Capillary Electrophoresis System
A Crystal 300 Series modular CE system (model 310, ATI
Unicam, Boston, Mass.) Was used for electrophoretic sepa rations. Absorption electropherograms Were recorded using
an ATI Unicam model 4880 Chromatography Data Handling system, With detection at 254 nm. UV-transparent fused
silica capillary tubing (Polymicro Technologies, Phoenix,
AriZ.) Was 75 pm ID. For the CE-LIF experiments, a 95 cm
long capillary Was used, With the absorbance detector posi
tioned 40 cm from the capillary inlet and the capillary cryostat (CC) approximately 85 cm from the inlet. For this
arrangement, analyte peaks are less Well resolved in absor bance than ?uorescence, simply because the absorbance
detector is located upstream from the CC.
A mixture of ?ve PAH Was selected as the sample to be
used in the initial CE-FLN experiments. The scheme of Shi
and FritZ Shi et al., Anal. Chem. 1995, 67, 3023—3027; Y. Shi et al, J. High Res. Chrom. 1994, 117, 713] Was used
for CE separation. The buffer consisted of an acetonitrile
Water solution (30% v/v) containing 40 mM sodium di-2
ethylhexyl sulfosuccinate (Aldrich, Milwaukee, Wis.) and 8 mM sodium borate (Fisher Scienti?c, Fair LaWn, N.J.), adjusted to pH 9 by adding phosphoric acid (Fisher Scienti?c). The capillary Was initially conditioned by rinsing it With 0.1M NaOH for 30 minutes, deioniZed Water for 30
minutes, and running buffer for 5 minutes. Hydrodynamic