Fatigue Testing o f Weldable High Strength Steels
Under Simulated Service Condition
by
Natee Tantbirojn
Submitted for the Degree of Doctor o f Philosophy
Department of Mechanical Engineering University College London
ProQuest Number: U643508
All rights reserved
INFORMATION TO ALL USERS
The quality of this reproduction is dependent upon the quality of the copy submitted.
In the unlikely event that the author did not send a complete manuscript and there are missing pages, these will be noted. Also, if material had to be removed,
a note will indicate the deletion.
uest.
ProQuest U643508
Published by ProQuest LLC(2016). Copyright of the Dissertation is held by the Author.
All rights reserved.
This work is protected against unauthorized copying under Title 17, United States Code. Microform Edition © ProQuest LLC.
ProQuest LLC
789 East Eisenhower Parkway P.O. Box 1346
Abstract
There have been concerns over the effect of Cathodic Protection (CP) on weldable high
strength steels employed in Jack-up production platform. The guidance provided by the
Department o f Energy HSE on higher strength steels, based on previous work, was to
avoid overprotection as this could cause hydrogen embrittlement. However, the tests
conducted so far at UCL for the SE702 type high strength steels (yields strength around
690 MPa) have shown that the effect o f over protection on high strength steels may not be
as severe as previously thought. For this thesis, SE702 high strength steels have been
investigated in more detail. Thick (85mm) parent and ground welded plates were tested
under constant amplitude in air and seawater with CP. Tests were also conducted on
Thick (40mm) T-butt welded plates under variable amplitude loading in air and seawater
with two CP levels (-SOOmV and -lOSOmV). Different backing materials (ceramic and
metallic) for the welding process of the T-butt plates were also investigated.
The variable amplitude sequences employed were generated using the Jack-up Offshore
Standard load History (JOSH). The fatigue results are presented as crack growth and S/N
curves. They were compared to the conventional offshore steel (BS 4360 SOD). The
results suggested that the fatigue life o f the high strength steels was comparable to the BS
4360 50D steels. The effect o f increasing the CP was found to be detrimental to the
fatigue life but the effect was not large. The effect o f CP was less noticeable in T-butt
welded plates. However, in general, the effect of overprotection is not as detrimental to
the Jack-up steels as previously thought.
The load histories generated by JOSH were found to have some unfavourable
characteristics. The framework is based on Markov Chain method and pseudo-random
number generator for selecting sea-states. A study was carried out on the sequence
generated by JOSH. The generated sequences were analysed for their validity for fatigue
testing. This has resulted in recommendations on the methods for generating standard
load histories.
Acknowledgements
I would like to thank Prof W D Dover, Dr F P Brennan and Dr L S Etube for their
supervision, guidance for the work carried out in this thesis.
I would also like to thank everyone at the NDE centre, Farid, Bijan, Mathews, Han and
Andy for their assistance with the study. Thanks also to my brother, p ’One and Rie for
taking time out to assist with my thesis. The assistance received by the staffs at the
mechanical engineering workshop is also greatly appreciated. I also want to thank Muay
for the friendship and support.
Finally I am most grateful to my family, especially my parents, for giving me the
opportunity and the love and support.
-Table of Contents
Abstract________________________________________________________________ 1 Acknowledgements______________________________________________________ 2 Table o f Contents________________________________________________________3 T ables_________________________________________________________________ 6 Figures_________________________________________________________________ 7 Nomenclature__________________________________________________________ 10 Chapter 1________________________________________________________________ 11 Introduction and Background Work on Fatigue Testing__________________ 11 Jack-up Steels___________________________________________________ 12 Fatigue Analysis o f Welded Joints___________________________________ 13 Stresses Employed in Fatigue A nalysis__________________________ 14 Fracture Mechanics A pproach__________________________________ 18 Factors Affecting Fatigue L ife __________________________________24 Corrosion Fatigue________________________________________________ 28 Corrosion Process____________________________________________ 28 Cathodic Protection___________________________________________ 31 Variable Amplitude Loading _______________________________________ 39 Crack Retardation and Acceleration_____________________________ 39 Crack Closure_______________________________________________ 41 Fatigue Life Prediction under VA________________________________44 Summary of Chapter______________________________________________ 51 References______________________________________________________ 53 Figures__________________________________________________________5 8 Chapter 2________________________________________________________________ 64 2.0 Variable Amplitude Loading Sequence Generation______________________ 64 2.1 Wave Loading Design______________________________________________ 65 2.1.1 Mathematical Spectrum Models_________________________________ 67 2.2 Service Load Simulation for Fatigue Testing___________________________ 69 2.2.1 W irsching___________________________________________________ 70 2.2.2 Hartt and Lin_________________________________________________ 71 2.2.3 Development o f W A SH ________________________________________72 2.2.4 Jack-up Offshore Standard load History (JO SH )____________________ 77 2.3 Cycle Counting___________________________________________________ 7 8 2.4 Conclusions and Recommendations__________________________________ 79 2.5 References_______________________________________________________ 81 2.6 T ables__________________________________________________________ 83 2.7 Figures__________________________________________________________ 84 Chapter 3________________________________________________________________ 87 3.0 Fatigue Testing o f High Strength Steels_______________________________ 87 3.1 Experimental Programme___________________________________________ 88 3.1.1 Part 1 : Effect of CP on Fatigue in Parent and Ground Welded P lates 88 3.1.2 Part 2: Effect of CP on Fatigue in T-butt Plates____________________ 89 3.1.3 Part 3 : Effect o f Sub-block D uration_____________________________ 89 3.1.4 Part 4 Metallurgical Examination________________________________ 90
- 3
3.1.5 Part 5 Investigation of Different Backing Conditions________________ 90 3.1.6 Long Life Tests (LLT) ________________________________________91 3.2 Experimental Procedure___________________________________________ 91
3.2.2 Test Monitoring Using A C P D __________________________________ 93 3.3 Metallurgical Examination_________________________________________ 95 3.4 Results o f Fatigue T e sts___________________________________________ 96 3.4.1 S/N D a ta___________________________________________________ 96 3.4.2 Fatigue Crack Growth data_____________________________________ 98 3.5 Discussion on Metallurgical Examination____________________________100 3.6 Discussion on Fatigue Test R esu lts_________________________________ 101 3.6.1 Parent and Ground Welded P la te s ______________________________ 101 3.6.2 T-butt Welded Plates_________________________________________ 102 3.7 Summaries and Conclusions_______________________________________ 108 3.8 References______________________________________________________110 3.9 T ables_________________________________________________________ 112 3.10 Figures_________________________________________________________ 120 Chapter 4 _______________________________________________________________ 150 4.0 Analysis Work on Fatigue Test R esults______________________________ 150 4.1 Revised S/N Plot of Fatigue L ives__________________________________ 150 4.1.1 Discussion on Revised S/N P lo ts_______________________________ 151 4.2 Fatigue Crack Initiation__________________________________________ 153 4.2.1 Crack Initiation Results_______________________________________ 153 4.2.2 Discussion of Crack Initiation Lives_____________________________ 154 4.3 Comparison o f High Strength Steels R esults__________________________156 4.3.1 Discussion on Comparison Study_______________________________ 157 4.4 Crack Growth R ate______________________________________________ 158 4.4.1 Calculation o f Crack growth Rate_______________________________ 160 4.4.2 Discussion o f Crack Growth Rate_______________________________ 161 4.5 Discussion on Welded Joint Classification for T-butt Welded P late_______163 4.5.1 Inclusion of SCF Instead of Using Welded Joint Classification_______ 164 4.6 Summaries and Conclusions_______________________________________ 166 4.7 References______________________________________________________168 4.8 T ables_________________________________________________________ 170 4.9 Figures_________________________________________________________ 174 Chapter 5_______________________________________________________________205 5.0 Analysis o f Standard Load History G enerator________________________ 205 5.1 Standard Load Histories Generator Framework_______________________ 206 5.1.1 Markov Chain______________________________________________ 207 5.1.2 Pseudo Random Binary Shift (PRBS) generator__________________ 211 5.1.3 Sea-States Selection_________________________________________ 212 5.1.4 Operation of WASH and JO S H ________________________________ 213 5.2 Analysis of Generated Sequences___________________________________ 214 5.2.1 Stationary points____________________________________________ 215 5.2.2 Equivalent Stress____________________________________________ 215 5.2.3 Power Spectral Density (PSD) function_________________________ 216 5.2.4 Starting Sea-States__________________________________________ 217 5.2.5 Sea-State Sub-block Duration__________________________________ 218 5.3 Discussion o f Analysed Sequences__________________________________ 219
-5.4 Conclusions and Recommendations________________________________ 223 5.5 R eference_____________________________________________________ 224 5.6 T ables________________________________________________________ 226 5.7 Figures________________________________________________________ 231 Chapter 6_______________________________________________________________242 6.0 Summary o f Thesis______________________________________________ 242 6.1 Summary o f Conclusions and Recommendations_____________________ 242 Appendix A_____________________________________________________________246 Appendix B _____________________________________________________________280 Appendix C _____________________________________________________________281
-Tables
Table 2.1: Statistic and fatigue damage calculations fo r simulated North Sea condition proposed by
Wirsching [2 .7 ]...83
Table 2.2: Original sea-state data fo r WASH...83
Table 3 .1: Mechanical properties o f DILLIMAX690E...112
Table 3.2: Chemical composition o f DILLIMAX690E %...112
Table 3.3: Summary o f test param eters fo r p a rt 1...112
Table 3.4: M echanical properties o f SE 7 0 2... 113
Table 3.5: Chemical composition o f SE 702 %...113
Table 3.6: Summary o f test param eters fo r p a rt 2...113
Table 3.7: Summary o f test param eters fo r p a rt 3...113
Table 3.8: Details o f UCL specimens examined by Cranfield University...114
Table 3.9: Summary o f test param eters fo r p a rt 5 T-butt p la te s...114
Table 3.10: M echanical properties fo r Long Life Tests (LLT)...114
Table 3.11: M etallurgical analysis o f different high strength steels and their so u rces...115
Table 3.12: S/N results fo r Parent and Ground welded plates under CA:...115
Table 3.13: S/N results fo r T-butt plates under Variable Amplitude loadin g...116
Table 3.14: Fatigue results fo r LLT...117
Table 3.15: Calculation o f fatigue life o f parent plate P I...117
Table 3.16: Results f o r different sea-states fo r the T-butt p la te s...118
Table 3.17: S/N data matrix fo r all tests showing % change in fatigue life...118
Table 3.18: S/N data matrix fo r parent plates (Part 1) showing % change in fatigue life...119
Table 3.19: S/N data matrix fo r T-parent plates (Part 2) showing % change in fatigue life...119
Table 3.20: S/N data matrix fo r T-parent plates (Part 3) showing % change in fatigue life...119
Table 4.1: Data o f the initiation life o f the fatigue tests...170
Table 4.2: Data o f the initiation life o f the other fatigue tests...171
Table 4.3: Fatigue life result fo r LLCF....172
Table 4.4: Spectrographic metallurgical analysis o f DILLIMAX690E-Z15 steel...172
Table 4.5: Chemical composition o f DILLIMAX690E % (85mm p late thickness)...172
Table 4.6: Mechanical properties fo r LLCF...173
Table 4.7: Mechanical properties fo r 85mm p la te s...173
Table 4.8: Data o f the fatigue tests...173
Table 5.1: Transition matrix fo r 10 minutes sub-block...226
Table 5.2: Sea scatter diagram fo r number o f occurrence from B ery/F rig...226
Table 5.3: Sea-states selected fo r JOSH...227
Table 5.4: Expected duration time fo r JOSH sea-states...227
Table 5.5: The Transition probabilities fo r different sub-block duration tim e...228
Table 5.6: Number o f occurrence fo r each sea-states with different starting sea-state fo r the 12 sequences (1000 transitions)...229
Table 5.7: % o f occurrence fo r each sea-states with different starting sea-state f o r the 12 sequences (1000 transitions)...229
Table 5.8: % Occurrence o f starting sea-states 1 fo r different number o f transitions...230
Table 5.9: % occurrence fo r different duration length...230
-Figures
Figure 1.1: Definition o f H ot Spot stre ss...58
Figure 1.2: Co-ordinate f o r stresses fo r the near crack tip region...58
Figure 1.3: Three basic crack modes [ 1 .9 ]...59
Figure 1.4: Paris-Erdogan P lo t...59
Figure 1.5: Stress gradient fo r different plates thickness...60
Figure 1.6: Schematic representations o f the combination o f mechanical fatigue and environmentally assisted crack growth [1 .3 3 ]...61
Figure 1.7: Residual stress left behind due to p la sticity...62
Figure 1.8: Crack Closure due to the residual w ake...62
Figure 1.9: Different Closure Mechanisms roughness induced closure...63
Figure 2.1: Energy spectrum from a North Atlantic storm w ave...84
Figure 2.2: Typical double peak density function [ 2 .1 0 ]...84
Figure 2.3: Schematic representation o f creating response spectral density [2 .1 1 ]...85
Figure 2.4:PSD fo r WASH (W) [2 .1 0 ]...85
Figure 2.5: Schematic diagram f o r shift register and shifting feedback fo r the PRBS technique [2.10]... 86
Figure 2.6: Simplified model o f a Jack up [2 .1 1 ]...86
Figure 3.1: Dimension o f specimens used fo r fatigue testing:...120
Figure 3.2: Test set up fo r the ground welded plates and parent p la te s...121
Figure 3.3: Test set-up fo r the T-butt p la te s...122
Figure 3.4: Picture o f T-butt p late set up fo r an air test...122
Figure 3.5: Environment cell used fo r the parent plate tests...123
Figure 3.6: Distribution o f sea-states in JOSH sequence used in P art 2...123
Figure 3.7: Stress Range Distribution (SRD) curves...124
Figure 3.8: Loading Sequence f o r JOSH with a 20 minute sea-state duration...124
Figure 3.9: Loading Sequence f o r JOSH with a 10 minute sea-state duration...125
Figure 3.10: Loading Sequence fo r JOSH with a 30 minute sea-state duration...125
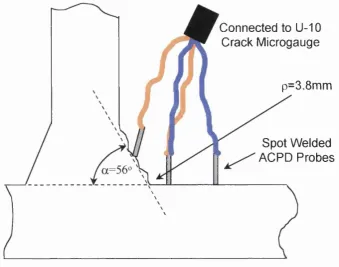
Figure 3.11: ACPD schematic diagram...126
Figure 3.12: Illustration o f spot welded ACPD probes at the w eld to e...126
Figure 3.13: Spot w elded ACPD probes on a welded T-butt jo in t....127
Figure 3.14: S/N p lo t fo r plates under tested under C A...128
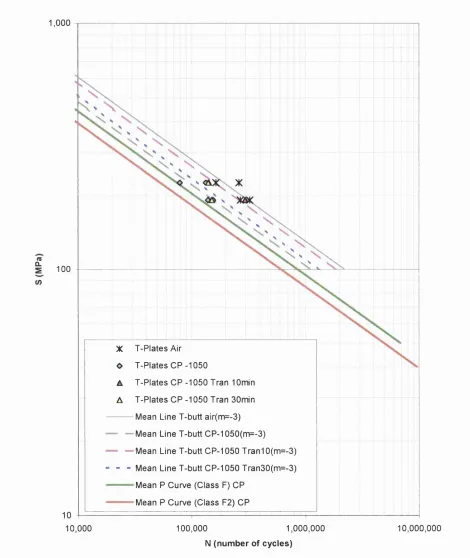
Figure 3.15: S/N p lo t o f T-butt plates under VA with the effects o f C P...129
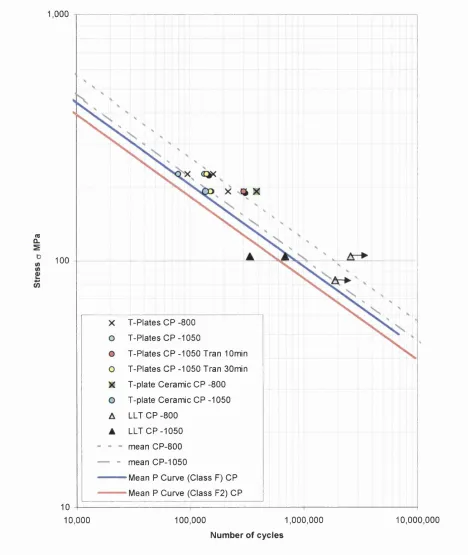
Figure 3.16: S/N p lo t o f T-butt plates with different duration p erio d under C P...130
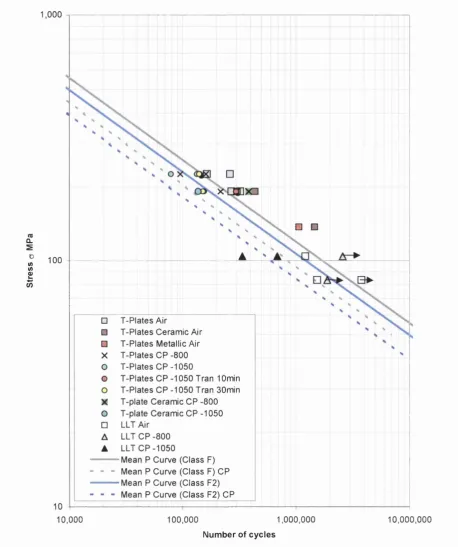
Figure 3.17: S/N p lo t fo r the Material tested as compared to results from BS 4360 50D steel [3.11] .... 131
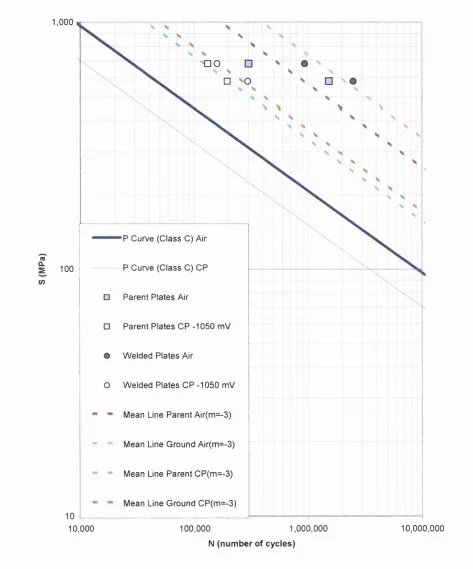
Figure 3.18: Mean Lines fo r parents and ground w elded p la te s...132
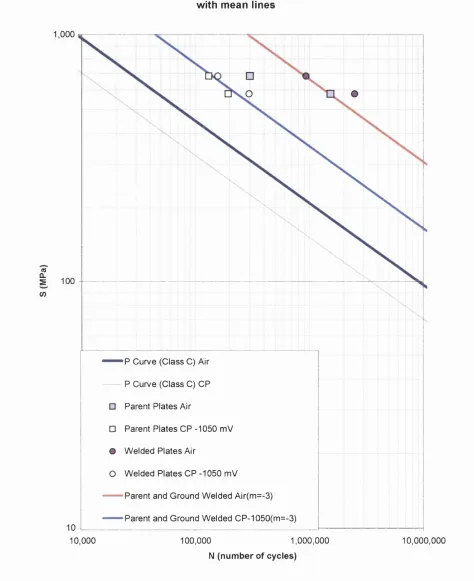
Figure 3.19: Mean Lines f o r Parent and Ground welded plates together...133
Figure 3.20: Mean Lines fo r T-butt plates with the effects o f C P...134
Figure 3.21: Mean Lines fo r T-butt plates with different duration period....135
Figure 3.22: Mean line fo r Air data with -2 S D lin e s...136
Figure 3.23: Mean line fo r CP data with -2 S D lin e s...137
Figure 3.24: Mean line fo r Air and CP data with -2 S D lin es...138
Figure 3.25: Comparison o f fatigue lif e...139
Figure 3.26: Specimen T09, Seawater test 1 4 6 MPa, CP -SOOmV...139
Figure 3.27: Specimen TIO, Seawater test 1 4 6 MPa, CP -1050m V...140
Figure 3.28: Specimen T09, Seawater test 146 MPa, CP -800m V...140
Figure 3.29: Specimen TIO, Seawater test 1 4 6 MPa, CP -1050m V...141
Figure 3.30: Comparison o f crack growth fo r 146 M P a...141
Figure 3.31: Comparison o f crack growth fo r 172 M P a...142
Figure 3.32: Comparison o f crack growth fo r different JOSH duration p e rio d...142
Figure 3.33: Comparison o f crack growth fo r T-butt p la tes...143
Figure 3.34: Air at 146 M P a...143
Figure 3.35: Crack Growth fo r Ceramic backing T-plate, TCOl at 146 MPa and TC02 at 104M Pa 144 Figure 3.36: Finished CP test fo r parent plate with white oxide surface (calcareous deposit)...144
Figure 3.37: Parent plate, CP (350 M P a )...145
-Figure 3.38: Ground welded plate, CP (412 M P a )...145
Figure 3.39: Ground welded plate, air (412 M Pa)...146
Figure 3.40: Side profile o f welded plate, CP (412 M P a)...146
Figure 3.41: Close up o f the welded plate, CP (412 M Pa)...147
Figure 3.42: Side profile o f ceramic backing welded T-butt p l a t e...147
Figure 3.43: Side profile o f metallic backing welded T-butt p la te...148
Figure 3.44: Side profile o f cracked metallic backing welded T-butt p la te...148
Figure 3.45: Weld profile o f cracked metallic backing welded T-butt p la te...149
Figure 4.1 : R evised SN curves fo r air te s t...174
Figure 4.2: Revised SN curves fo r -SOOmV test...175
Figure 4.3: Revised SN curves fo r -1050m V test...176
Figure 4.4: Diagram showing single sided and double-sided welded plates...177
Figure 4.5: Comparison o f fatigue initiation lives as bar ch a rt...177
Figure 4.6: Percentage offatigue initiation life to fatigue life...178
Figure 4.7: Fatigue initiation life in air as S/N curve...179
Figure 4.8: Fatigue initiation life in seawater under CP as S/N curve...180
Figure 4.9: Fatigue initiation life fo r other air tests ofH SS at UCL...181
Figure 4.10: Fatigue initiation life fo r HSS tubular join ts tested at U C L...182
Figure 4.11: Dimensions o f HSS T-butt welded specimens (all dimensions in m m )...183
Figure 4.12: Dimensions o f the fou r point bend test rig (all dimensions in mm)...183
Figure 4.13: S/N curve fo r HSS from Lindley [4 .9 ]...184
Figure 4.14: Comparison S/N air curve fo r HSS from Lindley [ 4 .9 ]...185
Figure 4.15: Comparison S/N seawater curve fo r HSS from Lindley [ 4 .9 ]...186
Figure 4.16: S/N curve fo r Long life te s t...187
Figure 4.17: S/N curve fo r all air tests on T-butt p la te s...188
Figure 4.18: S/N curve fo r T-butt plates with CP -SOOmV...189
Figure 4.19: S/N curve f o r T-butt plates with CP -1050m V...190
Figure 4.20: Crack Growth Rate against Stress Intensity Factor R a n g e...191
Figure 4.21: Loading Sequence fo r JOSH.OUT...191
Figure 4.22: Specimen T09, Seawater test 1 4 6 MPa, CP -SOOmV...192
Figure 4.23: Comparison o f crack growth fo r T-butt plates...192
Figure 4.24: Crack Growth fo r Ceramic backing T-plate...193
Figure 4.25: Crack Growth Rate against Time...193
Figure 4.26: Crack Growth Rate against Stress Intensity Factor Range fo r A ir...194
Figure 4.27: Crack Growth Rate against Stress Intensity F actor Range fo r C P...194
Figure 4.28: AK v d a/dN for TCOI...195
Figure 4.29: AK v da/dN fo r T C 02...195
Figure 4.30: AK v da/dN for T03...196
Figure 4.31: AK v da/dN for T04...196
Figure 4.32: AK v da/dN for T09...197
Figure 4.33: AK v da/dN for TIO...197
Figure 4.34: AK v d a/dN for T07...198
Figure 4.35: AK v da/dN for T08...198
Figure 4.36: Crack growth and crack growth rate fo r TC02...199
Figure 4.37: S/N Curves fo r class C, F and F 2...200
Figure 4.38: S/N curve fo r all air tests on T-butt p la te s...201
Figure 4.39: S/N curve fo r T-butt plates with C P...202
Figure 4.40: Comparison p lo t fo r all the T-butt tests...203
Figure 4.41: S/N p lo t with SCF....204
Figure 5.1: Amplitude p lo t o f the sequence generated by JO SH...231
Figure 5.2: Fatigue Crack growth fo r a T-butt welded p late in air...231
Figure 5.3: Rainfiow count fo r JOSH 20m in...232
Figure 5.4: Monte Carlo simulation f o r sea-state transition [5 .2 ]...232
Figure 5.5: % error o f equivalent stress range fo r one JOSH 20 min sequence...233
Figure 5.6: % error o f the equivalent stress range fo r eight repeated sequences...233
Figure 5.7: Comparison o f PSD obtained from spectral analyser and F F T...234
Figure 5.8: Another comparison PSD against FFT....234
-Figure 5.9: Different starting sea-state...235
Figure 5.10: Plot o f number o f occurrence fo r different starting sea-state...236
Figure 5.11: PSD f o r one JOSH 20 min sequence...236
Figure 5.12: PSD f o r different length o f JOSH 20 min sequence...237
Figure 5.13: % changes fo r one frequency o f PSD JOSH 20 m in...237
Figure 5.14: Comparison o f the % error fo r PSD and Equivalent stre ss...238
Figure 5.15: Number o f Occurrence fo r different number o f transition...239
Figure 5.16: Plots o f sequence generated from different length sub-block duration...240
Figure 5.17: PSD f o r sequence generated from different length sub-block duration...240
Figure 5.18: % Occurrence o f sea-state fo r different duration len gth...241
-Nomenclature
ACPD Alternating Current Potential Difference
ACFM Alternating Current Frequency Measurement
Ag/AgCl Silver/Silver Chloride reference electrode
CA Constant Amplitude
e u
Creusot Loire IndustrieCP Cathodic Protection
HAZ Heat Affected Zone
HSE Health and Safety Executive
JOSH Jack-up Offshore Standard load History
NDE Non Destructive Evaluation
PSD Power Spectral Density
SCF Stress Concentration Factor
SRD Stress Range Distribution
SRPD Stress Range Probability Distribution
UCL University College London
VA Variable Amplitude
VACF Variable Amplitude Corrosion Fatigue
UEO Underwater Engineering Group
WASH Wave Action Standard load History
a Crack Depth
c Crack half length
C Paris Law constant
A Probe gap employed by ACPD technique
£ Spectral bandwidth parameter
F Force
f Frequency
Hs Significant wave height
K Stress intensity factor
m Paris Law constant
N Number of cycles
R Loading ratio
S Stress range
^yy(f) Wave loading spectral density function
Y Stress intensity correction factor
Chapter 1 Introduction and Background Work on Fatigue Testing
Chapter 1
1.0 Introduction and Background Work on Fatigue Testing
Recent years have seen a growing trend in the offshore industry to use Jack-up platforms
for production purposes due to the economic depression in the 1990’s. The harsh
economic environment meant instead of just employing these mobile platforms for
exploration purposes, they are also utilized for production purposes. Consequently, Jack-
up platforms are deployed for service that was for which they were not intended.
Jack-up platforms are mobile structures and therefore high strength steels are used in their
construction to economise on weight. The design o f these structures is predominantly
based on static strength considerations. For exploration, such an analysis is judged
sufficient since the role of deployment and operation are generally restricted to short
period. However, for production purposes, the long-term life or service life o f these
structures needs to be assessed. This assessment cannot be based on the existing
understanding o f medium strength steels, which are the more conventional platform
material. Even though high strength steels exhibit better performance under static loading,
there is no guarantee of improved performance under cyclic loading. There is also concern
on the brittle nature o f Jack-up steels caused by hydrogen.
Extensive studies have been conducted on the fatigue performance o f medium strength
steels, but relatively little is known about higher strength steels. The main concern
associated with these high strength steels, is the tendency for embrittlement in the
presence o f a hydrogen rich environment. This is particularly important as the corrosion
prevention method, Cathodic Protection (CP), is viewed as damaging to the higher
strength steels by encouraging the hydrogen activities.
Most o f the fatigue studies are usually carried out under constant amplitude loading, but
random loading is more realistic of the actual service condition. This is particularly
critical in the design o f mobile offshore platform, where the steels are susceptible to the
-C hapter 1 Introduction and Background Work on Fatigue Testing
environment and the loading condition. The offshore fatigue guidance under random
loading is limited, particularly for corrosive environment. This chapter reviews the current
practice in the field of fatigue testing including the variable amplitude loading and its
effects, with emphasis placed on high strength Jack-up steels and corrosion fatigue.
1.1 Jack-up Steels
Jack-up platforms are mobile offshore units, the design o f which can vary considerably.
Over the years. Jack-up rigs have had different numbers o f legs; nowadays most Jack-up
designs are based on three legs. They are usually towed to the desired location with their
legs raised. After reaching their destination, the legs are jacked down into the water to
make contact with the sea floor. The jacking process is powered by either electric motors
or hydraulic jacks, which are locked into the rack teeth that are welded to the side o f each
leg. The Jack-up leg foundations usually comprise spud cans, which are large steel plates
that penetrate the sea floor. The platforms are consequently jacked up above the water and
prepared for drilling.
The Jack-up steels need to have high strength in order to save on weight and bear the
required load. The weldable high strength steels associated with Jack-up construction
could be defined as having yield strengths in the region of 450 to 800 MPa. A steel
commonly used in the production of new Jack-up platform designs is SE702. This is a
weldable high strength steel with a yield strength o f about 690 MPa. The basis for using
the word weldable is because in the past, the welding process limited the use o f higher
strength steels. There was concern about the toughness of the material. However, by
lowering the carbon content o f steels, such as SE702, and increasing the toughness, they
become more weldable. The high strength o f the steels is achieved by quenching,
tempering and alloying processes. Thus, the modem quenched and tempered high strength
steels have the strength, toughness and weldability required for the constmction of a Jack-
up platform.
-Chapter 1 Introduction and Background Work on Fatigue Testing
The susceptibility o f higher strength steels to hydrogen embrittlement is of particular
concern. The induction o f hydrogen is usually caused by corrosion protection system such
as CP. Problematic hydrogen assisted cracking o f the high strength steels used in earlier
Jack-ups was highlighted in a report by Davey [1.1] for the UK Health and Safety
Executive, Offshore Safety Division. This report showed that cracks could occur in the
chord o f Jack-up legs under North Sea conditions and that the cracks all initiated in the
Heat Affected Zone (HAZ) o f the base material. The study concluded that the problem
was due to hydrogen assisted cracking, which was caused by cathodic overprotection.
Following the study on high strength steels using slow strain rate tests, it was
recommended that a Cathodic Protection (CP) level on Jack-up platforms should not
exceed -825mV (Ag/AgCl). The study concluded that any steel with a yield strength
above 600 MPa should be considered susceptible to hydrogen induced stress corrosion
cracking unless tests showed otherwise.
Due to the findings o f Davey, the 1990 UK HSE guidance on design and construction of
offshore structures [1.2] requires all Jack-up production platforms to be fitted with CP
limiters. However, the employment of CP limiters can be a very costly and unnecessary
process. The introduction of improved material properties and manufacturing processes
has altered the fatigue performance of new generations of Jack-up steels different to that
of old generations. Previous corrosion fatigue studies at UCL on higher strength steel
tubular joints by Etube [1.3] and Myers [1.4] indicated that overprotection is not as
damaging to the fatigue performance as first thought. The publish fatigue data for newer
generations o f Jack-up steels is limited, particularly under corrosive environments, and it
is only possible to determine the performance o f a particular high strength steels via
laboratory tests, as discussed in section 1.3 under corrosion fatigue.
1.2 Fatigue Analysis o f Welded Joints
Welding is the preferred joining technique used in the fabrication o f offshore structures.
The welded offshore structures are subjected to variable loading conditions during their
service lives. Thus, rigorous stress analysis and fatigue studies are carried out during the
-Chapter 1 Introduction and Background Work on Fatigue Testing
design o f the offshore structures identifying and analysing critical areas. This section
reviews topics associated with stress analysis and fatigue assessment o f welded structures.
This includes the main controlling parameter in fatigue crack initiation and propagation
mechanisms. The design guidance and recommendations used for the design of offshore
structures are reviewed with emphasis on the fracture mechanics and stress/life (S/N)
analysis techniques. The effects of corrosion fatigue and variable amplitude loading are
discussed in this section.
1.2.1 Stresses Employed In Fatigue Analysis
In stress analysis studies, stresses within welded joints are identified for design and
fatigue life calculations. As there are numerous definitions o f stress used for fatigue
analysis, this section presents the main definitions used throughout this thesis.
Nominal stress, cTnom, is the calculated stress remote from any discontinuities using basic stress formulae. The stress calculated does not take into account any influence of the
welded attachment, which would normally alter the stress distribution. An example for
tensile loading is shown in equation (1.1), where F is the force applied and A is the cross sectional area.
^nom - —
The concept o f a nominal stress avoids the need for complicated analysis. In complex
welded structures, nominal stress is often used to identify the loading of the structure
since the actual stress experienced is too complex to calculate.
Another form o f stress usually employed in fatigue calculations is the hot spot stress. This
is a form of geometric stress. Hot spot stress is a term used to describe the stress at a
critical point in the structure. This is usually located at a geometric discontinuity or a
notch. The hot spot stress ignores the stress concentration effect due to the weld toe. It can
be obtained by measuring the strain via strain gauges or calculated using parametric
-C hapter 1 Introduction and Background Work on Fatigue Testing
equations. The hot spot stress approach is used for components where the crack is
assumed to grow at the weld toe. Thus, it is not suitable for crack growth from embedded
defects or the root o f a fillet weld.
Most hot spot stresses can be determined from experiments by measuring the strain near
the weld toe at two specified locations from the weld toe. The stresses are then linearly
extrapolated to work out the stress at the weld toe. Usually the strain gauges, employed
for stress measurement, should be sufficiently far away from the weld toe, so that the
weld toe notch does not affect the measurements as represent in Figure 1.1. Various
methods for obtaining hot spot stress via strain gauges for tubular joints can be found in
guidance such as published by UEG offshore research [1.5].
1.2.1.1 Stress Concentration Factor
While nominal stress is rather easier to calculate for a structure, more detail is required for
a more complex analysis. The maximum stress for a particular joint can be obtained from
multiplying the nominal stress to the Stress Concentration Factor (SCF). The stress
concentration factor is the ratio of maximum stress at the point o f interest, Cmax to the nominal stress, anom- The equation (1.2) shows the relationship between SCF and cTmax’
^m ax (1’2)
This is particularly useful for calculating the stress in welded connections such as tubular
joints. Usually the SCFs can be obtained experimentally or by employing parametric
equations for welded offshore structures. Most o f the experimental methods are very
similar, involving the use o f strain gauges. For comparison of methodology, the
Underwater Engineering Group [1.5] discusses and compares the existing SCF design
codes for offshore structures. The usual practice for experimental measurement is to place
two strain gauges close to the weld toe so that the stress gradient can be measured. The
maximum stress is usually taken as the hot spot stress and is measured by linear
extrapolation to the weld toe. Strain gauges are often used to measure the hot spot stress
-Chapter 1 Introduction and Background Work on Fatigue Testing
on the actual structure. Another method for obtaining or predicting the SCF is to use
empirical formulae. Parametric equations based on experimental work or from finite
element analysis could be used to calculate SCF. The parametric solutions tend to be
conservative. For tubular joints, finite element analysis on thin shells can be used for
obtaining parametric equations for calculating SCFs [1.6]. For the analysis work on
welded T-butt plates, the parametric method for obtaining SCFs can be found from
published work based on 2D finite element models [1.7].
1.2.1.2 SN Approach
The SN approach is widely used in the design and assessment o f offshore structures. Its
practicality lies in its simplicity and that the results are based on experimental fatigue
data. For the S/N plot, the stress range, S, is conventionally taken as the hot spot stress range for tubular joints and nominal stress range for welded plates and N is the fatigue life
of the structures or the number of cycles until failure.
The plots for S/N design curves employed for the design of offshore platforms are usually
based on the BS 4360 50D type steels. The S/N curves can be obtained from published
literature standards such as the 1990 HSE Fatigue Guide [1.2]. The basic design S/N
curves are usually represented in the form of equation (1.3) and plotted on a log-log scale.
l-ogio W = Logi^
Z .% (5^ )Where
N is the predicted number to failure under stress range Sb
K] is a constant relating to mean S/N curve
d is the number of standard deviations below mean cris the standard deviation of Logio N
m is gradient o f the inverse slope of the curve.
Different welded specimens can be represented by various S/N curves. These are
categorised into different classes for different loading types and welding geometry. For
-Chapter 1 Introduction and Background Work on Fatigue Testing
example, the tubular joints are represented by the T curve. For welded plates, the curves
are divided into many classes, where the joint types are described in most fatigue
literatures such as the 1990 HSE Fatigue Guidance.
The data employed for the construction o f the fatigue S/N curves were obtained
experimentally. The best-fit line or the mean line can then be drawn through the points.
The standard deviation is calculated from the scatter o f the data. For the tubular joint
standard, the guidelines are for plate thickness o f 16mm and 32 mm. For safety reasons,
the design line is twice the standard deviation below the mean line.
The S/N curve from the guidance should be applied with caution to other grade of steels,
as it is only a guide for medium strength steels, such as BS 4360 50D. The data are also
obtained primarily under constant amplitude conditions. Thus, it is not necessarily
representative of a variable amplitude fatigue test. Constant amplitude tests for steels
usually display a fatigue limit, where any stress range below a certain level would have no
effect on the fatigue life. Under variable amplitude loading, the sequence consists o f a
range o f stress amplitudes. The larger stress ranges can propagate the crack, resulting in a
different behaviour nearer the fatigue limit. The S/N curve can be employed for designing
structures [1.8] that will undergo variable amplitude loading, but this could lead to errors,
since the data were not obtained from such tests. Thus more emphasis should be made
toward testing under realistic loading condition, since there are limited fatigue life data
available for tubular joints and welded plates tested under variable amplitude loading.
Studies carried out under variable amplitude loading are difficult to compare due to the
difference in the loading sequences and the method employed for equivalent stress range
calculation. Some older work employed the root mean square stress range method to
calculate the equivalent stress range while more recent studies would employ root mean
cube stress range. Root mean square method is usually associated to the energy for most
signal analysis. However for cumulative fatigue damage calculations, root mean cube is a
better fit for the slope of the crack growth curve o f welded joints [1.9]. For unprotected
joints in seawater, the 1990 HSE Fatigue Guidance suggested that the basic S/N curve be
reduced by a factor o f 2 for all joint classes. However, there is no clear guideline on
-Chapter 1 Introduction and Background Work on Fatigue Testing
higher strength steels (yield higher than 400 MPa) and the guidance suggests that the
reduction factor o f 2 might be inadequate.
1.2.2 Fracture Mechanics Approach
The fracture mechanics approach is more powerful than the SN approach, in the sense that
it can be used to model and predict the propagation rates of cracks. The idea is based on
using stress analysis to calculate the stress intensity factor. Most o f the early studies of
fracture mechanics were related to the energy-based theory by Griffith [1.10]. This was a
linear approach and more suitable for brittle fracture. His theory stated that a crack would
propagate when the decrease in elastic strain energy is at least equal to the energy required
to create the new crack surface. Griffith’s work was mainly used to show the importance
o f a notch and brittle fracture. This work ignored plastic deformation in the crack region,
which made it unsuitable for ductile metals and limited its use for most engineering
application. Most o f the calculations in fracture mechanics nowadays are based on stress
intensity factor (SIF). Irwin [1.11] first thought up this idea of stress intensity factor in
1957. He expressed the stress singularity ahead o f the crack tip in terms of the scalar
quantity or SIF, also known as K. This led to Linear Elastic Fracture Mechanics (LEFM), which attempted to explain fatigue crack propagation in terms of stress intensity factor.
Paris and Erdogan [1.12] suggested the relationship between fatigue crack advance per
cycle (da/dN) and the stress intensity range (AK). Though this assumption lacked scientific basis, it has found wide applications in modem fracture mechanics due to its
simplification of fatigue crack growth. This came to be known as the Paris law or the
power law.
For relatively ductile materials, LEFM is not applicable due to the occurrence of plastic
deformation. Irwin [1.11] recognised this and estimated the plastic zone ahead of the
crack tip. As long as the plastic zone size is small compared to the geometry of the
specimen, LEFM can be employed. The plastic zone correction is applied by increasing
the crack length to include the plastic zone. However, for larger plastic zone, other
methods are required instead.
-C hapter 1 Introduction and Background Work on Fatigue Testing
In 1961 Wells [1.13] suggested the idea of measuring the crack tip opening to overcome
the limitation of LEFM. He noted that during plastic deformation, the crack faces move
apart, which led to the work in crack tip opening displacement (CTOD). Wells assumed
that there must be a critical crack tip opening size for fracture to occur. For this same
problem. Rice [1.14] in 1968 developed the J integral idea, as the energy release rate o f a
non-linear material. CTOD is mostly used and developed in the UK, while J is developed in the US. Most o f the fatigue work carried out in this thesis was more concerned with
less ductile material like high strength steels and low stress failure by fatigue. This allows
LEFM to be applied to ductile metals. In this section different fatigue mechanisms and
analysis techniques associated with fatigue testing for offshore structures are reviewed.
1.2.2.1 Different Stages o f Fatigue Crack Growth
The fatigue life can be divided into three different stages, the initiation stage, crack
propagation stage and the final failure of the component. In this section, the fatigue
behaviours are discussed for the different stages.
Initiation is linked to microscopic material behaviour. Cracks are initiated by localised
cyclic plastic deformation, as a result of dislocation motion under cyclic strain. Since
dislocation mobility is greater at a free surface than in the bulk o f the material, in general,
fatigue initiation is a surface phenomenon. Normally cracks will initiate at locations with
the largest bending stress or strain range.
Under successive load cycles, dislocation motion may occur in different adjacent slip
planes in the crystalline material, resulting in extrusions and intrusions on the surface.
The formation of these intrusions is the initiation stage. Microscopic slip may occur in
single grains at a stress level below the general yield stress of the material. Under
continued load cycling, one or more intrusions may develop into what is commonly
denoted as stage I crack growth. In this first stage, the crack grows in a shear mode, the
same crystallographic plane upon which slip originally took place, i.e. in a plane oriented
-Chapter 1 Introduction and Background Work on Fatigue Testing
at 45 degrees to the maximum principal stress direction. Commonly these stages are
referred to as initiation or crack nucléation. In most welded structures, small flaws are
normally expected in the welded region, unless the surface has been treated, hence the
initiation period is short. Thus, the initiation period could be improved by introducing
compressive residual stress by shot peening or removing o f small flaws by grinding.
Therefore, in the case o f T-butt welded plates, the initiation period of the crack is
expected to be short when compared to the crack propagation period. However, for plain
surface structures, where the surface has been smooth-grounded and has no stress
concentration, the initiation stage would dominate the fatigue life. It is difficult to define
exactly when the initiation period ends and the crack propagation period commences. In
the case o f the fatigue study carried out in UCL, the initiation period is normally taken as
the number o f cycles required until a fatigue crack can be detected. This method is very
dependent on the operator and the technique employed in detecting the crack. From the
past work [1.4] carried out on tubular joint with Alternating Current Potential Drop
(ACPD) technique at UCL, a crack depth of 0,1 mm is usually taken as the initiation
point.
The crack propagation stage is of most interest, because many o f the offshore structures
are welded and are affected by geometric stress, and usually the propagation period is the
more dominant in the fatigue life of the structures. As the crack increases in depth from
the initiation stage, the crack growth direction will be in a direction perpendicular to the
largest tensile stress. From this point onward, the maximum principal stress and the
associated crack tip stress intensity factor range will be the principal driving force for the
crack growth.
In the final stage, the crack growth rate is rapid. The main factors affecting the crack
growth rate are the mean stress and the microstructure o f the material. However, the more
likely failure scenario for the specimen is due to the static load as the remaining static
strength o f the structure would have been sufficiently low for it to fail under a single
fatigue load.
-Chapter 1 Introduction and Background Work on Fatigue Testing
1.2.2.2 LEFM
The basis for fracture mechanics is in understanding the stress distribution around the
crack tip. The stress field near the crack tip is normally described by the stress intensity
factor, K. Although K is known as the stress intensity factor, it is not a factor as unlike Stress Concentration Factor (SCF), it has units. The stress intensity factor is only suitable
for small-scale yield linear elastic material, and the method is known as Linear Elastic
Fracture Mechanics (LEFM). This method does break down, when there is a large amount
of plasticity or non-linearity. However, as most of the studies for offshore structures are
subjected to relatively low stress levels, the plastic zone is likely to be small, making
LEFM adequate for most fatigue calculations.
Fracture mechanics calculations rely on using the Stress Intensity Factor (SIF) to describe
the crack tip condition. SIF is a function of crack geometry and the applied stress. The
stress field at the crack tip can be described by the equation (1,4). Figure 1.2 describes the notations used.
Where is the stress field component, r and 6 are the polar co-ordinates and fxy is the function o f 9.
For Mode I loading, the crack tip stress field on the expected fracture plane can be
represented as:
yy
r
The use o f the notation / in Æ}, this refers to Mode I (one) loading type for the crack
specimen. The crack surface can be displaced in three loading modes or in any
combination o f the three as represented in Figure 1.3. Mode I is tensile opening mode,
where the crack faces are separated normal to the plane o f the crack. Mode II is in plane
-Chapter 1 Introduction and Background Work on Fatigue Testing
sliding mode and Mode HI is tearing shear mode. Mode I is the most common mode and
the main factor in most fatigue crack growth situations. Mode II and IQ tends to be less
significant when compared to Mode I in most practical applications.
In order to be able to use K for normal engineering applications, modification is required for equation (1.5). This is written in the form o f equation (1.6) for Ki. Y is placed in the equation, as the finite correction factor for the plate and other properties like environment
and loading conditions. However, Y is normally a fimction o f the crack and plate geometry and can be found by analytical or experimental methods.
Kj = Yg^ [ ^ (16)
y = /W
0
-7
)Where for single edge notch t is the specimen thickness and a is the crack depth.
1.2.2.3 Fatigue Crack Growth
The fatigue crack growth rate can be divided into three different regions. Figure 1.4 shows
the curve o f crack growth rate against the stress intensity factor range. In region I, the
crack growth rate is low. Below a certain SIF range, there is no longer any crack growth.
This minimum SIF range is called the threshold value or AKth. The crack growth mechanism within this stage is most likely to be influenced by microstructural effects.
Mean stress is also highly influential as it can shift the value o f the threshold.
Region II is characterised by the linear relationship in the Log-Log curve. This is the
region where the Paris law may be applied. For air tests on mild steel under constant
amplitude loading, the microstructure and the mean stress level do not have a significant
effect on this region. However, under a corrosive environment, the influence of mean
stress can be very significant. The majority of the fatigue life crack growth falls into this
region, thus most crack modelling is done for this region. Region IH shows a high
-C hapter 1 Introduction and Background Work on Fatigue Testing
acceleration of crack growth rate, as this is a region o f high stress or low cycle loading.
Mean stress is highly influential, as is the material fracture toughness.
There have been attempts to characterise fatigue crack propagation. Paris and Erdogan
[1.12] were the first to suggest the characterisation o f crack growth under cyclic loading
by a power law relationship for region H crack growth. They related the AK value to da/dN as represented in equation (1.8).
— = c (a a :)'” (1.8)
dN
This equation became more widely known as the Paris and Erdogan law, where da/dN is the crack growth rate, AK is the stress intensity factor range, C and m are material constants. The stress intensity range can be defined as the difference between the
maximum SIF and the minimum SIF; AK = K ^ ^ ^ the original work, Paris based
his findings work on aluminium alloy and gave m values o f between 2 and 4. The amount of data available was limited hence the power law is open to many different
interpretations. This relationship also suggested that the crack growth rate in this region is
only dependent on the stress range and the effect o f load ratio, R, is insignificant. However, this is a break through in relating the fatigue crack propagation to the applied
stress and has found universal use in most fatigue calculations.
The power law can also be used to estimate the number of cycles required for a given
changes o f crack propagation. By integrating the equation (1,8), the number of cycles, Np, which is required to propagate the crack depth of a, to a/, can be calculated, as shown in
(L9).
-Chapter 1 Introduction and Background Work on Fatigue Testing
1.2.3 Factors Affecting Fatigue Life
The fatigue life o f a specimen can be affected by many factors, although the real driving
force is the stress range. Thus, when comparing the fatigue lives for the different
specimens in a test series, the only difference should be the stress range applied. Fatigue
life can be affected by factors such as the mean stress ratio, residual stress, specimen
dimension, material properties and environmental effects. The major points that will be
discussed in this section are the thickness effect, the mean stress level and the corrosion
effect.
1.2.3.1 Thickness Effects
When dealing with fatigue crack propagation in a specimen, it is important to identify the
size o f the specimen. For offshore structures, thicker plates are usually employed thus
plates o f 16 mm or more are used for fatigue testing. Thick specimens, however, are
found to have a shorter fatigue life. This could be due to a number o f factors, for example
the processing and manufacturing methods of the specimen and also the differences in the
stress distribution through the plate thickness.
The thickness o f the wall can have considerable effects on the fatigue life of a structure.
The crack growth rate is often higher in thicker specimens. In welded structures, where
the crack growth is the dominant part o f the fatigue life, the stress gradient is lower for a
thicker specimen. Thus, the same size flaw in a thick plate would be subjected to a higher
stress level for a larger region than that o f a thin plate as demonstrated in Figure 1.5. It is
important when comparing fatigue performance for different specimens that the
component size is taken into account.
The correction factor recommended by the 1990 HSE fatigue guidance [1.2], which was
based on the study by Gurney [1.15], is given in the form of equation (1.10),relating the corrected stress range to plate thickness.
-Chapter 1 Introduction and Background Work on Fatigue Testing
s = s.
( i . w )Where S is the stress range at the plate thickness, t. Sb is the stress range at the reference
plate thickness, ts and y is the thickness correction exponent. The value o f y employed depends on the reference plate thickness, tg, and is quoted as y = 0.3 for 16 mm thick plates in the 1990 HSE fatigues guidance [1.2]. This is particularly useful when
comparing data for different tests as all the results can be plotted on one S/N curve.
There is currently no specific thickness correction factor study for fatigue lives under
variable amplitude loading. A study on the thickness effect could be carried out, by noting
from studies for different variable amplitude fatigue specimens. However, these
specimens would have to be identical and tested under a similar loading spectrum. The
offshore technology report on variable amplitude loading published by the HSE [1.8]
recommended that there was no fundamental reason why the thickness correction factor
employed under constant amplitude would not be applicable to variable amplitude
loading.
1.2.3.2 Mean Stress
Mean stress is the average stress applied during cyclic loading. This can be introduced
into the structure either by a residual stress due to welding or post weld heat treatment or
static load. Therefore, for most welded offshore structures in the as-received condition,
the joints are likely to be under a certain amount of mean stress already.
Under constant amplitude cyclic loading, the maximum stress and the minimum stress are
normally used to calculate the mean stress. The preferred notation used for the mean
stress is in the form o f the load ratio, R. This is defined by the equation (1.11). This relationship represents the ratio o f the minimum load or stress, <Tmin, over the maximum load or stress,
-Chapter 1 Introduction and Background Work on Fatigue Testing
(1.11)
^max
Under variable amplitude loading, the load ratio cannot be represented by the ratio o f the
maximum to the minimum load. The method usually employed, is the clipping ratio.
Clipping ratio is the ratio between the maximum stress against the root mean stress of the
sequence. The ratio can also be represented by the ratio o f Kmean over Krms and is known as g r [1 16] as represented below.
Q ^ ^ ^ j n e a n _ ( IJ2)
^rms
In air, the effects o f mean stress on offshore steels may not be significant under constant
amplitude loading. However, under variable amplitude loading, the load interaction
effects may affect the crack initiation phase as well as the crack propagation mechanism.
Also, the stress level or the mean stress directly affects the corrosion fatigue mechanism.
Austin [1.17] carried out fatigue tests under variable amplitude loading on tubular joint.
He stated that the effect of mean stress on fatigue lives under variable amplitude loading
in air is less than under constant amplitude loading. The reason could be due to
“shakedown of crack tip stress field by large stress peaks in most severe sea states”. It is
to be expected that the effect o f mean stress could still be significant under variable
amplitude loading. Thus the “shakedown” could be referring to the breaking down of the
mean stress due to residual stress rather than static load.
1.2.3.3 Effects o f Residual Stresses
In engineering structures where cold working or welding of steels are involved, residual
stresses will usually exist. Residual stresses are locked in stresses within the structure.
Welding process can create residual stresses, which usually have a detrimental effect on
the fatigue life o f a structure, due to the tensile residual stress on the surface. However,
when used correctly, residual stresses can also be beneficial. Post weld treatment methods
-C hapter 1 Introduction and Background Work on Fatigue Testing
like shot peening, deliberately introduce surface compressive residual stresses, which in
turn improve fatigue life. Residual stresses can be described as static stresses caused by a
static load. They do not contribute to the stress range, but can contribute towards the mean
stress or stress ratio resulting in crack closure, thus affecting the fatigue performance.
Due to the welding process, a Heat Affected Zones (HAZ) is introduced into the welded
structure. The residual stresses are also introduced during the welding process due to local
beating and different cooling rates. This can shorten the fatigue life by creating surface
tensile residual stresses. The surface tensile stress can have a detrimental effect as far as
fatigue life is concerned. The tensile residual stress near the surface shortens fatigue life
by increasing the mean stress especially during the crack initiation stage. For crack
growth, once the crack propagates from the surface, the residual stresses are redistributed
and are unlikely to affect the propagation stage of the crack. However, it is difficult to
calculate and exactly measure the residual stresses. The effect o f residual stresses is
usually included into the fatigue calculation by increasing the mean stress. The residual
stresses can be reduced by post weld beat treatment. This involves beating o f the welded
region and cooling the specimen more uniformly, bi thicker specimen, it is advisable to
perform a post weld beat treatment to improve resistance to brittle fracture and also the
joint is more likely to be affected by the residual stresses due to different cooling rate
caused by the welding process.
Beneficial, compressive residual stress at the surface may induce the opposite effect and
prolong the crack initiation stage by reducing the effective tensile stress. The compressive
residual stress can be introduced by a shot peening method or by similar surface treatment
processes.
1.2.3.4 Environmental Effects
The environmental factors that could affect fatigue mechanism in most offshore structures
are the temperature and chemical environment. The most obvious factor for offshore
structures is the marine environment. The main concerns for the marine environment are


![Figure 3.17: S/N plot for the Material tested as compared to results from BS 436050D steel [3.11]](https://thumb-us.123doks.com/thumbv2/123dok_us/8508399.1392928/133.595.47.530.135.708/figure-plot-material-tested-compared-results-bs-steel.webp)