Evaluation of Lateral Load Pattern for RCC Irregular Building in Pushover Analysis Md Yaseen, Student, Structural Engineering,
MallaReddy Engineering College (Autonomous)
Srikanth Devi, Assistant Professor,
Department of Civil Engineering, MallaReddy Engineering College (Autonomous)
ABSTRACT
Nonlinear static analysis using pushover procedures are becoming increasingly common in engineering practice for seismic evaluation of building structures. Various distributions of lateral forces are recommended in FEMA-356 (2000) to perform a pushover analysis. However, the use of these force distributions does not adequately represent the effects of varying dynamic characteristics during the inelastic response or the influence of higher modes. In this paper, four lateral load patterns are evaluated by comparison of the pushover response of two twelve storey (i.e., L-Shape & C-Shape) RCC moment frame buildings.
Keywords: FEMA 356:2000, Lateral Load Distributions, Nonlinear Static analysis
1.INTRODUCTION
Nowadays design for seismic forces is still governed by force-based design principles, to evaluate the inelastic deformation demand in structural members in structural earthquake engineering practice is to use performance-based seismic evaluation methods. A most commonly used and popular approach to evaluate these inelastic demands is a “pushover” analysis in which a model of the building is subjected to an inverted variant distribution of lateral forces.
2.NON-LINEARSTATICANALYSIS
In this analysis, the static loads are applied in an incremental order until it reaches to the ultimate state of the structure. The non-linearity in the analysis comes from the various components of the structure, are modeled using a non-linear mathematical model.
This section describes the main steps of this analysis in a general manner. The application of the non-linear static procedure involves four distinct stages as described below and illustrated in Figures:
1. Define the mathematical model with the non-linear force deformation relationships for the various components/elements.
2. Define a suitable lateral load pattern. 3. Idealize the force-displacement curve. 4. Calculate the performance of the building.
2.1 NON-LINEAR FORCE DEFORMATION RELATIONSHIP
Figure 1. The generalized force deformation relation while exhibiting nonlinear behavior of a
International Journal in IT and Engineering, Impact Factor- 4.747
Figure 1 represents ductile behavior of a typical component, characterized by an elastic range (point A to point B on the curve). Followed by a plastic range (points B to E) it includes strain hardening (points B to C) and a strength-degraded range (points C to D) in which the residual force that can be resisted is significantly less than the peak strength, but still substantial. The residual resistance is observed until point E, where the final loss of resistance takes place. The performance of a structure is defined by the acceptance criteria to provide desirable information for evaluation or retrofit. Acceptance criteria for primary elements, that are required to have a ductile behavior, are typically within the elastic or plastic ranges between points B and C, depending on the performance level.
Uniform FEMA EFM Multi Modal 273 (SRSS)
Figure 2. Typical Load Patterns
3. LATERAL LOAD DISTRIBUTION
In this analysis, four different lateral load patterns were used to represent approximate distribution of inertia forces imposed on the structure during seismic event and these lateral load patterns are described as follows. Note that the storey forces are normalized with the base shear to have a total base shear equals to unity
3.1 'UNIFORM' LATERAL LOAD PATTERN
The lateral force at any storey is proportional to the mass at that storey, i.e.,
Fi=Σ m i m i (1)
Where Fi: lateral force at i-th storey
mi: mass of i-th storey
3.2 'ELASTIC FIRST MODE' LATERAL LOAD PATTERN
The lateral force at any storey is proportional to the product of the amplitude of the elastic first mode and the mass at that storey, i.e.
Fi=Σ m iØi m iØi (2)
Where Øi: amplitude of the elastic first mode at
i-th storey
3.3 'FEMA-273' LATERAL LOAD PATTERN
The lateral load pattern defined in FEMA-273 is given by the following formula that is used to calculate the lateral force at any storey:
Fi= mih
k i
Σ mihkii (3)
Where h: height of the i-th storey above the base
k: a factor to account for the higher
mode effects
(k=1 for T1≤0.5 sec and k=2 forT1>2.5 sec and
varies linearly in between T1 fundamental time
period)
3.4 'MULTI-MODAL (OR SRSS)' LATERAL LOAD PATTERN
The lateral load pattern considers the effects of elastic higher modes of vibration for long period and irregular structures and the lateral force at any storey is calculated as Square Root of Sum of Squares (SRSS) combinations of the load distributions obtained from the modal analysis of the structures as follows:
1. Calculate the lateral force at i-th storey for n-th mode from Equation (5)
Fin= Pn * mi * Øin *An (5)
Where Pn: modal participation factor for the
n-th mode
An: pseudo-acceleration of the n-th mode
SDOF elastic system
2. Calculate the storey shears,
Vin= Nj≥1Fjn (6)
Where N is the total number of stories 3. Combine the modal storey shears using SRSS rule.
4. Back calculate the lateral storey forces, Fi, at
storey levels from the combined storey shears,
Vi starting from the top storey.
5. Normalize the lateral storey forces by base shear for convenience such that
Fi'=Σ F Fi
i. (7)
The contribution of first three elastic modes of modal analysis was considered to calculate the 'Multi-Modal (or SRSS)' lateral load pattern in this study. Elastic First Mode', 'FEMA-273' and 'Multi-Modal (or SRSS)' lateral load patterns represents the inverted triangular lateral load patterns. 'Uniform' lateral load patterns represent the extreme case for invariant lateral load distribution.
4. DESCRIPTION OF THE STRUCTURES
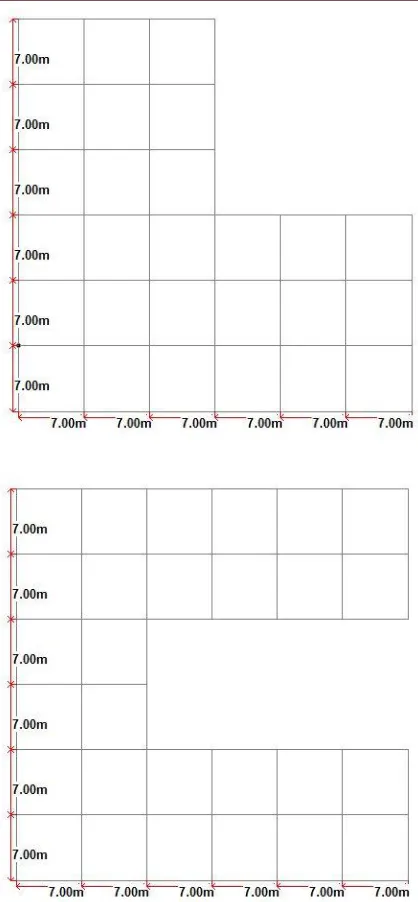
Figure 3.1 Elevation of 12 storey(L Shape) and 12 storey(C Shape) RCC Building
Fig 3.2 Plan of 12 storey (L SHAPE) and 12 storey(C SHAPE) RCC building
International Journal in IT and Engineering, Impact Factor- 4.747 5. RESULTS AND DISCUSSIONS
This section presents a summary of the results obtained for the both structures, in particular,
Global structure behavior and Storey
displacements.
5.1 GLOBAL STRUCTURE BEHAVIOUR
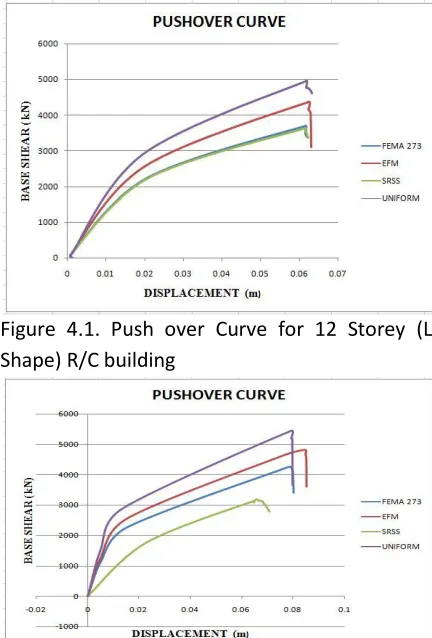
The global pushover curves of analytical models are shown in figures 4.1 and 4.2. As mentioned before, four lateral load patterns are utilized in the nonlinear static analysis. Roof displacement versus base shear diagrams for each load pattern, which will be called as the “pushover curve” is plotted on the same graph to represent global behavior of the models.
In view of the results obtained in the analysis, the deviation of the UNIFORM load pattern from the other lateral load cases increases as the number of stories increase, and also observed that the SRSS and FEMA 273 load patterns are shows consistent. EFM is in between the UNIFORM and SRSS.
Figure 4.1. Push over Curve for 12 Storey (L Shape) R/C building
Figure 4.2. Push over Curve for 12 Storey(C Shape) R/C building
5.2 STOREY DISPLACEMENTS
After performing the pushover analysis using the four load patterns, the obtained storey displacements are plotted on the same graph for each deformation level. Using these curves, comparisons and investigations on the results can be made. It is observed from the analysis results that the storey displacements obtained from the pushover analysis for four load
patterns are generally close to each other for the first 2 deformation levels. As deformation level increases the UNIFORM load pattern shows the higher values as compared to the FEMA and SRSS load patterns for both 12 stories (L & C shape) in 3, 4, 5 deformation
Figure 5. Storey displacements of 12 storey(L Shape) model for 6 deformation levels
Figure 6. Storey displacements of 12 storey(C Shape) model for 6 deformation levels
6. CONCLUSIONS
The following conclusions have been arrived from the study.
1. The load patterns of 'FEMA-273' and 'Multi-Modal (SRSS)') gives almost similar results for both shapes (C & L buildings). The variation in between EFM and SRSS are also proportional with height of the building.
2. Considerable differences were observed in the seismic demand prediction of triangular lateral load patterns for high rise structure since the variation in the height-wise distribution of triangular lateral load patterns is significant for high-rise structures.
3. The storey displacement prediction from triangular lateral load patterns are mostly in between the predictions of 'Multi-Modal (SRSS)' and FEMA 273 lateral load patterns for both structures.
Therefore, it would be better to estimate the storey displacement demand of structures by the average of the 'Multi-Modal (SRSS)' and 'FEMA 273' predictions.
4. In view of the results presented here, for pushover analysis of structures, the simplest lateral load pattern Elastic First Mode is recommended.
5. In view of the results presented here, the use of 'Uniform' load pattern is not recommended for all structures as it does not resemble a realistic distribution of inertia forces along the height as evidenced from the large discrepancies in the relevant results.
REFERENCES
1. Anil K. Chopra" Estimating Seismic demands for
International Journal in IT and Engineering, Impact Factor- 4.747
World Conference on Earthquake Engineering Vancouver, B.C., Canada August 1-6, 2004 Paper No. 5007.
2. Computers and Structures Inc. (CSI), 1998,
SAP2000 Three Dimensional Static and Dynamic Finite Element Analysis and Design of Structures V 16
.0.0, Berkeley, California.
3. E. Kalkan and S. K. Kunnath "Lateral Load
Distribution in Nonlinear Static Procedures for Seismic Design " ASCE 2004.
4. Federal Emergency Management Agency (FEMA),
2000, Pre standard and Commentary for the Rehabilitation of Buildings, FEMA-356.
5.Houssam Mohammad Agha, Li Yingmin , Oday Asal
Salih and A’ssim Al-Jbori "Nonlinear Performance of a Ten-Storey Reinforced Concrete Special Moment Resisting Frame (SMRF) " The 14th World Conference on Earthquake Engineering October 12-17, 2008, Beijing, China .
6. Indian Standard "Criteria for Earthquake Resistant
Design of Structures" IS 1893 (Part-1) -2002
7. Indian Standard "Code of Practice for Design Loads (Other Than Earthquake) for Buildings and Structures" IS 875 PART 1 Dead Loads — Unit Weights of Building Materials And Stored Materials.
8.Indian Standard "Code of Practice for Design Loads
(Other Than Earthquake) for Buildings And Structures "Is 875 Part 2 Imposed Loads.
9. Mehdi Poursha Faramarz Khoshnoudian and A.S.