Medical Devices: Evidence and Research
Actual performance of mechanical ventilators
in ICU: a multicentric quality control study
Leonardo Govoni1
Raffaele L Dellaca’1
Oscar Peñuelas2,3
Giacomo Bellani4,5
Antonio Artigas3,6
Miquel Ferrer3,7
Daniel Navajas3,8,9
Antonio Pedotti1
Ramon Farré3,8 1TBM-Lab, Dipartimento di
Bioingegneria, Politecnico di Milano University, Milano, Italy; 2Hospital
Universitario de Getafe – CIBERES, Madrid, Spain; 3CIBER de Enfermedades
Respiratorias, Bunyola, Spain;
4Department of Experimental
Medicine, University of Milan, Bicocca, Italy; 5Department of Perioperative
Medicine and Intensive Care, San Gerardo Hospital, Monza (MI), Italy;
6Critical Care Center, Sabadell
Hospital, Corporació Sanitaria Universitaria Parc Tauli, Universitat Autonoma de Barcelona, CIBERES, Spain; 7Department of Pneumology,
Hospital Clinic, IDIBAPS, Barcelona, Spain; 8Unitat de Biofísica i
Bioenginyeria, Facultat de Medicina, Universidad de Barcelona-IDIBAPS, Barcelona, Spain; 9Institut de
Bioenginyeria de Catalunya, Barcelona, Spain
Correspondence: Ramon Farré Unitat de Biofísica i Bioenginyeria, Facultat de Medicina, Casanova 143, 08036 Barcelona, Spain
Tel +34 93 4024515 Fax +34 93 4035278 Email [email protected]
Abstract: Even if the performance of a given ventilator has been evaluated in the laboratory under very well controlled conditions, inappropriate maintenance and lack of long-term stability and accuracy of the ventilator sensors may lead to ventilation errors in actual clinical practice. The aim of this study was to evaluate the actual performances of ventilators during clinical routines.
A resistance (7.69 cmH2O/L/s) – elastance (100 mL/cmH2O) test lung equipped with pressure,
flow, and oxygen concentration sensors was connected to the Y-piece of all the mechanical
ven-tilators available for patients in four intensive care units (ICUs; n = 66). Ventilators were set to
volume-controlled ventilation with tidal volume = 600 mL, respiratory rate = 20 breaths/minute,
positive end-expiratory pressure (PEEP) = 8 cmH2O, and oxygen fraction = 0.5. The signals
from the sensors were recorded to compute the ventilation parameters. The average ± standard
deviation and range (min–max) of the ventilatory parameters were the following: inspired tidal
volume = 607 ± 36 (530–723) mL, expired tidal volume = 608 ± 36 (530–728) mL, peak
pres-sure = 20.8 ± 2.3 (17.2–25.9) cmH2O, respiratory rate = 20.09 ± 0.35 (19.5–21.6) breaths/minute,
PEEP = 8.43 ± 0.57 (7.26–10.8) cmH2O, oxygen fraction = 0.49 ± 0.014 (0.41–0.53). The more
error-prone parameters were the ones related to the measure of flow. In several cases, the actual delivered mechanical ventilation was considerably different from the set one, suggesting the need for improving quality control procedures for these machines.
Keywords: equipment and supplies, medical devices, intravenous, quality assurance, health care quality assessment, ventilator accuracy, ventilation error
Introduction
Quality control and risk assessment, which are crucial to achieve the highest possible effectiveness of medical care,1 are particularly important in the intensive care unit (ICU) given the critical health status of the patients treated in this hospital setting.2,3 Among the different issues that should be addressed by quality control protocols in the ICUs, mechanical ventilation is especially relevant because this life-sustaining treatment must be carefully applied to strike a balance between insufficient ventilation and ventilation-induced lung injury.3
The first step to optimize mechanical ventilation is to use high-performance ventilators. Fortunately, currently available devices, using built-in sensors, micropro-cessors, and intelligent software, are able to adequately provide and monitor the target ventilation.4–7 The second step in mechanical ventilation quality control is to have personnel adequately trained to properly use the device accordingly to manufacturer instructions and to carry out an efficient servicing/maintenance of the equipment, ie, to ensure that the ventilators that have a satisfactory performance in the laboratory
Dove
press
O R I G I N A L R E S E A R C H
open access to scientific and medical research
Open Access Full Text Article
Medical Devices: Evidence and Research downloaded from https://www.dovepress.com/ by 118.70.13.36 on 24-Aug-2020
For personal use only.
Number of times this article has been viewed
This article was published in the following Dove Press journal: Medical Devices: Evidence and Research
are also working adequately in their daily use in clinical ICU routines. To ensure correct functioning of mechanical ventilators, ICU personnel are subjected to specific training and these devices are subjected to well-defined periodic maintenance procedures and recalibration. However, the frequency and procedures are established by manufacturers, hospitals, and legal regulations, with occasional servicing procedures for repairs. However, it is remarkable that there are no published data on the overall effectiveness of all the above-mentioned factors, therefore reporting the actual per-formance of mechanical ventilation delivered to patients in the clinical ICU routines.
Accordingly, the aim of this work was to carry out a cross-sectional multicentric study to assess the real-life performance of ICU ventilators. We measured whether the ventilators ready to be used or in use on patients provided the target ventilation and whether the devices accurately monitored the ventilation variables. To this end, a custom test lung, including an analog lung model and reference sensors, was developed, tested, and connected to all the mechanical ventilators that were currently in routine use in four university hospital ICUs.
Materials and methods
Test lung
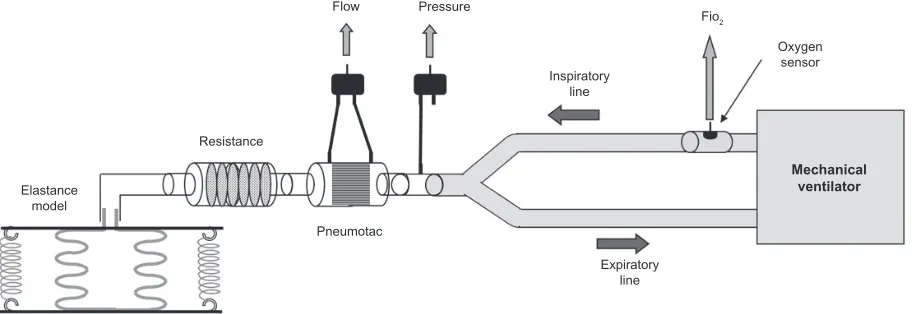
The actual performance of the ventilators was evaluated during mechanical ventilation of a custom-designed test lung (Figure 1). We tested the ventilator’s performance by connecting it to a reference lung instead of placing the sen-sors at the entrance to the endotracheal tube during patient ventilation to avoid breath-by-breath biological variability and the variation associated to the fact that different ventila-tor settings are used among patients in ICUs. The reference lung was connected to the ventilators through the bacterial filters used in the wards, and, depending on the
manufac-turer, they are characterized by a range of resistance of 1.2–1.5 cmH2O/L/s, and a dead space ranging from 60 mL to 63 mL. The device was built by connecting a mesh-type linear flow resistor of 7.69 cmH2O/L/s to an elastance model behaving as a purely elastic body with a static compli-ance of 100 mL/cmH2O. Linearity and reproducibility of the mechanical properties of these components have been tested accurately through bench evaluations over the range of operating variables.
Sensors
A pressure transducer (DCXL30DS; Honeywell, Minneapolis, MN) and a Fleisch pneumotachograph (Sibel, Barcelona, Spain) connected to a second differential pressure transducer (DCXL01DS; Honeywell) were placed at the inlet of the test lung in order to accurately measure the actual pressure and flow provided by the ventilator.
A zirconia solid-electrolyte cell oxygen sensor (MWL-F, 0.1%-95% O2±1%; Fujikura Ltd, Tokyo, Japan) was con-nected immediately before the Y piece on the inspiratory line to measure the oxygen fraction in the inspiratory gas (FiO2) only when needed (see below).
The pneumotachograph was calibrated in room air with a 3L calibration syringe (Sibel). To correct for the different viscosity of the gas mixture delivered by the ventilators (FiO2= 0.5), the calibration coefficient was corrected by a factor of 1.048.8 A water column was used to calibrate the pressure sensor. The oxygen sensor was calibrated using three different gas mixtures: room air (20.9% oxygen), pure nitrogen, and pure oxygen.
The values recorded were in ambient temperature and pressure either saturated with water vapor (ATPS) or in dry conditions (ATPD) depending if the ventilator was pro-vided with a heated humidifier or not. In order to evaluate
Elastance model
Resistance
Flow Pressure
Inspiratory line
Pneumotac
Expiratory line
Mechanical ventilator
Oxygen sensor Fio2
Figure 1 Experimental set-up.
Dovepress
Govoni et al
Medical Devices: Evidence and Research downloaded from https://www.dovepress.com/ by 118.70.13.36 on 24-Aug-2020
the amount of gas actually delivered to patients’ lung, the appropriate correction was applied to obtain the readings in body temperature and pressure, saturated with water vapor (BTPS) conditions by using the following equations:
VBTPS= (PA/(PA – PVapB)) × TB/TA
VBTPS= ((PA – PVapS)/(PA – PVapB)) × TB/TA
where PA is the barometric pressure measured at the begin-ning of each experimental session; PVapB is the vapor pressure at body temperature (47 mmHg); PVapS is the partial pressure of water in saturated air in ambient conditions. TB is body temperature (310 K), and TA is ambient temperature measured for each experimental session.
Experimental procedure
All the ventilators available for patient use at the time of the study in the four ICUs participating in this study were tested: Hospital Universitario de Getafe, Madrid, Spain (A); Ospedale San Gerardo, Monza, Italy (B); Hospital Parc Tauli de Sabadell, Barcelona, Spain (C); Hospital Clinic, Barcelona, Spain (D). The test lung was carefully calibrated prior to any experimental session and its performance and potential leaks evaluated. The same test lung and equipment was used for all measurements.
All the ventilators were configured in order to apply vol-ume-controlled mechanical ventilation with the following set-tings: tidal volume (Vt) = 600 mL, respiratory rate (RR) = 20 breaths/minute, inspiratory time = 1 second, expiratory time = 2 seconds, end-inspiratory pause = 10%, inspiration/ expiration (I/E) ratio = 0.33, positive end- expiratory pressure (PEEP) = 8 cmH2O and FiO2= 0.5. All the other parameters/ settings, such as corrections for compressible volumes of ven-tilator circuits, and presence and type of humidifiers were set by the staff. Calibration procedures, if needed, were followed as for usual clinical practice in the ward. The ventilators were connected to the test lung through the breathing circuit and an antibacterial filter (employed at each ICU) and used to venti-late the test lung. After 30 seconds of ventilation to allow for stabilization, the signals from the transducers were digitized with a sampling rate of 10 Hz for 3 minutes and stored on a per-sonal computer. During signal recording, the breathing pattern parameters displayed at the control panel of the ventilator were read, averaged, and registered. To avoid any alteration of the ventilators’ breathing circuits, during this recording the oxygen sensor was not connected to the test lung. Immediately after this first signal recording, the oxygen sensor was connected to the inspiratory line and its signal was recorded for 3 minutes after allowing at least 1 minute of ventilation.
Data analysis
From each recording, the flow signal was digitally integrated and any linear drift was corrected to obtain the lung volume signal (VL). As sensors were calibrated, the drift correction was used mostly to identify possible leaks in the circuits/ connections. For each breath, inspiratory volume (Vti), expi-ratory volume (Vte), peak pressure (Ppeak), PEEP, and RR were computed and averaged for each recording providing a single data point. FiO2 was evaluated by averaging the oxygen sensor signal. BTPS correction was applied as necessary.
Differences between hospitals and models of mechani-cal ventilator were assessed by two-way analyses of variance (ANOVA; SigmaStat; Systat Software Inc., San Jose, CA, USA) considering the absolute value of the discrepancy between the figure set on the ventilator and the delivered values actually measured in the test lung. Similarly, the values of the parameters read at the ventilator panel were compared to the actual values measured by the test lung. To this purpose, we decided to aver-age the readings provided by the ventilator during the trial. As it is not always clearly reported if a given ventilator is reporting independent values for each single breath or after filtering or smoothing procedures, considering an average reading over the recording period minimizes possible differences due to the data-processing strategy adopted by each model of ventilator.
Bland–Altman analysis was carried out for all the param-eters between the measured values and the measures provided by the ventilators.
Results
The stability of the sensors of the test lung was confirmed by the maximum deviation of calibration coefficients from their average values (computed by considering all calibra-tions performed over a period of 3 months) being less than 3.8%, 1.4%, and 1.0% for flow, pressure, and oxygen sensors, respectively. A total of 66 ventilators were studied: 23, 22, 14, and 7 in centers A, B, C, and D, respectively. The models were: Draeger Evita 4 (EVITA4, 25 machines) (Drägerwerk AG & Co. KGaA, Lubecca, Germany), Siemens/Maquet Servo I (SERVOI, 16 machines) (Siemens AG, Munich, Germany; MAQUET GmbH & Co. KG, Rastatt, Germany), Siemens SV900C (SV900C, 12 machines), Siemens/Maquet Servo 300 (SERVO300, 7 machines), Draeger Evita XL (EVITAXL, 3 machines), Siemens SV900D (1 machine), Draeger Evita 2 (EVITA2, 1 machine) and GE Engstrom (GE, 1 machine) (GE, Fairfield, Connecticut, USA). Table 1 summarizes for each type of ventilator the modality of volume display, the activation of algorithms for the compensation for compressible volume, and the presence of heated humidifier (HH) in the circuit.
Dovepress Quality control of mechanical ventilators in ICU
Medical Devices: Evidence and Research downloaded from https://www.dovepress.com/ by 118.70.13.36 on 24-Aug-2020
Table 1
Volume data reported
Compressible volume correction
# of ventilators
with HH filter
# of ventilators
without HH filter
Siemens SV900D ATP Yes 0 1
Siemens SV900C ATP Yes 7 5
Maquet Siemens Servo 300 BTPS Yes 2 5
Maquet Siemens Servo i STPD 0°C Yes 2 14
Drager Evita 2 BTPS Yes 0 1
Drager Evita 4 BTPS Yes 10 15
Drager Evita XL BTPS Yes 1 2
GE Engstrom BTPS No 0 1
Abbreviations: ATP, ambient temperature and pressure; BTPS, body temperature and pressure, saturated; STPD, standard temperature and pressure, dry; HH, heated humidifier.
800
750
700
650
600
550
500
11
10
9
8
7
22.0
21.5
21.0
20.5
20.0
19.5
19.0 0.50
0.49
20 BPM 20.1 BPM 8 cmH2O 8.4 cmH2O 600 mL
Inspiratory volume (mL)
Fi
O2
PEEP (cmH
2
O)
Respiratory rate (BPM)
607.5 mL
18.5
0 10 20 30 40 50 60
0 10 20 30
Ventilator # Ventilator #
40 50 60
0 10 20 30 40 50 60
0 10 20 30 40 50 60
0.54
0.52
0.50
0.48
0.46
0.44
0.42
0.40
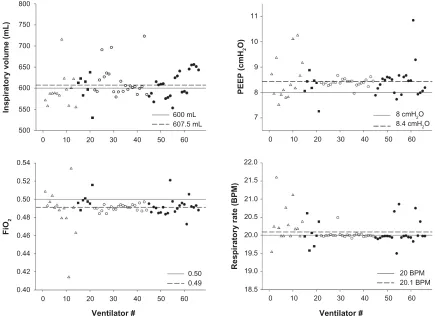
Figure 2 Actual values of several breathing pattern parameters delivered by the machines for each ventilator included in this study.
Note: Different symbols refer to the different hospitals.
Abbreviations: BPM, breaths per minute; PEEP, positive end expiratory pressure. The measured values of the breathing pattern indices delivered by the ventilator are reported in Figure 2. Although, on average, these values were very similar to the target set-tings, we found a remarkable intermachine variability. The ranges (min–max values) of the different variables were: 530–723 mL for Vti, 7.2–10.8 cmH2O for PEEP, 0.41-0.53% for FiO2, and 19.5–21.6 breaths/minute for RR. For these variables, 5, 7, 1 and 0 machines showed errors greater than 10%, respectively. The variables showing the greater variability were the volumes, with machine delivering up to
20% more and 11% less than the preset value of 600 mL, and the PEEP, with delivered values up to 35% more and -9% less than the preset value of 8 cmH2O.
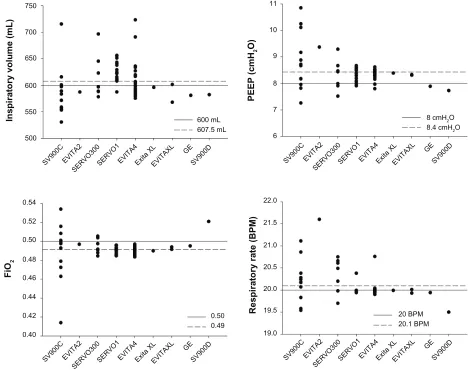
The same variables are represented in Figure 3 grouped by ventilator model. In this case, the results are quite variable, with the variability within the same model being, for most variables, bigger that the variability between models.
This is confirmed by the absence of statistically significant differences in the discrepancies between the preset and actual values between hospitals. Considering the different ventilator
Dovepress
Govoni et al
Medical Devices: Evidence and Research downloaded from https://www.dovepress.com/ by 118.70.13.36 on 24-Aug-2020
750
700
650
600
550
500
Inspiratory volume (mL)
FiO
2
PEEP (cmH
2
O)
Respiratory rate (BPM)
SV900 C
EVITA2
SERVO300SERVO1EVITA 4
Exita XLEVITAXL GE
SV900 D
SV900 C
EVITA2
SERVO300SERVO 1
EVITA 4
Exita XLEVITAXL GE
SV900 D
SV900 C
EVITA 2
SERVO300SERVO1EVITA 4
Exita XLEVITAXL GE
SV900 D
SV900 C
EVITA 2
SERVO300SERVO 1
EVITA 4
Exita XLEVITAX L
GE SV900
D 11
10
9
8
7
6
0.54
0.52
0.50
0.48
0.46
0.44
0.42
0.40
22.0 600 mL
607.5 mL
0.50 0.49
8 cmH2O 8.4 cmH2O
20 BPM 20.1 BPM 21.5
21.0
20.5
20.0
19.5
19.0
Figure 3 Actual values of several breathing pattern parameters delivered to the test lung for each ventilator model.
Notes: Labels identify the following ventilator models: EVITA4: Draeger Evita 4 (25 machines); SERVOI: Siemens/Maquet Servo I (16 machines); SVC900C: Siemens SV900C (12 machines); SERVO300: Siemens/Maquet Servo 300 (7 machines); EVITAXL: Draeger Evita XL (3 machines); SV900D: Siemens SV900D (1 machine); EVITA2: Draeger Evita 2 (1 machine) and ENGSTROM: GE Engstrom (1 machine).
Abbreviations: BPM, breaths per minute; PEEP, positive end expiratory pressure; FiO2, fraction of inspired oxygen.
models, the two-way ANOVA analysis showed a significant difference in the errors between the ventilator models only for PEEP (P= 0.009) and RR (P, 0.001) values. The most relevant difference for PEEP errors (between SV900C vs SERVOI and vs EVITA4) was 10% and for RR (between EVITA2 vs SERVOI) was 7.6%.
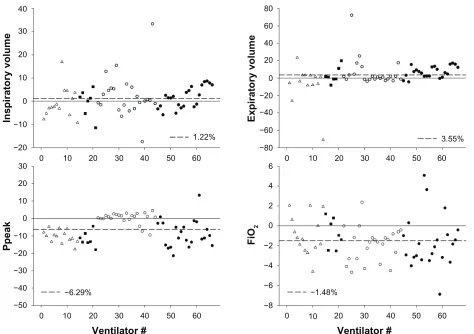
Figure 4 shows the differences between values measured by the ventilator and the values measured at the test lung. In this case, there was a large variability between machines. The range (min–max values) of the percentage differences between machine reading and actual values were: -17% -33% for Vti, -70%-72% for Vte, -21%-13% for Ppeak, and -6.8%-5% for FiO2. For these variables, 6, 18, 25, 7, 0, and 0 machines showed errors greater than 10%, respectively. No significant differences were found between hospitals. Only Ppeak differed between ventilator models, showing significant statistical difference (P < 0.01). In Figure 5,
cumulative distribution plots show the number of ventilators with a given accuracy value for Vt, PEEP, FiO2, and RR. Finally, Bland–Altman analysis plots for all the measured parameters are shown in Figure 6.
Discussion
The aim of this study was to evaluate the ventilation delivered to patients in an ICU. In particular, we were wondering how the ventilator parameters prescribed by the attending physi-cians and programmed on the ventilator are actually deliv-ered to patients. To this end, we created a test lung and test protocol to simulate a patient admitted to an ICU, therefore testing not only the efficacy of the device itself, but also of all the procedures that are defined and implemented to keep the devices working properly with time (maintenance, cali-brations, effectiveness of repairs, etc). The most important finding was that, even if there was good overall performance
Dovepress Quality control of mechanical ventilators in ICU
Medical Devices: Evidence and Research downloaded from https://www.dovepress.com/ by 118.70.13.36 on 24-Aug-2020
0 −20 −10 10 20 30 40
0
−50 −40 −30 −10
−20 10 20 30
0
−80 −60 −40 −20 20 60
40 80
0
−8 −4 −2
−6 2 4 6
0
10 20 30 40 50 60
Inspiratory volume
Ppeak
Expiratory volume
FiO
2
1.22% 3.55%
−1.48% −6.29%
0 10 20 30 40 50 60
0 10 20 30 40 50 60
0 10 20 30 40 50 60
Ventilator # Ventilator #
Figure 4 Percentage difference between values reported by the ventilator and the ones measured by the test lung for the different breathing pattern parameters considered in the study. Symbols are used as in Figure 1.
Abbreviations: Ppeak,peak pressure.
shown by the ventilators, we found considerable performance variability with substantial errors in some individual cases, with some units showing errors greater than 10%, especially in the ventilation volumes. Even if these differences are unlikely to have major clinical relevance, the variability observed in our data underlines the importance of regular testing and maintenance procedures.
In contrast with previously published reports where the performance of different mechanical ventilator models was studied under well-controlled laboratory conditions7–9 on one single ventilator unit, in the present work we analyzed the actual performance of all ventilators during routine use within the ICU, with the aim of evaluating the reproducibility of mechanical ventilator performance in typical use.
Remarkably, the ventilators tested in this study were either the ones just disconnected from a patient or the ones ready for immediate use in new patients. It is also of note that neither the nursing/technical staff in care of ventilators nor the company/service in charge of ventilator maintenance
were aware of the study. Accordingly, the performance results we obtained are representative of the way ventilators actually perform on patients in clinical practice.
The absence of noticeable systematic errors in the average ventilator performance suggests that the general maintenance procedure followed by the different centers was consistent. The finding that the level of errors found in ventilator per-formance did not depend on the hospital adds support to this interpretation. However, we found a considerable variability in the errors, mostly for volume- and Ppeak-related variables (Figure 4), strongly suggesting that either the frequency or the procedures of calibration/servicing need to be adjusted in order to avoid errors produced by any of the devices used in the ICU. Obviously, what is important for patient safety and medical care quality control is not the average of errors, but the individual figures.
These results that we found for these ICU devices are similar to the ones reported for home mechanical ventilation.10 However, given the more critical conditions of
Dovepress
Govoni et al
Medical Devices: Evidence and Research downloaded from https://www.dovepress.com/ by 118.70.13.36 on 24-Aug-2020
ICU patients and the greater complexity, costs, and servicing intervention of ICU devices, our results suggest that there is some room for further improvement in the performance of mechanical ventilators.
Limitations of the study
In this study, we only simulated one value of respiratory system impedance. Given that the performance of ventila-tors may depend on the mechanical load of the patient, the results we obtained do not cover all the range of potential cases found in clinical routine. However, the values of
respi-ratory resistance and compliance that we implemented in the lung model, although reasonably representative of patients under mechanical ventilation, are in no way exceptional. In fact, greater mechanical impedance values are expected for a significant number of ICU patients subjected to mechanical ventilation because of severe respiratory diseases (eg, chronic obstructive pulmonary disease exacerbations, pneumonia, acute respiratory distress syndrome). It could be anticipated that in such instances, ventilator performance could be poorer than the one observed with the lung model used in this work.
0
100 95 90 85
Cumulative ventilators (%)
80 75 70 65
20 40 60 80 100
Vt
0
100 95 90 85
Cumulative ventilators (%)
80 75 70 65
20 40 60 80 100
FiO2
Accuracy (%)
0
100 95 90 85 80 75 70 65
20 40 60 80 100
RR 0
100 95 90 85 80 75 70 65
20 40 60 80 100
PEEP
Accuracy (%) Figure 5 Cumulative percentage of ventilators as a function of their accuracy in delivering the preset inspiratory volume, PEEP, FiO2, and respiratory rate. Abbreviation: PEEP, positive end-expiratory pressure; RR, repiratory rate; Vt, tidal volume.
Dovepress Quality control of mechanical ventilators in ICU
Medical Devices: Evidence and Research downloaded from https://www.dovepress.com/ by 118.70.13.36 on 24-Aug-2020
−300 −200 −100 0
(Read – measured)
100 200
560
540 580 600 620
Inspiratory volume (mL)
640 660 680
0.42
0.40 0.44 0.46 0.48 0.50 0.52 0.54 −4
−2 0 2
(Read – measured)
4 8
6
−0.03 −0.02 −0.01 0.00 0.01
(Read – measured)
0.02 0.05
0.03 0.04
18
16 20 22 24
Ppeak (cmH2O)
FiO2
Average Average
26 28
−600 −400 −200 0 400
200 600
500
400 450 550 600 650
Expiratory volume (mL)
700 750 800
19.5
19.0 20.0 20.5 21.0 21.5
−3 −2 −1 0 1 3
2
−1.0 −0.8 −0.6 −0.4 −0.2 0.0 0.2 0.8 1.0
0.4 0.6
8
7 9 10
PEEP (cmH2O)
Respiratory rate (BPM)
11 12
Figure 6 Bland–Altman analysis graphs plotted for inspiratory and expiratory volumes, PEEP, FiO2, and respiratory rate. Abbreviation: PEEP, positive end-expiratory pressure; BPM, breaths per minute; Ppeak, peak pressure.
Another limitation of this study is that, for the sake of comparison, we only tested one ventilator mode (controlled volume ventilation) and with only one set of ventilation parameters (eg, Vt, PEEP, f). Although both the investigated ventilator modes and settings are reasonably representative of mechanical ventilation of ICU, they do not cover the full possible spectrum. In particular, we did not test pressure-controlled ventilation and assisted ventilation. Accordingly, we were not able to test the real-life perfor-mance of setting, such as inspiratory and expiratory triggers, which have been shown to be particularly critical in labora-tory studies carried out in controlled bench conditions instead of real clinical routines.
As it is not unusual that old machines are present in small number of units in an ICU, we kept the composition of the set of devices in use in the ward, therefore including also ventilators that were present as only one or two units, as this is what a patient admitted to that unit will receive. As a consequence, several ventilator models were represented by only small numbers, making it impossible to apply statistical analysis on performances of these units.
Finally, given the numbers of ventilator and ICU involved, we are not able to identify which factors between ventilator model, maintenance frequency and procedure, use and type of humidifier and filters, and unplanned repairs/servicing
Dovepress
Govoni et al
Medical Devices: Evidence and Research downloaded from https://www.dovepress.com/ by 118.70.13.36 on 24-Aug-2020
Medical Devices: Evidence and Research
Publish your work in this journal
Medical Devices: Evidence and Research is an international, peer-reviewed, open access journal that focuses on the evidence, technology, research, and expert opinion supporting the use and application of medical devices in the diagnosis, treatment and management of clini-cal conditions and physiologiclini-cal processes. The identification of novel
devices and optimal use of existing devices which will lead to improved clinical outcomes and more effective patient management and safety is a key feature. The manuscript management system is completely online and includes a quick and fair peer-review system. Visit http://www. dovepress.com/testimonials.php to read real quotes from authors.
Submit your manuscript here: http://www.dovepress.com/medical-devices-evidence-and-research-journal of the devices, constitute the major source of the variability
we observed.
Conclusion
It is difficult to predict the clinical impact of the ventila-tor errors we found in this study. Accurate ventilaventila-tor performance is crucial to provide the patient with the best ventilatory strategy. When setting mechanical ventilation, clinicians should be aware that the target tidal volume might be delivered with errors greater than 10%, even if in a minor-ity of the cases.
Acknowledgments and contributions
This work was supported in part by the Spanish Minis-try of Economy and Competitiveness (SAF2011-22576, FIS-PI11/00089).
RLD and RF conceived the study and wrote the manu-script. LG developed the experimental setting, performed experiments and data processing and contributed to writing the manuscript. DN and AP contributed to the data inter-pretation and discussion of the results. OP, GB, AA, and MF contributed to the measurements and participated in the discussion of the results and in drafting the manuscript.
Disclosure
The authors have no competing interests with this study.
References
1. Farré R, Navajas D. Quality control: a necessary, but sometimes overlooked, tool for improving respiratory medicine. Eur Respir J. 2009;33(4):722–723.
2. Krimsky WS, Mroz IB, McIlwaine JK, et al. A model for increas-ing patient safety in the intensive care unit: increasincreas-ing the imple-mentation rates of proven safety measures. Qual Saf Health Care. 2009;18(1):74–80.
3. Kollef MH, Micek ST. Using protocols to improve patient outcomes in the intensive care unit: focus on mechanical ventilation and sepsis. Semin Respir Crit Care Med. 2010;31(1):19–30.
4. Dellacà RL, Farré R. Noninvasive ventilation: the impact of machine choice. The Buyer’s Guide to Respiratory Care Products. 2009:30–39. 5. Chipman DW, Caramez MP, Miyoshi E, Kratohvil JP, Kacmarek RM.
Performance comparison of 15 transport ventilators. Respir Care. 2007;52(6):740–751.
6. Ferreira JC, Chipman DW, Hill NS, Kacmarek RM. Bilevel vs ICU ventilators providing noninvasive ventilation: effect of system leaks: a COPD lung model comparison. Chest. 2009;136(2):448–456. 7. Lyazidi A, Thille AW, Carteaux G, Galia F, Brochard L, Richard JC.
Bench test evaluation of volume delivered by modern ICU ventilators during volume-controlled ventilation. Intensive Care Med. 2010;36(12): 2074–2080.
8. Yeh MP, Adams TD, Gardner RM, Yanowitz FG. Effect of O2, N2, and CO2 composition on nonlinearity of Fleisch pneumotachograph char-acteristics. J Appl Physiol. 1984;56(5):1423–1425.
9. Thille AW, Lyazidi A, Richard JCM, Galia F, Brochard L. A bench study of intensive-care-unit ventilators: new versus old and turbine-based versus compressed gas-turbine-based ventilators. Intensive Care Med. 2009;35(8):1368–1376.
10. Farré R, Navajas D, Prats E, et al. Performance of mechanical ventila-tors at the patient’s home: a multicentre quality control study. Thorax. 2006;61(5):400–404.
Dovepress
Dove
press
Quality control of mechanical ventilators in ICU
Medical Devices: Evidence and Research downloaded from https://www.dovepress.com/ by 118.70.13.36 on 24-Aug-2020