Article
1
The Influence of Chief Executive Officer’s
2
Compensation on Firms’ Performance in the Nigeria
3
Banking Industry
4
Ehijiele Ekienabor 1,†,*, Damian Mbaegbu 2,† and Sunday Aguwamba 2,†
5
1 Department of Business Administration, College of Business and Management Studies, Igbinedion
6
University, Okada, Edo State, Nigeria.; ehismcman@yahoo.com
7
2 Department of Business Administration, College of Business and Management Studies, Igbinedion
8
University, Okada, Edo State, Nigeria.
9
* Correspondence: ehismcman@yahoo.com; Tel.: +2348032912296
10
† These authors contributed equally to this work.
11
Abstract: This is a quantitative research based on secondary sources of data. The study examines
12
the influence of Chief Executive Officer’s (CEO) compensation on a firm's performance. The
13
objectives of the study were to determine if CEO compensation and firm size do significantly
14
influence a firm’s performance. In other to elicit information to examine the relationship between
15
the variables, the convenience sampling technique, with the combination of both the cross-sectional
16
and time-series data (panel data) were used since they provide greater precision and guard against
17
having an illusory sample. 10 banks quoted on the Nigerian Stock Exchange were sampled for easy
18
accessibility of data. The least square regression technique was used to test the hypotheses of the
19
study. Two hypotheses were tested using panel least square (EViews 8) and from the research
20
work, we summarize the following results; there is a significant relationship between CEO
21
compensation and firm performance in the Nigerian banking industry. In addition, firm size does
22
significantly influence firm performance in the Nigerian banking industry. The study recommends
23
that there should be proper compensation review as this will increase the productivity of the
24
executives. Since increased pay is necessary for the efficiency of the workers, it is advised to ensure
25
a considerable pay as this will ensure for efficiency in the organization. In addition, since the core
26
goal of setting up any business is to make a profit, business organisations should sort out ways at
27
maximising profit and this could include cutting down expenses such as cutting down excessive
28
employees’ pay (CEOs pay especially) and setting apposite pay package for employees. Therefore,
29
policymakers (board of directors) should make an effort to align CEO’s pay with the firm’s
30
capability to pay.
31
Keywords: chief executive officer; compensation; firm performance; Nigeria banking industry;
32
chief executive officer compensation; firm size; return on asset
33
34
1. Introduction
35
Compensation management is one of the most imperative elements of personnel management,
36
which covers reward in the form of salaries and wages and varied forms of non-financial economic
37
payments known as indirect compensation. Top executives of companies, if erroneously or
38
inadequately compensated may not have the right motivation to carry out tasks in the overall
39
interest of the organization. Many scholars consider the issue of Chief Executive Officers (CEOs) pay
40
as an essential component of corporate governance mechanism for the alignment of firm managers
41
interest with the shareholders interest while some other experts argue that the gap in CEO pay
42
arrangement and divergence are imperative and widespread and therefore sees it otherwise
43
(Amzaleg, Ben-Zionb & Rosenfield, 2014; Bebchuk & Fried, 2003).
44
The conflict of interest amid CEOs and shareholders has gained importance in public policy
45
debates and within academic research in recent years. Bhagat, Bolton and Subramanian (2010) posit
46
that one of the most important roles of a board is to take into service a CEO with remarkable skill.
47
Finding and taking into service an apt CEO is an important task for the board of a firm. On the other
48
hand, even though the apt CEO is employed, there are a number of concerns which come about. The
49
key concern that comes up is the CEO pay, and whether or not this can influence the performance of
50
a firm. Investors nevertheless expect the CEO who is receiving high pay to perform and prove his
51
merit. Shareholders, politicians, regulators and the media have all evaluated on the suitability of the
52
level of CEO compensation.
53
Several pieces of evidence from the studies of compensation and performance have exhibited
54
mix outcomes and patterns with some suggesting the alignment of managers’ interest with those of
55
shareholders through right compensation packages to encourage the executive to perform in the
56
good interest of shareholder (John, Mehran & Qian, 2010 and Olaniyi & Obembe, 2015). Critics assert
57
that CEO’s compensation is disproportionate because it is feebly linked to firm performance and also
58
the problems linked to CEO compensation are therefore pervading that most CEO’s get surplus pay.
59
Tosi, Werner, Katz and Gomez-Mejia (2000), Finkelstein and Boyd (1998), and Johnson (1982) found
60
no correlation between the variables (CEO’s compensation and firm performance). While Ozkan
61
(2007), Brick, Palmon and Wald (2005) and Belliveau et al. (1996) found a strong positive correlation
62
connecting the variables. Another study carried out by Sigler (2011) revealed a positive significant
63
correlation between CEO’s compensation and firm performance quantified by return on equity.
64
Similarly, Ozken (2007) and Kabla (2008) are also of the opinion of a positive significant
65
pay-performance relationship in their studies across several industries, cultures and time. However,
66
Jensen and Murphy (1990) contradict this thinking by establishing a negative correlation between
67
compensation and financial performance. In Nigeria however, few researchers have delved on the
68
issue. Researchers like Ogbeide and Akanji (2016), Olalekan and Bodunde (2015), Olaniyan (2015),
69
Omoregie and Kelikume, (2017), Adegoroye, Oluwafemi, Akanfe and Oladipo (2017), and Olaniyi,
70
Obembe and Oni (2017) have carried out research relating to executive compensation and firm
71
performance. Consequent upon the above, the present study tries to investigate upon existing
72
research thus contributing more knowledge to the study under review. The motivation to conduct
73
this study therefore is to on a reasonable scale improve on the literature and provide a platform
74
upon which further research can be done. Accordingly, this article tries to evaluate the extent CEO’s
75
compensation influences the banking industry performance.
76
2. Chief Executive Officers (CEOs) Compensation
77
As stated by Shin, Lee and Joo (2009), chief executive officers’ compensation consists of the
78
monetary compensation along with other non-monetary rewards received by an executive for their
79
service into the firm. Chief executive officers’ compensation is a combination of salary, bonuses,
80
shares or call options on the benefits, company stock and perquisites, ideally configured to take into
81
account the desires of the organization and the executive, government regulation, tax law, and
82
rewards for performance. A firm’s Board of Directors designs the CEO compensation remunerations
83
usually by the compensation committee consisting of independent directors, with the intent of
84
incentivizing the executive team, who have a momentous impact on firm strategy, decision-making,
85
and value creation in addition to enhancing Executive Retention (Adegoroye, Oluwafemi, Akanfe &
86
Oladipo, 2017).
87
Sun, Xianging and Huang (2013) delineate executive compensation as reward packages paid to
88
senior leaders in business, most habitually the CEO. Executive pay packages differ from employee
89
pay both in scale and the benefits offered. Stock option forms a fundamental component of a lot of
90
executive compensation packages, and a huge basic salary, though many will offer to a large extent
91
more favorable stock choices and a low standard salary to lower the tax burden.
92
3. Firm Size
93
This variable is vital in ascertaining CEO pay. Following a prior study, the market capitalization
94
is calculated by multiplying the price of the share at year-end with the number of shares outstanding
95
at the year-end. Market capitalization = Share price at year-end × Number of shares outstanding.
Many different methods can be used for the measurement of firm size; this could be by way of
97
employees, sales, assets or value-added features. On the whole, those using the technological theory
98
based on economy of scale derived from capital inputs would use assets or only sales figures for the
99
measurement purpose. Assets and sales are appropriate techniques of dimension to get a
100
measurement for size; however, the principal dilemma would be how the range of costs, agency and
101
transactions influence profits. Measuring the employees’ enrolment and value-added measurements
102
are other choices in measuring the size of the firm in organizational theories as opposed to assets or
103
sales. Further, the larger the size of a firm the larger the board size and invariably the higher the
104
CEOs pay.
105
4. Firm Performance
106
Performance could be the accomplishment of task measured against predetermined or
107
recognized standards of precision, cost, completeness, and speed. By comparison, performance is
108
considered to be a satisfaction of an obligation in a way that discharges the performer from the
109
liabilities laid down under the contract. Firm performance encircles the actual output or outcomes of
110
a firm as quantified against its projected outputs (or objectives and goals). Firm performance
111
encompasses three definite areas of firm outcomes: (i) Shareholder return (total shareholder return
112
and economic value added) (ii) Product and market performance (share, sales, market) and (iii)
113
financial performance (profit, return on assets and return on investment) The nature of corporate
114
performance and measurement has been a topic for both practitioners and scholars since
115
organizations were first formed. How to determine if the efforts of the organization are being put to
116
their best use and are achieving the desired outcome at the heart of several disciplines.
117
Hansen and Mowen in their study in 2005 postulates’ that firm performance is quite vital to the
118
executive since it is a result that’s been achieved by an individual or some people in a firm related to
119
its authority and duty in reaching the goal legally, not despite regulations, and in compliance with
120
the moral and ethics. Performance may be the purpose of the capability of an organization to
121
manage and gain the resources at unique procedures to successfully come up with a competitive
122
advantage. While the management disciples concentrate on how to improve collaborate
123
performance particularly and in particular entrepreneurship and strategic management research,
124
accountants devote their attention to fairly presenting the performance of the organization.
125
In this study, firm performance is proxy by return on asset and used as the dependent variable.
126
This will be briefly explained next.
127
5. Return on Assets (ROA)
128
Return on assets is the percentage corporate return on assets or the ratio of earnings to average
129
total assets. The performance of a firm is dependent on several factors (e.g., economy), but return on
130
asset and return on equity remain the most significant factors (Usman, 2010). The reason behind
131
picking out ROA in this study is the fact that the return on assets quantifies the potency of the
132
economic unity in making use of its assets to make a profit. The greater the ratio the better the
133
economic unity for the reason that it signifies management's competence in the use of its assets to
134
generate profit (Mou & Wanrapee 2015).
135
In addition, it reflects the ratio of just how much a firm has earned on its asset base, and also the
136
return on assets. Return on assets will be made use of in this study as a dependent variable for the
137
reason that the net profit in correlation to the selected firms’ asset base is a great method of
138
quantifying the level of returns on investments made in the companies. Mou & Wanrapee (2015).
139
140
6. Review of Prior Studies
141
CEO compensation has quite a few components. The fundamental type is a fixed base salary.
142
Second to fixed base salary, CEO’s can be given compensation in the forms of share-based payments,
143
stock options, cash bonuses etc. Cash bonus is a payment given by an organization based on the
performance of the CEO. A firm may also bring in incentive programs so as to align interests
145
between the shareholders and CEO. Chief executive officers are then awarded the right to purchase
146
or obtain stock options or company shares, and also this procedure eventually leads towards the
147
stock option payments and share-based payments to CEO. Prior studies have various findings
148
concerning the influence of CEO compensation on firm performance and this would be looked at
149
below.
150
Kazan (2016) carried out a study aimed at investigating the impact of CEO compensation on
151
firm performance in Scandinavia. The test sample consists of Scandinavian firms that had a spot on
152
the Forbes Global 2000 List of 2016. The impact of CEO compensation on firm performance is tested
153
by using the performance measures of ROE and ROA. The results show a non-significant negative
154
relationship between CEO compensation and firm performance.
155
Lone, Hassan and Afzal (2015) aimed at exploring the reason for high CEO compensation in
156
Pakistan’s Banking Sector. The paper attempted to use panel data of 22 listed banks in Pakistan for
157
the periods 2006-2013 and explores the relationship between CEO compensation and the following
158
variables: firm performance, Firm Size, CEO from the family, Independence of the board of
159
directors, share held by the board, percentage ownership of financial and non-financial institution.
160
Findings from the study suggest that performance does not play any role in CEO compensation.
161
Olalekan and Bodunde (2015) in a study examined the impact of CEO pay on the performance
162
of 11 selected Nigerian quoted banks between 2005 and 2012, using a dynamic Generalized Method
163
of Moments (GMM). The research makes known that the CEO pay exerts significant but negative
164
influence on bank performance in Nigeria. This study, therefore, concludes that rather than being a
165
significant corporate governance mechanism to align the interests of CEO with those of
166
shareholders, the CEO pay of Nigerian quoted banks is indeed part of agency issue in the industry.
167
Shakerin, Natalie and Low (2014) study investigated the relationship between CEO pay and
168
firm performance (return on asset, return on equity and profit margin) of 100 companies from the
169
consumer product sector in Malaysia listed on Bursa Malaysia from 2006 to 2010. Overall, most of
170
the attestations results were found to have a relationship between CEO pay and firm performance.
171
The correlations and regressions among the sub-variables of the firm performance and the CEO pay
172
were found to be consistently positive ranging from weakly positive to the strong positive.
173
7. Theoretical Framework
174
The theoretical framework will look into various theories that have been formulated in the field
175
of CEOs compensation management and its impact on firms’ performance.
176
7.1. Managerialism theory
177
Managerialism theory is a concept that is built on the idea that separation of ownership from control
178
can cause a discrepancy of interest between the management and owners (Tosi et al. 2000). Managers
179
focus on taking advantage of firm size rather than the value of the company. In doing so, they get
180
prestige, power and more pay. This could lead to less or negative returns for the shareholders.
181
7.2. Stakeholder theory
182
The term stakeholder refers to any group or individual who has a legitimate claim on the firm.
183
Each stakeholder of a firm creates value for the company. Since managers are considered to be
184
stakeholders of a firm, the CEO is also included in this consideration. Thus this theory is built on the
185
premise that CEOs are also affected by the outcomes of the firm. That is to say, a positive firm
186
performance will ultimately make the position of the CEO stronger. This will make the probability of
187
a layoff smaller. Thomsen & Conyon (2012) explicates that the view of corporate expenditure of
188
CEO’s change when they buy or receive company’s stock. Thus, setting appropriate incentives for
189
the CEO or changing the compensation structure can provide results.
8. Materials and Methods
193
This study is deemed to be an explorative (literature search) type of research design with a
194
descriptive (panel study) side to it. In other to elicit information to examine the relationship between
195
the variables, the convenience sampling technique, with the combination of both the cross-sectional
196
and time-series data (panel data) were used since they provide greater precision and guard against
197
having an illusory sample. The justification for choosing this design is due to the fact that the
198
combination provides more informative estimates and it’s more efficient.
199
The focus of this article is to examine the influence of CEOs’ compensation on firms'
200
performance in the Nigerian banking industry, for the period, 2010-2014. The data collection
201
approach for the research is quantitative and the study made use of secondary data. These data were
202
formed into a balanced panel (see table 2) sourced from the financial statements of the 10 selected
203
quoted banks (selected based on the availability of the financial statement of the various firms from
204
2010-2014) listed on the Nigeria Stock Exchange as at 31st December 2014.
205
The statistical technique utilized in this research is the Panel Least Squares (PLS) with the aid of
206
EViews 8. Furthermore, Descriptive Statistics is also used to test if the variables are normally
207
distributed. In addition, the study employs correlation mix to investigate if there is multicollinearity
208
among the independent variables.
209
8.1. Model Specification
210
Hypotheses
211
H01: There is no significant relationship between CEO compensation and firm performance in
212
the Nigerian banking industry.
213
H02: There is no significant relationship between firm size and firms’ performance in the
214
Nigerian banking industry.
215
The linear multiple regression model is specified below:
216
The theoretical form: ROAt = F (CEOCt, FSIZEt)
217
The econometric model is given by:
218
Where:
219
B0 = Intercept
220
B1, B2 = Co-efficient
221
ROA = Firm Performance measured as return on asset (Net Income + Interest)/(Average total assets
222
for the fiscal year)
223
FSIZE = Firm Size
224
CEOC = CEO Compensation (Salary + Bonus)
225
μt = The Stochastic Error term
8.2. Data Description
228
Table 1: Data used for analysis
229
S/N BANK NAME YEAR ROA FSIZE CEOC
1 ACCESS BANK PLC 2010 0.0243 11.86151 4971000
2011 0.01693 11.97587 5148000 2012 0.02392 12.18062 21704000 2013 0.0184 12.23149 1155000 2014 0.02328 12.29709 9521500
2 FIRST BANK PLC 2010 0.01713 12.29164 10032300
2011 0.02132 12.39156 10543100 2012 -0.00302 11.43293 11053900 2013 0.22651 11.49389 11564700 2014 0.01974 11.45904 12075500
3 GT BANK PLC 2010 0.04261 12.02823 12586300
2011 0.0407 12.18327 13097100 2012 0.0618 12.2096 13607900 2013 0.05275 12.27975 14118700 2014 0.05189 12.32768 14629500
4 UBA PLC 2010 0.0025 12.15613 15140300
2011 -0.02252 12.21892 15651100 2012 0.02396 12.28493 16161900 2013 0.03041 12.34584 16672700 2014 0.01811 12.369 17183500
5 ZENITH BANK PLC 2010 0.024 12.25272 17694300
2011 0.02634 12.33627 18205100 2012 0.03859 12.38683 18715900 2013 0.03269 12.45919 19226700 2014 0.03149 12.53451 19737500
6 FIDELITY BANK PLC 2010 0.01741 11.67944 20248300
2011 0.01111 11.86891 20759100 2012 0.02334 11.96111 21269900 2013 0.00834 12.03391 21780700 2014 0.01307 12.07445 22291500
7 STERLING BANK PLC 2010 0.0142 11.41427 22802300
2011 0.0068 11.70279 23313100 2012 0.01292 11.76359 23823900 2013 0.01315 11.8499 24334700 2014 0.01303 11.91621 24845500
8 WEMA BANK PLC 2010 0.06381 11.3078 25356300
2014 0.00808 11.5827 27399500
9 FCMB PLC 2010 0.02577 11.46758 27910300
2011 -0.06906 11.30487 28421100 2012 0.08226 11.03561 28931900 2013 0.0463 11.11886 29442700 2014 0.04142 11.11915 29953500
10 STANBIC IBTC PLC 2010 0.01878 11.73421 30464300
2011 0.01608 11.57125 30975100 2012 0.01452 10.86038 31485900 2013 0.10896 10.87737 31996700 2014 0.17044 10.87892 32507500 Researcher’s computation sourced from the financial statements of the selected quoted banks listed on the Nigeria Stock
230
Exchange as at 31st December, 2016
231
Table 2: Descriptive Statistics
232
CEOC FSIZE ROA
Mean 1.26E+08 78155289 1.36E+10
Median 18192500 32726454 4.57E+09
Maximum 6.43E+08 4.08E+08 1.60E+11
Minimum 205500.0 418500.0 -1.39E+10
Std. Dev. 1.90E+08 1.12E+08 3.22E+10
Skewness 1.599762 1.886666 3.661175
Kurtosis 4.272874 5.379994 15.89442
Jarque-Bera 29.64292 49.75602 549.7069
Probability 0.000000 0.000000 0.000000
Sum 7.55E+09 4.69E+09 8.14E+11
Sum Sq. Dev. 2.13E+18 7.34E+17 6.10E+22
Observations 50 50 50
Source: Researcher’s Computation Using E-views 8.0 (2017)
233
The mean values of CEO compensation, firm size and return on asset are given by 1.26E+08,
234
78155289 and 1.36E+10. The standard deviation results show that CEO compensation, firm size and
235
return on asset are given by 1.90E+08, 1.12E+08 and 3.22E+10. From the Jarque Bera statistics, all the
236
variables are normally distributed since their p-values are less than 0.05 level of significance.
0 5 10 15 20 25
-4.0e+10 100000. 4.0e+10 8.0e+10 1.2e+11
Series: Standardized Residuals Sample 2010 2014
Observations 50
Mean -1.43e-07
Median -5.94e+09
Maximum 1.23e+11
Minimum -3.76e+10
Std. Dev. 2.87e+10
Skewness 2.645253
Kurtosis 11.34008
Jarque-Bera 243.8660
Probability 0.000000
238
Source: Researcher’s Computation Using E-views 8.0 (2017)
239
The bar chart above shows the normality test of the residuals. It could be seen that the residuals
240
approximate a normal distribution. The Jarque-Bera statistics of 243.8660 with a probability of
241
0.00000 lends credence to this fact hence we conclude that the error term is normally distributed.
242
8.3 Correlation Analysis
243
Table 3: Correlation Matrix
244
Covariance Analysis: Ordinary Date: 03/13/17 Time: 00:47 Sample: 2010 2014
Included observations: 50
Correlation CEOC FSIZE ROA
CEOC 1.000000
FSIZE 0.423651 1.000000
ROA 0.352212 0.140055 1.000000
Source: Researcher’s Computation Using E-views 8.0 (2017)
245
From the correlations analysis, CEO compensation has a strong positive relationship between firm
246
size and return on asset. It is also observed that firm size is positively related to return on asset.
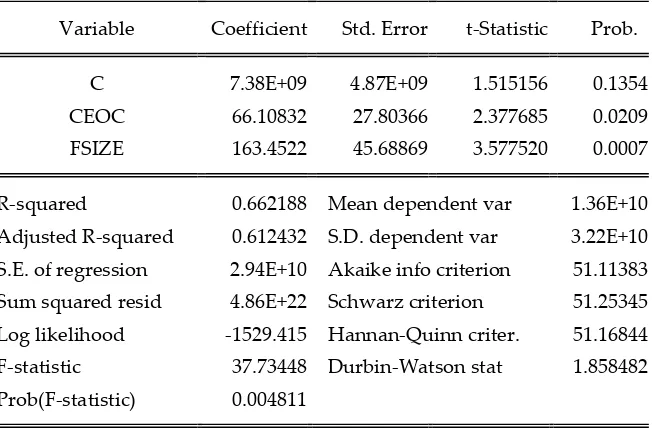
8.4 Presentation of Panel Least Square Result
249
Table 4. Panel Least Square Result
250
Dependent Variable: ROA Method: Panel Least Squares Date: 03/13/17 Time: 00:48 Sample: 2010 2014
Periods included: 5
Cross-sections included: 21
Total panel (unbalanced) observations: 50
Variable Coefficient Std. Error t-Statistic Prob.
C 7.38E+09 4.87E+09 1.515156 0.1354
CEOC 66.10832 27.80366 2.377685 0.0209
FSIZE 163.4522 45.68869 3.577520 0.0007
R-squared 0.662188 Mean dependent var 1.36E+10 Adjusted R-squared 0.612432 S.D. dependent var 3.22E+10 S.E. of regression 2.94E+10 Akaike info criterion 51.11383 Sum squared resid 4.86E+22 Schwarz criterion 51.25345 Log likelihood -1529.415 Hannan-Quinn criter. 51.16844 F-statistic 37.73448 Durbin-Watson stat 1.858482 Prob(F-statistic) 0.004811
Researcher’s Computation Using E-views 8.0 (2017)
251
252
From the table above, we can see a high value of R2 given as 0.662188 signifying that a 66.2%
253
systematic variation in ROA is explained by CEOC and FSIZE. Only 33.8% is left unexplained and
254
this is assumed to be captured by the stochastic error term, U. this shows that the model is a good
255
measure of fit determining the explanatory power of the model.
256
The adjusted R2 is given as 0.612432. This means that after adjusting for the degree of freedom,
257
the adjusted R2 explains approximately 61.2% systematic variation in the dependent variable. The
258
higher the adjusted R2, the lower the residual variance error due to a one-on-one relationship
259
between the both of them and this means our model has a better predictive ability.
260
The F-ratio with the value of 37.73448 shows that the model easily passes the F-test at 5% level
261
of significance and this means that the hypotheses of a significant linear relationship between the
262
dependent and independent variables taken together is validated. It shows that the overall
263
significance of the model is met.
264
The T-statistics using the rule of thumb (which states that when the t-value of the parameter
265
estimate is greater than or equal to 2 then it is statistically significant in explaining the dependent
266
variable but when it is less than 2, then it is not). The t-values show that CEOC and FSIZE which
267
have values of 2.377685 and 3.577520 respectively taken in their absolute form are statistically
268
significant in explaining ROA. This means that the variables are an important determinant in
269
explaining ROA in the selected companies.
The Durbin Watson test for 1st order serial correlation shows the absence of autocorrelation as
271
we have a value of 1.858482.
272
A close observation of the coefficients shows that they are correctly signed based on the
273
theoretical proposition. CEOC and FSIZE are positively related to ROA. The intercept and
274
coefficients are interpreted as follows:
275
• Intercept
276
The intercept of 7.38E+09 means that the model passes through the point 7.38E+09. This
277
indicates that when all the independent variables are zero, then ROA is given by 7.38E+09 units.
278
• CEO Compensation (CEOC)
279
The coefficient of CEO compensation is 66.10832 which have a positive sign. This conforms to
280
the standard theoretical proposition which postulates that CEOC increases ROA in companies. The
281
coefficient of 66.10832 implies that over the study period, on average, a one unit increase in CEOC
282
led to a 66.10832units increase in ROA.
283
• Firm Size (FSIZE)
284
The sign of FSIZE coefficient is positive. This conforms to the theoretical postulation which
285
stressed that FSIZE is positively related to ROA. The coefficient of 163.4522 implies that a one unit
286
increase in FSIZE will on the average lead to an increase in ROA by 163.4522units.
287
8.5 Test of Hypotheses
288
Two hypotheses were raised and are hereby restated below:
289
H01: There is no significant relationship between CEO compensation and firm performance in the
290
Nigerian banking industry.
291
H02: There is no significant relationship between firm size and firms’ performance in the Nigerian
292
banking industry.
293
The t-value can be used to test the hypotheses of the study. The table below summarizes the test
294
and conclude whether they are significant or not;
295
Table 5
296
Variable t-statistic Critical Value using
Rule of thumb
Conclusion
C 1.515156 2 Statistically insignificant
CEOC 2.377685 2 Statistically significant
FSIZE 3.577520 2 Statistically significant
Researcher’s Computation (2017).
297
Findings
298
H01:
299
The first finding indicates a significant relationship between CEO compensation and firms’
300
performance in the Nigerian banking industry with respect to the findings in table 5 using the rule of
301
thumb (which states that when the t-value of the parameter estimate is greater than or equal to 2
302
then it is statistically significant in explaining the dependent variable but when it is less than 2, then
303
it is not). The t-value show that CEOC value of 2.377685 taken in its absolute form is statistically
304
significant. This shows that CEO’s compensation does influence the banking industry performance.
305
Consequently, we reject the null hypothesis and accept the alternate hypothesis, which states that
306
there is a positive significant relationship between CEO compensation and firm performance in the
Nigerian banking industry. Due to its observed statistical significance, it is seen to be consistent with
308
the findings of Carpenter & Sanders (2002), Doucouliagos, Askary and Haman (2008), Barb (2008),
309
Sigler (2011), Ozkan (2007), Ramadan (2013), Ismail, Yabai and Hahn (2014), Shakerin, Natalie and
310
Low (2014).
311
H02:
312
The second finding indicates a statistically significant relationship between firm size and firms’
313
performance in the Nigeria banking industry with respect to the findings in table 5 using the rule of
314
thumb (which states that when the t-value of the parameter estimate is greater than or equal to 2
315
then it is statistically significant in explaining the dependent variable but when it is less than 2, then
316
it is not). The t-value shows that FSIZE which has a value of 3.577520 taken in its absolute form is
317
statistically significant. This shows that firm size does significantly impact on firm performance in
318
the Nigerian banking industry. Consequently, we reject the null hypothesis and accept the alternate
319
hypothesis, that there is a positive significant relationship between firm size and firms’ performance
320
in the Nigerian banking industry and in agreement with the findings of Sigler (2011) and Ozkan
321
(2007).
322
9. Conclusions
323
Larger firms reward their CEOs higher compensation, which one can construe as reflecting
324
their demand for higher quality CEO talent. Firms with larger board size pay their CEOs higher level
325
of total compensation. What's more, size of a firm seems to be the most critical factor in determining
326
the level of total CEO compensation. This study posits that the issue of mixed findings noticed in the
327
literature indicates that the issue of CEO compensation and firm performance is far from resolved
328
empirically. Further, in light of the literature, where cash or equity is used the findings seem to vary.
329
Also, the measure of financial performance appears to also account for the diversity in the findings.
330
Nevertheless, since the focal objective of setting up any business is to make a profit, business
331
organizations usually sort out ways at maximizing profit. This includes cutting down expenses such
332
as cutting down excessive employees' pay (CEOs pay especially) and setting appropriate pay
333
package for its employees.
334
Remuneration can stimulate employees to be more productive as well as increasing the
335
overall employee morale. For this reason, for the efficiency of the workers to be made
336
certain, the concept of remuneration should be treated with utmost thoughtfulness.
337
Therefore, based on the findings, there should be proper compensation review as this will
338
increase the productivity of the executives. Since increased pay is necessary for the efficiency of the
339
workers, it is advised to ensure a considerable pay as this will ensure for efficiency in the
340
organization. There is need to sensitize executives in Nigeria banks on the need to align their
341
payment to performance measures as these measures are directly linked to wealth maximization and
342
firm performance.
343
In addition, policymakers (board of directors) should focus on designing compensation
344
apparatus that concentrate on long-term, rather than short-term incentives (e.g., stock options) that
345
have a capacity to maximize the long-term value of the firm. Since the main objective of setting up
346
any business is to make a profit, business organizations should sort out ways at maximizing profit.
347
This includes cutting down expenses such as cutting down excessive employees' pay (CEOs pay
348
especially) and setting appropriate pay package for employees. Therefore, the board should
349
endeavour to align CEO’s pay with the firm's capacity to pay the amount of compensation the firm
350
can really afford.
351
Conflicts of Interest: The authors declare no conflict of interest.
References
354
Adegoroye S., Oluwafemi M., Akanfe S.K. & Oladipo O.J. 2017. Executive compensation and firm performance:
355
evidence from Nigeria firms. International Journal of Advanced Academic Research | Social & Management
356
Sciences. Vol. 3, Issue 7.
357
Amzaleg Y., Azar O.H., Ben-Zion U., & Rosenfield A. 2014. CEO control, corporate performance and
358
pay-performance sensitivity, Journal of Economic Behavior & Organization, 106(C), 166–174.
359
http://dx.doi.org/10.1016/j.jebo.2014.07.004
360
Bebchuk L. & Fried J. 2003. Executive compensation as an agency problem. Journal of Economic Perspectives, 17(3):
361
71–92.
362
Belliveau M.A. & O'Reilly C. & Wade J. 1996. Social capital at the top: Effects of social similarity and status on
363
CEO compensation. Academy of Management Journal. 39. 1568-1593. 10.2307/257069.
364
Bhagat S., Bolton B., & Subramanian A. 2010. CEO education, CEO turnover, and firm performance. SSRN, 1-46.
365
Brick I.E., Palmon O., & Wald J.K. 2006. CEO compensation, director compensation, and firm performance:
366
Evidence of cronyism? Journal of Corporate Finance, 12(3): 403-423.
367
Finkelstein S., & Boyd B.K. 1998. How much does the CEO matter? The role of managerial discretion in setting
368
of CEO compensation. The Academy of Management Journal 41(2): 179-199
369
Hansen D. & Mowen M. 2005. Management Accounting. 7th Hardcover Edition Binding: Hardcover Publication
370
Jensen M.C. & Murphy K.J. 1990. Performance pay and top management incentives. Journal of Political Economy
371
98, 225–264.
372
John K., Mehran H. & Qian Y. 2010. Outside monitoring and CEO compensation in the banking industry.
373
Journal of Corporate Finance 16, 383-399
374
Johnson B. 1982. Executive compensation, size, profit and cost in the electric utility industry. Unpublished
375
doctoral dissertation. Florida State University.
376
Kabla J.A. 2008. Executive compensation shares and their impact on corporate performance. Evidence from
377
New Zealand. Studies in Economics and Finance, 3(1), 54-92.
378
Kazan E. 2016. The impact of CEO compensation on firm performance in Scandinavia. 8th IBA Bachelor Thesis
379
Conference, the Netherlands.
380
Lone R.R., Hassan F., & Afzal M. 2015. Factors effecting CEO compensation: Evidence from listed banks in
381
Pakistan. Proceedings of 10th Annual London Business Research Conference 10-11 August 2015, Imperial
382
College, London, UK.
383
Mou X. & Wanrapee B. 2015. Factors affecting financial performance of firms listed on Shanghai Stock Exchange
384
50 ( SSE 50. Accessed from
385
http://www.utccmbaonline.com/Journalsys/Upload_Arti/2015-02-02_14:57:09.pdf
386
Ogbeide S. & Akanji B. 2016. Executive Remuneration and the Financial Performance of Quoted Firms: The
387
Nigerian Experience. Management and Economics Review Volume 1, Issue 2
388
Olalekan O.C., & Bodunde O.B. 2015. Effect of CEO pay on bank performance in Nigeria: Evidence from a
389
generalized method of moments. British of Economics, Management and trade, 9(2), 1-12.
390
Olaniyi C.O., Obembe O.B. & Oni E.O. 2017. Analysis of the Nexus between CEO Pay and Performance of
391
Non-Financial Listed Firms in Nigeria. African development review, 29 (3) p. 429-445
392
Olaniyi C. O. & Obembe O. B. 2015. Effect of CEO pay on bank performance in Nigeria: evidence from a
393
generalized method of moments. British Journal of Economics, Management & Trade, Vol.: 9, Issue.: 2
394
Ozkan N. 2007. CEO compensation and firm performance: an empirical investigation of UK Panel Data.
395
European Financial Management, 17(2), 260 – 285.
Shakerin B. I., Natalie V. Y. & Low J. H. 2014. Relationship between CEO pay and firm performance: evidence
397
from Malaysia Listed Firms. IOSR Journal of Economics and Finance (IOSR-JEF) Volume 3, Issue 6, PP 14-31
398
Shin E.D., Lee, J. & Joo I.K. 2009. CEO compensation and US high tech and low-tech firms corporate
399
performance. Contemporary management research, 5(1), 93-106.
400
Sigler K.J. 2011. CEO compensation and company performance. Business and Economics Journal BEJ-31: 1-8.
401
Sun F., Xianging W. & Huang, X. 2013. CEO compensation and firm performance: Evidence from the U.S.
402
property and liability insurance industry. Review of accounting and finance, 12(3), 252-267
403
Thomsen S. & Conyon, M. 2012. Corporate Governance: Mechanisms and Systems. Maidenhead, Berkshire:
404
McGraw-Hill Education
405
Tosi H. L., Werner S., Katz J. P. & Gomez-Mejia L. R. 2000. How much does performance matter? A
406
meta-analysis of CEO pay studies. Journal of Management. 2000; 26(2):301-339.
407
Usman T. 2010. CEO compensation: Relationship with performance and influence of board of directors. Master
408
thesis in Business Administration, Gotland University, Sweden.