Development of a portable assembly-type cosmic-ray muon module for
measuring the density structure of a column of magma
Hiroyuki K. M. Tanaka1, Tomohisa Uchida2, Manobu Tanaka3, Hiroshi Shinohara4, and Hideaki Taira1
1Earthquake Research Institute, the University of Tokyo, 1-1-1 Yayoi, Bunkyo, Tokyo 113-0032, Japan 2Department of Physics, the University of Tokyo, 7-3-1 Hongo, Bunkyo, Tokyo 113-0033, Japan 3Institute of Particle and Nuclear Studies, High Energy Accelerator Research Organization (KEK),
1-1 Oho, Tsukuba, Ibaraki 305-0801, Japan
4National Institute of Advanced industrial Science and Technology (AIST), 1-1-1 Umezono, Tsukuba, Ibaraki 305-8568, Japan
(Received November 28, 2008; Revised May 15, 2009; Accepted June 5, 2009; Online published February 22, 2010)
We have developed a portable assembly type cosmic-ray muon telescope system with power-effective real-time readings to monitor the internal structure of a volcano. Using this system, we have performed measurements at the Satsuma-Iojima volcano and studied the feasibility of using a continuous ux of cosmic-ray muons over the observation period. The system is based on the measurement of time-dependent muon absorption along different, nearly horizontal paths through a solid body. The rationale is that one can deduce the time-dependent changes in the density distribution of muon absorption in the interior of the object where an absorption variation, i.e., a density path variation, becomes an intensity variation since the muon energy spectrum is exponential or, expressed otherwise, it drops rapidly when the energy threshold increases. The muon telescope, which has a surface area of 1 m2, was installed at the observation point located 1.2 km from the summit crater of Satsuma-Iojima. Muon
tracks within scintillator layers in the telescope were analyzed continuously by real-time three-dimensional image processing to measure the level of absorption along different ray paths through the summit crater region. A typical angular resolution of the muon detector of±16 mrad corresponds to a spatial resolution of±20 m at a distance of 1.2 km. Our results show the density structure determined in Satsuma-Iojima volcano, Japan, which is located above sea level. A density structure situated above sea level can be analyzed at a resolution that is signi cantly higher than is possible with conventional geophysical measurements.
Key words: Cosmic ray muon module, density path variation, time-dependent muon absorption, solid body, density structure.
1.
Introduction
The muon is the most numerous of the charged elemen-tary particles at sea level and is capable of traveling large distances. However, they lose energy in proportion to the amount of matter they pass through. Muons are highly penetrating, and a typical horizontally arriving cosmic ray muon with an energy of 1 TeV penetrates 2.4 km of water (Table 1). When primary protons come into contact with the atmosphere, a proton-nucleus interaction takes place, which mainly produces pions, but also kaons. Charged pions and kaons decay into muons within a short time. The amount of energy lost by muons in the atmosphere is considerably small and, consequently, all muons in the vertical direction with energy above a few GeV will reach the Earth’s surface prior to decay. An approximate zenith angular dependence of cosmic-ray muon intensity is proportional to cos2θwhen
the curvature of the earth can be neglected (θ < 70◦). At large zenith angles, low-energy muons decay before reach-ing the Earth’s surface, and high-energy pions decay
be-Copyright cThe Society of Geomagnetism and Earth, Planetary and Space Sci-ences (SGEPSS); The Seismological Society of Japan; The Volcanological Society of Japan; The Geodetic Society of Japan; The Japanese Society for Planetary Sci-ences; TERRAPUB.
doi:10.5047/eps.2009.06.003
fore interaction, thus increasing the average muon energy level. Thus, cosmic-ray muon radiography can be applied to kilometer-sized objects located at elevations vertically above where the detector is placed. Horizontally arriving cosmic-ray muons are the most suitable particles for radio-graphy of a volcano.
Cosmic-ray muons are particles generated in the atmo-sphere that continuously bombard the Earth’s surface from above. They arrive at angles ranging from the vertical to the horizontal (Gaisser and Stanev, 1998), with an inte-gral intensity of 70 m−2 s−1 sr−1 at sea level; only an ex-tremely small number of neutrino-induced muons are di-rected upwards. A high-energy muon can plow through many meters of rock before stopping—the higher the en-ergy, the more rock it can penetrate. Conversely, the more rock, the fewer the muons there will be that have enough energy to get through the rock. For example, a team of physicists and technicians, with oversight from Egyptian archeologists, set up a detection apparatus and associated electronic and computer equipment in the chamber beneath Chephren’s pyramid to measure the direction from which a muon comes into one of the burial chambers in the body of the pyramid (Alvarezet al., 1973). The integral near-horizontal (θ∗ =85◦) intensity of muons is approximately
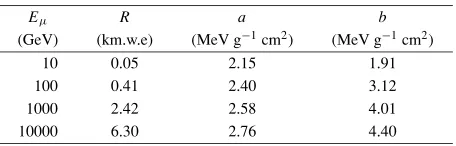
Table 1. Muon rangeRand energy loss parameters calculated for standard rock. Range is given in km-water-equivalent.
Eμ R a b
(GeV) (km.w.e) (MeV g−1cm2) (MeV g−1cm2)
10 0.05 2.15 1.91
100 0.41 2.40 3.12
1000 2.42 2.58 4.01
10000 6.30 2.76 4.40
103and 102m−2sr−1day−1after passing through rock with
a thickness of 2000 and 4000 mwe, respectively. It is there-fore possible to capture time-sequential images of an ac-tive volcano using near horizontal cosmic-ray muons. The volcanic eruption process may result in magma intrusion through a low-density porous conduit and hence be detected via changes in cosmic-ray muon transmission intensity.
Cosmic-ray muon radiography is similar to X-ray radio-graphy, with the exception that penetrating muons serve in place of X-rays. In cosmic-ray muon radiography, a de-tector with a large surface area (m2) is placed at a shal-low depth underground with the aim of imaging a volume that elevated with respect to the detector. The intensity of an image pixel in the detector is determined by the at-tenuation of incident muons caused by absorption in the Earth’s crust. The technique is utterly independent on the geophysical model and directly measures the density length (density×path length). By determining the path lengths from topographic information, the measurement provides the average densityρalong the path lines of cosmic-ray muons through the Earth. This means less rock for muons to penetrate, and more counts from the direction of a low-density region. The energy loss of muons through matter can be calculated by exploiting relations in the Standard Model of muon-initiated interactions, which is sufficiently well known for the purpose of radiography (Andreevet al., 1987; Ambrosioet al., 1995; Banerjeeet al., 2003). The uncertainty due to theory in these calculations is small. By measuring the muon absorption rate, it is possible to detect a small change inρdue to the existence of either less dense or more dense areas inside the volcano. Cosmic-ray muon radiography can be remotely operated. This is a distinct ad-vantage over standard geophysical methods, which must be operated on site, thereby exposing researchers to sometimes difficult or even dangerous (due to volcanic activity) field conditions. The required observation time of the system is inversely proportional to the area of the detector used. For example, the time required for resolving a 3% change in ρin 1 km of rock is 2 months with a 1,000-cm2 detector
at solid angle intervals of 0.01 sr. Several groups have tried to use this method to see inside a pyramid (Alvarezet al., 1970) and beneath volcanoes (Tanakaet al., 2003, 2005, 2007a, b, c, 2008; Tanaka and Yokoyama, 2008).
The internal structure of the Earth’s crust is commonly studied using geophysical observations, such as seismolog-ical, electromagnetic, or geodetic measurements. However, these measurements are rather indirect and have substantial intrinsic uncertainties and, therefore, novel and indepen-dent tools for assessing subsurface structure are necessary
Fig. 1. Reconstructed average density distribution for each muon path line in Mt. Asama. The average density distribution is plotted as a projection on the cross-sectional plane. The distribution of the average density was reconstructed by applying the range-energy relationship for cosmic-ray muons through rock to the path length (L) calculated from the surface shape of the mountain for each arriving angle. The high attenuation region (yellow to red) coincides with the position and shape of the lava mound emplaced in the 2003 crater floor during the 2004 eruption (between white and black dashed lines) with dense lava. A low-density region below (blue) is interpreted as the fall-back of lava in the conduit. The fall-back is consistent with the intermittent collapses of the crater floor that occurred between 22 October 2004 and 11 January 2006. The thickness of the lava mound has been reconstructed from Airborne SAR scanning of the crater floor surface (performed on 11 January 2006).
to reduce these ambiguities. Among the measured prop-erties of the Earth’s interior, density plays a special role because it is most readily interpreted in terms of composi-tion and state. These could represent local-scale geological processes, such as the movements of magma in the conduit of a volcano. Thus, independent measurements of density would be of considerable value.
Fig. 2. The average density distribution is plotted as a projection on the cross-sectional plane that is parallel to the detector plane and which includes the 1944 Usu lava dome peak. The distribution of the average density was reconstructed by applying the flux-depth relationship for cosmic-ray muons through rock (Fig. 1) to the path length (L) calculated from the surface shape of the mountain for each horizontal and vertical arriving angle. The right axis is in units of meters corresponding to the elevation of the dome peak.
lower density below the pre-2004 eruption original crater (Fig. 1). One possible physical process that would create such a low-density region below the crater floor is fall-back of fragmented materials into the vent and upper conduit. This fall-back mechanism yields results consistent with the intermittent collapses of the crater floor that occurred be-tween 22 October 2004 and 11 January 2006 (Urabeet al., 2006). After the eruption had ended, the crater floor began to collapse, presumably reflecting the fall-back. Our inter-pretation of the low-density region is that the fall-back pro-cess created the porous magma supply path below the crater floor. Theρalong the muon path through this region is about 6% lower than that through the surrounding area at the same depth (Fig. 1). Assuming this porous region is lo-calized in the vent area, it is explained by a conduit diameter of 150±60 m (where the error corresponds to the horizon-tal resolution of the image, which is limited to the statistics available here) with a bulk density of 0.8±0.2 g/cm3. This
value corresponds to a porosity of 25–45%, inferring a very high permeability. These results indicate that the internal structure inside the erupting crater and vent can be imaged so that it can be inferred whether the vent is plugged with lava or drained to the deeper parts.
To determine whether this method would produce con-trasting results when applied to other non-Vulcanian vol-canoes, Tanaka et al. (2007c, 2008) and Tanaka and Yokoyama (2008) performed cosmic-ray muon radiogra-phy in the 1944 Usu lava dome that extrudes as a parasitic cone of Usu, Hokkaido, Japan. They reconstructed the sub-surface crustal density structure (Fig. 2) by comparing the transmission image with the local topographic structure, us-ing data on the integrated flux of muons at various zenith angles that penetrated through a given thickness. The radio-graphic image shown in Fig. 2 is essentially a cross section through the dome parallel to the plane of the detector, on which the average density along all the muon paths is pro-jected. The muon radiography revealed that the lava dome is bulbous and that the magma conduit connected to the dome is less than 100 m in diameter at its uppermost part. This result proves that the model of the lava dome forma-tion presented in 2002 based on an analysis of its deforma-tion data is approximately correct. The image is drawn with a vertical spatial resolution of±15 m and a horizontal reso-lution of±15 m. A high-density region can be seen beneath
the dome. This region may be explained by a conduit diam-eter of 100±15 m at an elevation of 145 mrad and by a con-duit diameter of 50±15 m at an elevation of 60 mrad. The measurement confirmed a bulbous shape measuring approx-imately 300 m in diameter and narrowing in the downward vertical direction. The result is consistent with a model pro-posed by Yokoyama (Yokoyama, 2002, 2004). The density structure stands in contrast to that of Asama. This knowl-edge of the subsurface structure of the lava domes is indis-pensable to any discussion of their formation mechanism. Since completion of the 1944 lava dome, geophysical ex-plorations and deformation analyses of the lava dome have been carried out, but without any convincing results.
Cosmic-ray muon radiography using an emulsion cham-ber can image such volcanoes and potentially provide a tool for the diagnosis of eruption. However, the image can be obtained only after the emulsion is developed—at a later time—somewhat like a photographic film. Also, large-area emulsions are difficult to scan. In order to overcome this problem, we have developed a portable assembly type cosmic-ray muon telescope module for the real-time imag-ing of magma movements beneath volcanoes. The results from such studies would be very useful for prediction of upcoming eruptions.
2.
Principle
Radiography based on the propagation of muons utilizes a well-known energy spectrum for muons arriving at dif-ferent zenith angles, a technically well-understood muon detector, and a specific muon propagation model through matter. If the Earth’s structure along the muon path is un-known, the information from counting muon events in the detector at different arriving angles can be used to infer the properties of the matter through which the muons traveled.
Interactions of very high energy cosmic rays with the at-mosphere produce a flux of high-energy cosmic-ray muons, the energy spectrum of which is well known. These muons come mostly from the vertical, following a known zenith angular distribution. However, muons arrive in the horizon-tal direction as well, with a smaller average intensity but a
higher intensity at energies above a few 100 GeV. Because muons become highly penetrative as their energy increases, these horizontal muons can be used for radiographic scan-ning of the shallow crust. An addition advantage of a muon system is that since the muon ux is reasonably high, the detector that is required can be kept to a size that is reason-able for geological applications.
First, the energy spectrum of cosmic-ray muons for dif-ferent zenith angles is obtained from a compilation of ex-perimental data; these data are suf ciently well known for the purpose of radiography. Thompsonet al.(1975) assume that the parents of muons are pions and kaons with produc-tion spectra of the form 1.8×10⁻⁶E−2.7 (nucleons cm−2 s−1sr−1TeV−1). According to a compilation of the
experi-mental data, the differential muon spectrumNμat sea level can be written as follows.
is the survival probability. The ratio of the muon momen-tum to the momenmomen-tum of the parent pionrπ is 0.78, and the parent kaonrKis 0.52.br =0.635 is the branching ratio of
the Kμ2decay mode. In this equation, the density length of
air isL0=1.013 kg/cm2, with corresponding muon energy
lossEμ =2.6 GeV. The survival probability is related to the average decay length Ldecay decay of the muon, which
is given by:
Ldecay=cβγ τ=3·108(m/s)·E(GeV)/mμ·2.2·10−6(s)
=6.2·E(GeV) km, (2)
whereγ = Eμ/mμ is the Lorentz gamma factor, cτ (=
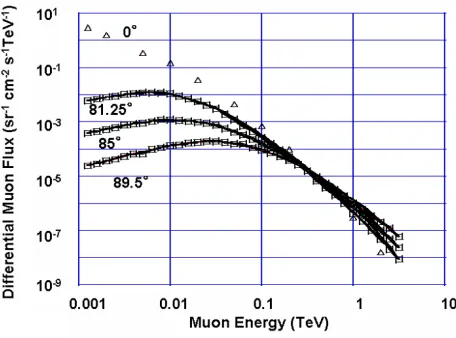
660 m) is the muon decay length, and β = v/c. Equa-tion (1) shows the behavior of the muon ux as a funcEqua-tion of zenith angle and energy. Figure 3 shows the muon en-ergy spectrum for different zenith angles. At large angles, low-energy muons decay before they interact, thus the aver-age muon energy increases. Solid lines show the theoretical curves for large arriving angles.
The manner in which high-energy muons lose their en-ergy when traveling through matter has been studied well and summarized in various articles (e.g. Adair and Kasha, 1976; Groom, 2001). The energy loss of a charged particle of energyEin tera electron volts (TeV) through matter with a density length ofXhectograms per cm2(hg/cm2)1can be written as:
dE/dX =a+bE, (3)
where the rst term represents the ionization loss, and the second term represents various stochastic processes (b =
1A density length of 1 hg/cm2is equivalent to 1 m of water (m.w.e).
bb+bp+bn). At low energies, the energy loss by the
ioniza-tion process is dominant for all charged particles. However, at suf ciently high energies, radiative processes become more important than ionization. The radiative processes are characterized by the stochastic process, which consists of Bremsstrahlung (bb), direct pair production (bp), and
photo-nuclear interaction (bn). All of these interactions are
medi-ated by the electromagnetic eld of the muon. Cross sec-tions for processes that take place through the weak inter-action of the muon with matter are very small and can be neglected. For muons in materials, this critical energy is at an order of several hundred GeV. Table 1 showsaandb
values for standard rock (mass number=22, proton number =11, density=2.65 g/cm3) as a function of muon energy.
The valueahas been numerically evaluated for large values ofEin standard rock (Adair and Kasha, 1976) as:
a=1.888+0.0768GMeV g−1cm2, (4)
whereG =ln(E/Mc2). The ionization loss rate per g/cm2
depends little on the type of the medium. The average energy loss by bremmstrahlung is
bb=1.96[G−0.257]×10−7g−1cm2, (E <2.5 TeV)(5)
bb=1.92×10⁻⁶g−1cm2. (E >2.5 TeV)(6)
When the energy of the muon is considerably high, a com-plete screening process predominates. The mean energy loss of a muon to the direct pair production of electron-positron pairs upon passing through 1 g of material is equal to:
bp =2.40
1−exp−G2/40×10−6g−1cm2. (7)
However, direct electromagnetic interactions are not the only causes of energy loss. The nuclear interactions of the muon through the virtual-photon cloud surrounding the muon may also contribute to energy loss. For muons with energy reaching up to dozens of GeV, the nuclear inter-actions should be accounted for. The cross section for energy-independent photonuclear interactions is approxi-mately given by:
bn=0.45×10⁻⁶g−1cm2. (E >2.5 TeV) (8)
Once the density length (X) along the path is known, the minimum energy (Ec) of the cosmic-ray muons which can
penetrate through this distance is determined using Eq. (3). By integrating fromEcto in nity, we obtain the integrated
muon events Nμ(Ec, θ∗), which represents the number of
muons that have enough energy to escape from the area of interest. Inversely, for a substance with unknownX, a mea-surement of the muon uxNμ(Ec, θ∗)uniquely determines
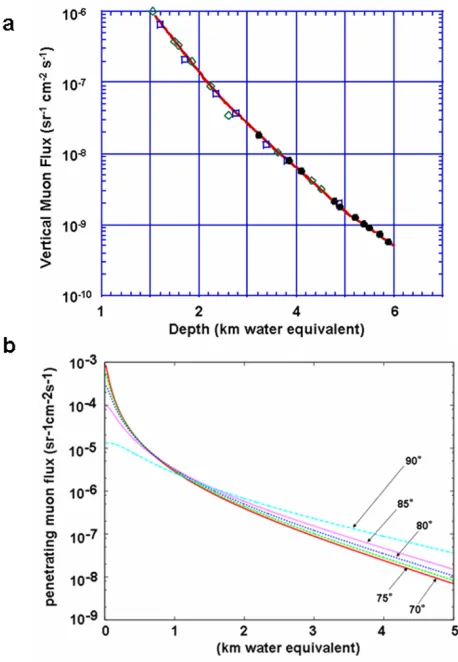
its density length,X. The angular distribution of the muons in the atmosphere and Digital Terrain Map (DTM) are used to construct the average density along the muon path. The precision of the DTM is usually less than 10 m. Figure 4(a) shows the vertical muon intensity versus depth in units of kilometers of water equivalent (km.w.e). Figure 4(b) shows the integrated ux of near-horizontal cosmic-ray muons,
Nμ(Ec, θ∗), at various zenith angles penetrating through a
Fig. 4. (a) Vertical muon intensity versus depth (1 km.w.e. of standard rock). The experimental data are from:: the compilation of Crouch (Crouch, 1987),: Baksan (Andreev, 1987),•: MACRO (Ambrosio
et al., 1995). (b) Integrated flux of near-horizontal cosmic-ray muons at various zenith angles penetrating through a given thickness of rock.
3.
Apparatus
A muon detector requires: (1) the capability to track the arriving angles of cosmic-ray muons; (2) a segmented sys-tem comprising assembly-type modules, which enables any problem in the system to be identified by monitoring each module, so that a stable long time operation is possible; (3) the capability to eliminate soft component background (Tanakaet al., 2001).
One possibility is a combination of photomultiplier tubes (PMTs) and plastic scintillators. These devices can be op-erated under low- and high-temperature conditions. The PMT output consists of a series of electric pulses, with each pulse representing the passage of a muon through the scin-tillator. Such pulses can be converted to logic pulses and then interpreted as trajectories of muons. The experimental arrangement for a real-time volcano monitoring system re-quires that: (1) the particle tracking device must be power effective and light enough to be carried up a mountain and (2) the system can be remotely operated. Standard geophys-ical methods must be operated on site, which can be difficult due to field conditions, or even dangerous due to volcanic activities.
In order to satisfy these two requirements, we have devel-oped a portable assembly-type cosmic-ray muon telescope module. The module consists of a plastic scintillator, an
X1
Y1 Y2 X2
Fig. 5. Portable assembly-type cosmic-ray muon telescope system. The detector matrix counts 12×12 square pixels of 8 cm.
acryl light guide, and a power-effective PMT (Hamamatsu H 7724) in a polycarbonate container. Muons are detected by a brief flash of light as they pass through the plastic scintillator. A PMT which provides high photon sensitivity and fast response is widely used as a photosensitive device. Each scintillator is polished and then wrapped in a layer of reflective Mylar and, after being coupled with a PMT, the whole assembly is covered with a light-shielding sheet. This sheet makes the scintillator opaque to external light, internally reflective, and ready for muon detection. Each single module is 150×8×8 cm3in dimensions and weighs
3.4 kg; 48 such modules are used to assemble the whole telescope. At the observation site, these 48 modules are arranged so as to set up two segmented scintillation detec-tor planes to track muon trails (a portable assembly-type cosmic-ray muon telescope system). The telescope sys-tem consists of crossed segmented scintillator strips (width: 8 cm) pointing in the direction of the volcano and allows for the tracking of muons after as pass through the moun-tain. A straight line connecting the intersecting points of muons at two detector planes (a combination of X1, Y1,
X2, andY2) determines the muon trail (Fig. 5).
“Forward-directed” muon trails can be distinguished from “backward-directed” ones by choosing positive or negative angles, re-spectively, because muons arriving from below are negligi-ble relative to those arriving from above (i.e., the former are about 10−6of the flux of the latter). The intensity of
near-horizontal cosmic-ray muons can be determined from the backward-directed data. Showers and multi-muon events are rejected by discarding events when more than one sig-nal from the same layer (detector plane) coincides in a time gate of 100 ns (multiplicity cut) (Tanakaet al., 2001).
deter-mined by the transition from a logic-0 to a logic-1 level, which is readable by the FPGA. The FPGA chip computes a muon track by identifying two simultaneous (in 200 ns) signals from two different detector planes of the telescope. If the PMT pulses from two detector planes occur within 200 ns, they are deemed to result from a muon passing completely through two detector planes. The gate width of 200 ns is wide enough for a typical muon-traverse time of 6 ns between two detectors but narrow enough for a cosmic-ray muon event rate of∼100 Hz. It is very unlikely that two muon events will occur in the same 200-ns window. The ve-locity of light in the plastic scintillator, which has an index of re ection of approximately 1.5, isv = c/1.5. In addi-tion, the average path that light traverses through the scin-tillator can be up to 50% longer than the straight path, due to re ection off the sides of the scintillator with re ective Mylar. This means that for a 1-m scintillator, it takes about 7.5 ns to travel from one end to the other. As it takes ap-proximately 2 ns to convert light into an electric current in a PMT, the total delay for the event will be approximately 9.5 ns. This delay is acceptable for the requirements of time resolution.
The PMT signals analyzed in the FPGA chip are recorded in a number of bins representing the horizontal and ver-tical arriving angles of cosmic-ray muons (Uchida et al., 2010). The histogram is generated on an internal memory of the FPGA as an HTML (HyperText Markup Language) le. The data according to the address are counted up when an event is detected. These data are read by the network processor when a remote PC accesses the board. The total power (including a power loss of AC- to DC-conversion) required for the muon read-out system is 5 W, thereby sat-isfying Conditions 1 and 2.
Because the size of the detector is negligible relative to the length scales of a volcano, we use a coordinate system in which each point on a plane is determined by an angle and a distance (the distance between the detector and the ob-ject: R). The muon transmission image (muon radiograph) is therefore mapped in the angular coordinate. The angular coordinate (also known as the zenith angle or the azimuth angle and denoted byθ or φ) denotes the positive or an-ticlockwise angle required to reach the point from the 0◦ ray. The minimum resolvable distance (spatial resolution:
X,Y) at an object is de ned by the minimum resolv-able angle of the detector. (angular resolution: θ,φ) and the distance between the object and the detector (R);
(X, Y) = R×(θ, φ). The angular interval (θint)
and the root mean square angular resolution (θres) have the
following relationship (θint−θres)2/θint2 =0.32. Using the
data as a function of vertical (θ) and horizontal (φ) angles with an angular resolution ofθandφ, we can obtain the value of the density length along the muon path as a func-tion ofθ orφ with steps ofθ andφ. The radiograph is effectively a cross section through the volcano parallel to the plane of the detector on which the average density along all the muon paths is projected.
4.
Results and Discussion
A preliminary test measurement with the portable assem-bly type cosmic-ray muon telescope system was performed
on campus without a target object, and the results con rmed the integral muon intensity and its zenith-angular depen-dence (Fig. 6(a)). The whole area of the apparatus is sen-sitive to muons that come from the near-horizontal plane, but the apparatus does not catch all the muons that enter at large angles to the horizontal. As shown in Fig. 6(a), the telescope has a geometrical ef ciency, which the horizontal distribution of muons can be used to correct. We estimated the systematic error of the detection ef ciency for each ar-riving angle from the isotropic horizontal distribution of events (Fig. 6(b)). The horizontal distribution at a certain elevation (θ1) was normalized to the different horizontal
dis-tributions at a different elevations (θ2) (normalized events).
The experimental error bars were derived by tting a linear function to the backward events and reading deviations of the data from the tting function (Fig. 6(c)). The value was about 6%. A root mean square angular resolution of the sys-tem was±16 mrad at an interval of 40 mrad for a distance between two detector planes of 2 m. The difference between the angular resolution and the interval comes from an in-effective region (±5 mm) produced between stacked mod-ules. The effective vertical angle is−320< θ <640 mrad, and the effective azimuth angle is−480< φ <480 mrad.
Mt. Iwodake, the rhyolitic lava dome on Satsuma-Iwojima Island (Fig. 7(a)), is located near the northwest-ern rim of the Kikai caldera (diameter: ∼18 km), which was formed 6300 years ago. Many fumaroles exist in and around the summit. The chemical composition of volcanic gases from the summit crater of Iwodake has been relatively constant since the 1950s (Kamada, 1964). Isotopic analy-ses of the composition of the summit volcanic gaanaly-ses indi-cate that the gases have a magmatic origin (Hedenquistet al., 1994). The degassing of magma requires oversatura-tion of volatiles in a melt; consequently, degassing occurs only under relatively low-pressure conditions. The highest fumarolic temperature of 900◦C also supports the idea that volcanic gases were released from the magma at shallow depths. Based on an analogy with the volatile-poor compo-sition of the magma measured in the Showa-Iwojima vol-cano, it has been estimated that magma degassing occurs in the upper part of Mt. Iwadake (Kazahayaet al., 2002). Thus, it was expected that degassing of a column of magma would be directly observed.
The muon telescope system with a surface area of 1 m2
tele-Fig. 6. (a) Typical angular-dependent muon events collected by the muon telescope. (b) Horizontal angle distribution of the normalized events. (c) Distribution of the deviations of the horizontal muon distribution from the fitting function. Statistic errors can be neglected and the deviations are mainly from other sources.
Fig. 7. (a) Photograph of Satsuma-Iojima. (b) Map of Satsuma-Iojima volcano showing the location of the cosmic-ray muon detector (Mu).
scope. The data were packed into the horizontal and vertical bins, which were±56 and±28 mrad, respectively, by tak-ing a movtak-ing average at an angular interval of 40 mrad. The loss of efficiency at large angles was corrected for. This angular resolution corresponds to the spatial resolution of ±67 mrad in the horizontal direction and±33 mrad in the
vertical direction, with a spatial interval of 48 m at the crater floor.
During the observation period of the study reported here, ∼1.3×10⁶muons sr−1and∼2.0×10⁴muons sr−1were
Fig. 8. Counts of muons obtained in a run of 1 month with the portable assembly-type cosmic-ray muon telescope. The number of events is normalized to an observation time of 10 days. The simulation results by referring to the integrated flux of muons at various zenith angles penetrating through a given thickness are also given for the uniform average density value forρ=1.8, 2.0, 2.2, and 2.4 g cm−3.
from each counter was measured by a storagescope. As the value was a few hundred millivolts, the threshold level for each counter was set to be 60 mrad, which is sufficiently lower than the minimum ionization level. The single count-ing rate from each counter was around 10 per second. Those events are mostly coming from the vertical muons that hit the counter with a cross sectional size of 2×100 cm2. We
quantify the stronger transmission region by comparing the data integrated over all the observation dates (30 days) with the results of the GEANT4 Monte-Carlo simulations for dif-ferent uniform average densities. The lines in Fig. 8 show the expected numbers of counts in the same bins, calculated from the geometry of the Mt. Iwodake, the several differ-ent densities of the rock, the position of the apparatus, the flux of muons from the sky as a function of angle from the
horizontal, and the efficiency of the apparatus as a function of the angle. This calculation assumes there are no density anomalies in the mountain. The experimental error is in-corporated into the statistical uncertainty onN counts as a square root ofN, the standard deviation. The position and the size of the crater in Figs. 8(a–c) are consistent with the GEANT4 Monte-Carlo simulations (solid lines in Fig. 8) (Agostinelliet al., 2003), which give the integrated flux of muons at various zenith angles penetrating through a given density length of rock by referring to the local topographic structure (Tanakaet al., 2007a, b, c).
The stronger muon transmissions come from a longer path length or a higher average density along the path. For
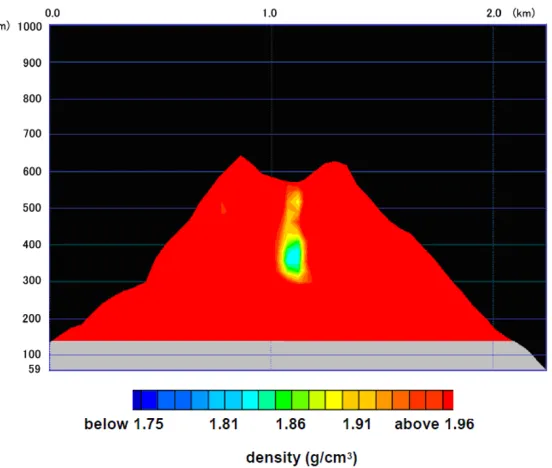
Fig. 9. The average density distribution as a projection on the cross-sectional plane that is parallel to the detector plane and which includes the crater floor of Mt. Iwodake. In order to incorporate the errors in density determination into the image, the density anomalies only below 1.96 g cm−3are
mapped.
decreases in the average density along the muon paths in the absence of rock at the top of the mountain (crater). The ex-perimental data are in agreement with the simulation results for ρ = 2.0 g cm−3. In the region right below the crater
floor (θ =320 mrad) (Fig. 8(b)), we find a small transmis-sion excess from the simulation line forρ = 2.0 g cm−3
atφ∼0.08 rad. From the comparison with the simulation results, the average density in this region can be derived to 1.92 g cm−3. The width of this low-density region is
esti-mated to be 30–50 m. Setting the thickness of the rock at 1000 m and the average density at 2.0 g cm−3, and assuming that this region is localized to the vent area, the local density of this region will becomeρ ∼0.4 g cm−3. In the deeper region (θ = 200 mrad) (Fig. 8(c)) that corresponds to a depth of 200 m below the crater floor, the size of the excess in the muon transmission intensity from the simulation line forρ =2.0 g cm−3 becomes larger in the region between
φ=0 and 0.1 rad. Based on this comparison with the sim-ulation results, the average density in this region is derived to be 1.82 g cm−3. The width of this low-density region is
estimated as∼200 m. Setting the thickness of the rock at 1550 m and the average density at 2.0 g cm−3 and
assum-ing that this density anomaly is localized to the vent area, we obtain a local density of this region ofρ∼0.9 g cm−3.
However, in the region located further deeper in the conduit (θ=80 mrad) (Fig. 8(d)), which corresponds to a depth of 280 m below the crater floor, the amount of muon transmis-sion decreases. Since muon radiography only resolves the average density distribution along the muon paths, we must assume a more localized structure along the muon path. On the other hand, it is reasonable to assume that the observed density variations are localized in the crater area because volcanoes are axi-symmetric. We there assumed that the density deviation in Fig. 8(c) is localized in the crater area
and that the density deviation in Fig. 8(d) is from the het-erogeneity of the body of Iwodake.
Figure 9 shows the average density distribution projected on the cross-sectional plane that is parallel to the detec-tor plane and which includes the crater floor. The value of the experimental error (2.5% in determining the density length) was evaluated from the systematic error of the de-tection efficiency for each arriving angle. The error derived by estimating the path length using the topographic map (1/25000) may in some cases be as high as 30 m compared to the actual 1500-m path length, which is a 2.0% error. Therefore, the total density length relative error becomes 3.2%. Figure 8 shows two low-density regions below the crater floor: (a) a region right below the crater floor and (b) a larger region below Region (a). Region (a) may be inter-preted as the low-density fragmented materials in the upper conduit. Below Region (b) is a higher density region that we interpret to be the top of a magma column (Region (c)). The density of this region is close to the surrounding den-sity (2.1–2.2 g cm−3), indicating non-degassed magma with
bubbles.
We can now construct a picture of the amount of muon transmission through Mt. Iwodake in order to interpret our data and arrive at an estimate for the degassing activity in the conduit. Our picture of the various depths is as follows.
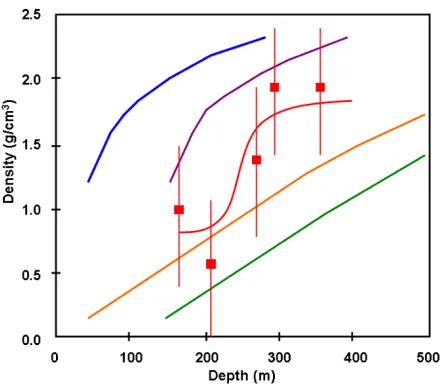
Fig. 10. One-dimensional density modeling in the conduit together with the density distribution as obtained from the muon observation. The red line is drawn through the data points to guide the eye. The orange and blue lines correspond to the densities of ascending and descending magma, respectively, when the magma head is located at a place 280 m below the crater floor. The green and purple lines correspond to the densities of ascending and descending magma, respectively, when the magma head is located at a place 150 m below the crater floor.
floor: this region may consist of ascending extremely low density undegassed magma caused by bubble ex-pansion and coalescence in magma. In this region, the uppermost part of the magma degases efficiently, and the degassed magma descends through the region around the low-density magma, as shown in Fig. 2(d). The diameter of this convection region seems to be ∼200 m.
(3) The region deeper than 300 m below the crater floor: this region may consist of ascending undegassed magma column. The depth of the magma head ob-served 300 m below the crater floor is consistent with the degassing pressure of magma of 0.5–3.0 MPa in Satsuma-Iojima, as estimated by laboratory and theo-retical studies (Kazahayaet al., 2002; Shinoharaet al., 2002).
Based on Fig. 9, we can interpret that there are two cylin-drical low-density regions: (1) the region between the crater floor and a position 150 m below the crater floor, and (2) the region between positions at 150 m and 280 m below the crater floor. These regions can be explained either as (1) a layer filled with pumice rocks or (2) magma that con-tains many bubbles. Because Iwojima is not erupting at the present time it is unlikely that the magma head reaches the crater floor. It is therefore assumed that there are two possi-ble locations of the magma head: (1) 150 m below the crater floor, and (2) 280 m below the crater floor. The condition of the conduit can be modeled by assuming (1) a degassed magma density of 2.4 g cm−3, (2) an initial H
2O density of
1.5 wt%, (3) a pressure gradient of 25 MPa km−1, (4) a
sur-rounding density of 2.0 g cm−3, (5) a conduit diameter of
160 m, (6) magma that holds bubbles when it ascends, and (7) magma descent when the void ratio of magma becomes 50% at 1 MPa. We also consider that the desolution of H2O
into magma when it descends. One-dimensional density modeling in the conduit is shown in Fig. 10 for the different positions of the magma head in the conduit together with the density distribution as obtained from the muon obser-vation. Since the average density in a conduit depends on the ratio of ascending and descending magma, the density deduced by muon radiography must be in between the as-cending and desas-cending curves. The orange and blue lines in Fig. 10 correspond to the densities of ascending and de-scending magma when the magma head is located at a place 280 m below the crater floor, respectively. Green and pur-ple lines correspond to the densities of ascending and de-scending magma when the magma head is located at a place 150 m below the crater floor, respectively. If we assume that the magma head is located at a place 150 m below the crater floor, the low-density region, as visualized at the center of the image (blue patch in Fig. 9), can be explained by magma with many bubbles.
5.
Conclusion
The data presented here provide clear evidence that we have imaged the degassing of a column of magma in the volcanic conduit of Satsuma Iojima volcano within 1 week. This technique only resolves the average density distribu-tion along individual muon paths. Therefore, at the end of the day, the user must always make assumptions or interpre-tations about the more localized structure along the muon paths, or he/she must use more than one detector to resolve the three-dimensional density structure. This is why volca-noes make good study targets: they are axi-symmetric, and it is reasonable to assume that the observed density varia-tions are localized in the vent or crater area. The method is limited to depths above sea level and strongly depends on the nature of the local topography (the detector must be placed at a location, in the direction of a topographically prominent feature of interest, and there will only be results for the volume above the detector). However, the measure-ment yields information on anomalies in the density distri-bution, such as from high- or low-density magma.
The measurements provide the perfect data for studying the local density structure in the Earth’s crust at sites which cannot be well resolved because of their strong structural heterogeneity and potential difficulty to be accessed, and which therefore cannot have their structure determined by conventional electromagnetic or seismic techniques. The duration of monitoring in this study was limited to 1 month in order to confirm if the method was applicable for near-future time-dependent measurement with a time interval of about 1 month.
Acknowledgments. Special funding arrangements by S. Okubo, K. Nakatsuka, and associated researchers of the ERI, JSPS (Japanese Society of Promotion of Science) and JST (Japan Sci-ence and Technology Agency) are acknowledged. M. Takeo and T. Koyaguchi of ERI, K. Nagamine of UCR, I. Yokoyama, M.J.A. H. Imabeppu, Y. Yamashina, and S. Steigerwald are also acknowl-edged for their valuable suggestions.
References
Agostinelli, S., J. Allison, K. Amako, J. Apostolakis, H. Araujo, P. Arce, M. Asai, D. Axen, C. O. Allkoferet al., Muon spectra from DEIS up to 7 TeV,Proc. 17th Cosmic Ray Conf. (Paris),10, 321, 1981.
Agostinelli, S.et al., Geant4: A simulation tool kit,Nucl. Inst. Meth. A, 506, 250–303, 2003.
Allkofer, C. O.et al., Muon spectra from DEIS up to 7 TeV,Proc. 17th Cosmic Ray Conf. (Paris),10, 321, 1981.
Alvarez, L. W.et al., Search for hidden chambers in the pyramids,Science, 167, 832–839, 1970.
Ambrosio, M.et al.(MACRO collaboration), Vertical muon intensity mea-sured with MACRO at the Gran Sasso laboratory,Phys. Rev.,D52, 3793–3802, 1995.
Andreev, Yu. M., V. I. Gurentzov, and I. M. Kogai, in Proc. 20th Int. Cosmic Ray Conf. (Moscow),6, 200, 1987.
Banerjee, S., G. Barrand, F. Behner, L. Bellagamba, J. Boudreau, L. Broglia, A. Brunengo, H. Burkhardt, S. Chauvie, J. Chuma, R. Chy-tracek, G. Coopermanet al., Geant4: A simulation tool kit,Nucl. Inst. Methods. A,506, 250–303, 2003.
Crouch, M., inProc. 20th Int. Cosmic Ray Conf. (Moscow),6, 165, 1987. Gaisser, T. K. and T. Stanev, Cosmic rays, review of particle physics,Eur.
Phys. J. C,3, 132–137, 1998.
Groom, D. E., Muon stopping power and range tables 10 MeV–100 TeV,
Atomic Data and Nuclear Data Tables,78, 183–356, 2001.
Hedenquist, J. W., M. Aoki, and H. Shinohara, Flux of volatiles and ore-forming metals from the magmatic-hydrothermal system of Satsuma Iwojima volcano,Geology,22, 585–588, 1994.
Kamada, M., Volcano and geothermy of Iwo-jima, Kagoshima prefecture,
Jinetsu,3, 1–23, 1964 (in Japanese).
Kazahaya, K., H. Shinohara, and G. Saito, Degassing process of Satsuma-Iwojima volcano, Japan: Supply of volatile components from a deep magma chamber,Earth Planets Space,54, 327–335, 2002.
Shinohara, H., K. Kazahaya, G. Saito, N. Matsushima, and Y. Kawan-abe, Degassing activity from Iwodake rhyolitic cone, Satsuma-Iwojima volcano, Japan: Formation of a new degassing vent, 1990-1999,Earth Planets Space,54, 175–185, 2002.
Tanaka, H. K. M. and I. Yokoyama, Muon radiography and defor-mation analysis of the lava dome formed by the 1944 eruption of Usu, Hokkaido—Contact between high-energy physics and volcano physics—,Proc. Jpn. Acad., Ser B,84, 107–116, 2008.
Tanaka, H., K. Nagamine, N. Kawamura, S. N. Nakamura, K. Ishida, and K. Shimomura, Development of the cosmic-ray muon detection system for probing internal-structure of a volcano,Hyperfine Interactions,138, 521–526, 2001.
Tanaka, H., K. Nagamine, N. Kawamura, S. N. Nakamura, K. Ishida, and K. Shimomura, Development of a two-fold segmented detection system for near horizontally cosmic-ray muons to probe the internal structure of a volcano,Nucl. Instr. Methods. A,507, 657–669, 2003.
Tanaka, H. K. M., K. Nagamine, S. N. Nakamura, and K. Ishida, Radio-graphic measurement of the internal structure of Mt. West Iwate with near-horizontal cosmic-ray muons and future developments,Nucl. Instr. Methods. A,555, 164–172, 2005.
Tanaka, H. K. M., T. Nakano, S. Takahashi, J. Yoshida, and K. Niwa, De-velopment of an emulsion imaging system for cosmic-ray muon radiog-raphy to explore the internal structure of a volcano, Mt. Asama,Nuclear Instr. Methods Phys. Res. A,575, 489–497, 2007a.
Tanaka, H. K. M., T. Nakano, S. Takahashi, J. Yoshida, M. Takeo, J. Oikawa, T. Ohminato, Y. Aoki, E. Koyama, H. Tsuji, and K. Niwa, High resolution imaging in the inhomogeneous crust with cosmic-ray muon radiography: The density structure below the volcanic crater oor of Mt. Asama, Japan,Earth Planet. Sci. Lett.,263, 104–113, 2007b. Tanaka, H. K. M., T. Nakano, S. Takahashi, J. Yoshida, H. Ohshima, T.
Maekawa, H. Watanabe, and K. Niwa, Imaging the conduit size of the dome with cosmic-ray muons: The structure beneath Showa-Shinzan Lava Dome, Japan,Geophys. Res. Lett.,34, L22311, 2007c.
Tanaka, H. K. M., T. Nakano, S. Takahashi, J. Yoshida, M. Takeo, J. Oikawa, T. Ohminato, Y. Aoki, E. Koyama, H. Tsuji, H. Ohshima, T. Maekawa, H. Watanabe, and K. Niwa, Radiographic imaging below a volcanic crater oor with cosmic-ray muons,Am. J. Sci.,308, 843–850, 2008.
Thompson, M. G.et al., The production spectra of the parents of vertical cosmic ray muons,J. Phys. G: Nucl. Phys.,1, L48–L50, 1975. Uchida, T., H. K. M. Tanaka, and M. Tanaka, Development of a muon
radiographic imaging electronic board system for a stable solar power operation,Earth Planets Space,62, this issue, 167–172, 2010. Urabe, B., N. Watanabe, and M. Murakami, Topographic change of the
summit crater of Asama volcano during the 2004 eruption derived from Airborne Synthetic Aperture Radar (SAR) measurements,Bull. Geogr. Surv. Inst.,53, 1–6, 2006.
Yokoyama, I., Growth mechanism of the 1944 lava dome of Usu volcano in Hokkaido, Japan,Proc. Jpn. Acad. 78, Ser. B, 6–11, 2002.
Yokoyama, I., Formation processes of the 1909 Tarumai and the 1944 Usu lava domes in Hokkaido, Japan,Ann. Geophys.,47, 1811–1825, 2004.