Volume 2009, Article ID 969164,13pages doi:10.1155/2009/969164
Research Article
Performance and Reliability of DSRC Vehicular Safety
Communication: A Formal Analysis
Xiaomin Ma,
1Xianbo Chen,
2and Hazem H. Refai
21Department of Engineering and Physics, School of Science and Engineering, Oral Roberts University, Tulsa, OK 74171, USA 2School of Electrical and Computer Engineering, College of Engineering, The University of Oklahoma, Norman, OK 73019, USA
Correspondence should be addressed to Xiaomin Ma,[email protected]
Received 31 March 2008; Revised 12 August 2008; Accepted 26 November 2008
Recommended by Onur Altintas
IEEE- and ASTM-adopted dedicated short range communications (DSRC) standard toward 802.11p is a key enabling technology for the next generation of vehicular safety communication. Broadcasting of safety messages is one of the fundamental services in DSRC. There have been numerous publications addressing design and analysis of such broadcast ad hoc system based on the simulations. For the first time, an analytical model is proposed in this paper to evaluate performance and reliability of IEEE 802.11a-based vehicle-to-vehicle (V2V) safety-related broadcast services in DSRC system on highway. The proposed model takes two safety services with different priorities, nonsaturated message arrival, hidden terminal problem, fading transmission channel, transmission range, IEEE 802.11 backoffcounter process, and highly mobile vehicles on highway into account. Based on the solutions to the proposed analytic model, closed-form expressions of channel throughput, transmission delay, and packet reception rates are derived. From the obtained numerical results under various offered traffic and network parameters, new insights and enhancement suggestions are given.
Copyright © 2009 Xiaomin Ma et al. This is an open access article distributed under the Creative Commons Attribution License, which permits unrestricted use, distribution, and reproduction in any medium, provided the original work is properly cited.
1. Introduction
Transportation safety is one of the most important intelligent transportation system (ITS) applications. Active safety appli-cations, that use autonomous vehicle sensors such as radar, lidar, and camera are being developed and deployed in vehi-cles by automakers to address the vehicle accident problem. Communications systems are expected to play a pivotal role in the ITS safety applications. Message communication in the ITS is normally achieved by installing a radio transceiver in each vehicle allowing wireless communications. Vehicle-to-vehicle (V2V) communication is of critical importance to many ITS safety-related services. The DSRC standard with 75 MHz at 5.9 GHz band was projected and licensed to support low-latency wireless data communications among vehicles and from vehicles to roadside units in USA [1–
3]. Essentially, the DSRC radio technology is IEEE 802.11a adjusted for low-overhead operations in the DSRC spectrum. It is being standardized as IEEE 802.11p [2–5].
Safety applications usually demand direct V2V ad hoc communication networks due to highly dynamic topology of the networks and the stringent delay requirements [6].
terminals, channel access priority, message generation inter-val, and high mobility on the road have not been theoretically addressed yet for the analysis of the DSRC safety broadcast communications. As a matter of fact, the exact analysis of such broadcast ad hoc networks with hidden terminal is still an open problem [13].
In this paper, we first introduce and justify an effective solution to the design of the control channel in DSRC with two levels of safety services covering most of the possible safety applications. Then, we construct an analytical model based on Markov chain method in [14] to evaluate perfor-mance and reliability indices such as channel throughput, transmission delay, and packet reception rates of a typical network solution for DSRC-based safety-related communi-cation under highway wireless communicommuni-cation environment. We apply our proposed model to evaluate the impact of message arrival interval, channel access priority scheme, hidden terminal problem, fading transmission channel, and highly mobile vehicles on the performance and reliability. Based on the observations of numerical results under typical DSRC environment, some enhancement schemes are suggested or validated accordingly.
The remainder of this paper is organized as follows.
Section 2briefly reviews the DSRC communication system
and environment, specifies requirements for the safety-related communication, and presents DSRC control channel design to cover most of the possible safety applications.
Section 3demonstrates an analytic model for broadcasting
two levels of safety-related messages using the control channel in the highway scenario. Consequently, closed-form expressions of perclosed-formance and reliability indices are derived. In Section 4, the proposed analytical model is validated by extensive simulations. In terms of the numer-ical results, some important observations and constructive enhancement suggestions are given. This paper is concluded
inSection 5.
2. DSRC System Descriptions and Solution to
Safety Message Broadcast
2.1. DSRC System for Safety Applications. The 5.9 GHz DSRC is a wireless interface expected to support high speed, short-range wireless interface between vehicles, and surface transportation infrastructure, as well as to enable the rapid communication of vehicle data and other content between on board equipment (OBE) and roadside equipment (RSE).
The DSRC spectrum consists of seven ten-megahertz channels that include one control channel and six service channels. Channel 178 is the control channel, which is generally restricted to safety communications only [2, 3]. The DSRC physical layer uses an orthogonal frequency division multiplex (OFDM) modulation scheme to multiplex data. The DSRC physical layer follows exactly the same frame structure, modulation scheme, and training sequences specified by IEEE 802.11a physical layer. However, DSRC applications require reliable communication between OBEs and from OBE to RSUs when vehicles are moving up to 120 miles/hour and having communication ranges up to
1000 meters. According to the updated version of the DSRC standard, the MAC layer of the DSRC adopts 802.11a layer specification with minor modifications. This is a random access scheme for all associated devices in a cluster based on carrier sense multiple access with collision avoidance (CSMA/CA). In the 802.11 MAC protocols, the fundamental mechanism for medium access is the distributed coordina-tion funccoordina-tion (DCF). DCF is meant to support an ad hoc network without the need of any infrastructure element such as an access point, but DCF is not able to provide predictable quality of service (QoS). The development of a robust and efficient MAC protocol will be central to the new generation DSRC devices.
Broadcast procedure of 802.11 MAC follows the basic medium access protocol of DCF except that no positive acknowledgement and retransmission exist. Broadcast of DSRC MAC occurs when a broadcast packet arrives at DSRC MAC layer from the upper layer and the MAC senses the channel status first and stores the status. Next, once an idle period equal to DIFS/EIFS is observed, MAC takes the next operation according to the stored channel status and the current value of its backoff time. If the current value of the backoff counter is not zero, MAC begins the backoff countdown process. If the current value of the backoffcounter is zero and the status of the medium is busy, MAC generates random backofftime and begins the backoff countdown process. If the backoffcounter counts down to zero, MAC begins data packet transmission immediately. During the backoffcountdown process, carrier sense persists. If the medium becomes busy again, MAC goes back to the DIFS/EIFS observation process. During or after a broadcast transmission, MAC does not monitor the success or failure of the transmission. Once transmission completes, MAC simply releases the medium and competes for it when a new packet is ready to be sent.
There are two types of safety-related life messages that will likely be transmitted over the control channel [7,15]: event-driven (or emergency) safety messages and periodic (or routine) safety messages. Event-driven messages will contain information about environment hazards. They will be transmitted when an emergency or a nonsafe situation is detected to make all the vehicles in the area aware or activates an actuator of an active safety system. Event-driven communications happen only occasionally, but must meet a requirement of fast and guaranteed delivery. Routine messages will contain state of vehicles (e.g., position, speed, and direction) and will be broadcasted by all vehicles at a frequency 10–20 times per second.
message, some of the receivers may move out of the transmission range of the sender, resulting in failure of receiving the message. On the other hand, high mobility makes worse Doppler spread on OFDM, which leads to higher packet error rates and consequently lower channel capacity.
V2V communications present scenarios with unfavorable characteristics to deploy wireless communications, for exam-ple, multiple reflecting objects that are able to degrade the strength and quality of the received signal. While there are many factors that can affect the bit error rate (BER) on a multihop communication environment, mobility of nodes is one of the most important factors that can cause packet errors.
The problem of hidden terminals is a critical issue affecting the performance and the reliability of ad hoc networks. Hidden terminals are two terminals that although they are outside the interference range of one another, they share a set of terminals that are within the transmission range of both. Broadcast in IEEE 802.11 does not use virtual carrier sensing and thus only relies on physical carrier sensing to reduce collision [16]. In the case of broadcast communication, the potential hidden terminal area needs to include the receiving range of all the terminals within transmission range of the sender. Thus, the potential hidden terminal area in broadcast can be dramatically larger than that of unicast. In other words, the broadcast fashion of V2V safety communications makes them more sensitive to hidden terminal problems.
2.3. Requirements of Safety-Related Communication. It is possible to design safety systems based on a high speed wireless communication network to improve the safety on the road. For example, chain collisions can be potentially avoided or their severity lessened by reducing the delay between the time of an emergency event and the time at which the vehicles behind are informed about it [17]. A vehicle on a freeway could move at speed as fast as 120 miles per hour. Once an emergency situation occurs, it is critical to let the surrounding vehicles realize the situation as soon as possible. Because the driver reaction time (the duration between when an event is observed and when the driver actually applies the brake) to traffic warning signals can be in the order of 700 milliseconds or longer, the update interval of safety message should be less than 500 milliseconds (we refer to it as lifetime of safety message). Otherwise, the safety system is useless to help the driver deal with the emergency situations. Hence, It is required that the DSRC safety-related V2V communication must provide a service delivering messages within their lifetime with high reliability under high-speed vehicular environment. According to the requirements in [11], the probability of message delivery failure in a vehicular network should be less than 0.01.Table 1summarizes typical parameters for road traffic scenarios associated with safety-related communication. As we see from Table 1, safety messages are usually very short. The message range is the maximum distance at which a message should be received.
Table1: Parameters for road traffic.
Parameter Value
Average vehicle distance 10 m (jammed), 30 m (smooth)
Message generation interval 50–500 ms
Transmission range 10∼1000 m
Lanes in each direction 2∼4
Average velocity 70 km/h∼120 km/h
Packet payload size,P 100∼300 bytes
2.4. Solutions to Broadcasting of Safety Message. To support safety applications in the DSRC system with high reliability and low delay, the basic link-layer behavior and the environ-ment of safety communications in the control channel can be defined as follows [8,9,15].
(1) Vehicle safety communication networks are entirely distributed ad hoc wireless networks.
(2) Two types of the safety messages are broadcasted in the control channel; event-driven safety messages consist of all real-time safety critical information, while routine safety messages consist of the state of vehicles, and some safety-related information with loose delay requirement.
(3) Most of the identified safety applications are based on direct or single-hop broadcast communication among vehicles within the range of one another. (4) Transmission power of each vehicle for safety-related
communication should be strong enough to reach all potentially affected vehicles that need to take actions immediately.
(5) Each safety message is usually very short (100 ∼
300 bytes), and thus usually mapped to a single frame.
(6) A real-time priority scheme similar to IEEE 802.11e is adopted to differentiate two safety services by using different distributed coordination function (DCF) backoffwindow sizes: the higher priority class uses the window [0,W0−1] and the lower priority class uses the window [W0,Wm−1],W0< Wm.
The above framework of direct (or single-hop) safety message broadcast is justified as follows. (1) As an emergency situation takes place, the potentially affected vehicles that need to be alerted immediately must be very close to where the safety message is sent out. So direct message broadcasting would be enough to reach all such vehicles. (2) Some safety-related services that desire multihops of message forwarding (e.g., road caution hazard notification, and post crash notifi-cation) can be transmitted as routine safety message because delay requirement for the services is relatively longer (0.5– 2 seconds). (3) Compared with multihop broadcast, single-hop broadcasting communication has the characteristics of lower delay, higher reliability, and being easier to implement and analyze.
we introduce or suggest several potential mechanisms to enhance the packet reception rates. (1) Increase backoff window sizes to reduce chances of packet collisions; (2) increase carrier sensing range to withstand the effect of hidden terminal; (3) design proper repetitions of the emer-gency packet within the packet lifetime; (4) give the event-driven safety service preemptive priority over the routine safety service so that possible collisions between two types of service will be reduced. Normally, routine safety message transmissions dominate the channel. Once an emergency messaging takes place, routine services stop and emergent message delivery will occupy the channel. In this paper, an enhancement scheme that combines step (3) with (4) is modeled and analyzed and all repetitions are separated by SIFS. The reason is that SIFS is long enough for all receivers to be able to identify individual packet, but is not too long to be mistaken by other vehicles as the end of a transmission.
3. System Model and Performance Analysis
3.1. Assumptions for IEEE 802.11 Broadcast in DSRC. In this paper, we focus on reliability and performance analysis of the DSRC control channel with two levels of safety services. Real world radio networks are influenced by many factors. In our model, we assume that IEEE 802.11 broadcast DCF works under the following scenarios.
(1) We consider a highway environment where vehicles are exponentially distributed and they travel in free-flow conditions. As seen in Figure 1, the vehicular V2V network built along a highway is simplified as a one-dimensional (1D) mobile ad hoc networks which consist of a collection of statistically identical mobile stations randomly located on a line.
(2) Vehicles are placed on the line according to a Poisson point process with network densityβ(in vehicles per meter); for example, the probabilityP(i,l) of finding
ivehicles in length oflis given by
P(i,l)=(βl)
i
e−βl
i! . (1)
(3) All vehicles have the same transmission and receiving range, which is denoted byR. The average number of vehicles in transmission range of a vehicle on the road isNtr=2βR.
(4) Given the tagged vehicle (the vehicle sending mes-sage) placed in origin, all vehicles have the same carrier sensing range lcs which is assumed to vary between the range [R, 2R]. The average number of vehicles in carrier sensing range of the tagged vehicle on the road isNcs=2βlcs.
(5) As shown inFigure 1, when the vehicular V2V net-work considered is simplified as a one-dimensional network, the potential hidden terminal area of the tagged vehicle in broadcast communication drops in the range of [lcs,R+lcs] and [−R−lcs,−lcs] assuming that the carrier sensing range equals the range within
which one node interferers with other node. The average number of the potential hidden vehicles of the tagged vehicle on the road isNph=4βR.
(6) At each vehicle, routine packets and emergency packets have the same average length E[P]; both arrivals are Poisson processes with ratesλrandλe(in packets per second), respectively.
(7) There are two queues in each vehicle. One is for routine messages and the other is for emergency messages. They sense and access the channel inde-pendently. If two services conflict with each other in a vehicle, the emergency packet will be served first. The queue length of packets each vehicle can store at the MAC layer is unlimited. So each vehicle can be modeled as two independent discrete time M/G/1 queues [18]. Two broadcast services share the common control channel.
(8) The relative velocity of vehicles in the network is assumed to be uniformly distributed in the interval [0,vm], where vm is the maximum relative speed. The average relative velocity of two vehicles in the network is assumed to be a constant valuev.
(9) V2V communications present scenarios with unfa-vorable characteristics of channel fading in DSRC. The channel fading is reflected by simply introducing packet error probability pe = 1 −(1−pber)P+LH, wherePis the length of the packet,LH is the length of packet header, and pberis the fixed bit error rate (BER) probability.pbercan be numerically evaluated for a Rician fading channel [19]. When data bits are transmitted over Nakagami-mfading links, pbercan be easily obtained using the closed form expressions given in [20]. Capture effect is not considered in this paper.
(10) With high channel data rates and relatively big back-offwindow sizeW0, the consecutive freeze effect [21] in IEEE 802.11 DCF on the broadcast performance is neglected.
(11) All nodes within one-hop range of the transmitted node are assumed to have synchronized time scale. It has been proven that by extensive simulations, the impact of the asynchronous time scale on the performance is negligible; if the transmitted packet is short, the backoffwindow size is big enough, and the channel data rate is high [22].
Hidden terminal Tagged node Hidden terminal
Figure1: Highway one-dimensional vehicular ad hoc network model.
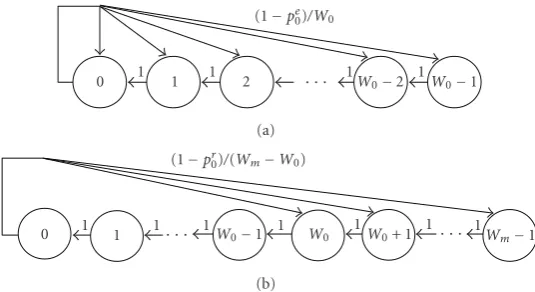
saturated backoffprocess. Based on our solutions to the one-dimensional Markov chain [10,21], we have
τe= (routine) packets ready to be transmitted at the MAC layer in each vehicle, which will be derived later inSection 3.4. In the backoffprocess, if the medium is sensed idle, the backoff timer will decrease by one for every idle slot detected. When detecting an ongoing transmission, the backofftimer will be suspended and deferred a time period ofT,
T=Tb+ DIFS +σ+δ, (3)
whereσis the slot time duration;δis the propagation delay, and DIFS is the time period for a distributed interframe space.Tbis the average time the channel sensed busy by each node in the network
Tb= LH +E[P]
Rd
, (4)
whereRdis system transmission data rate. It is assumed that a packet holds size Pwith average packet length E[P], and packet header includes physical layer header plus MAC layer header LH = PHYhdr + MAChdr. When the enhancement (packet repetition with preemptive priority for event-driven safety message) is applied, the transmission time period is modified as
Tb=LH +E[P]
Rd , (5)
whereE[P]=NrE[P] + (Nr−1)SIFS·Rd, Nris the number of packet repetitions, and SIFS is the time duration of short interframe space.
3.3. Performance of Channel for Tagged Vehicle. We consider a vehicular wireless ad hoc broadcast network with dynamic topology where each vehicle can send out a packet if there is no transmission sensed within the carrier sensing range of the vehicle. So here a channel is defined with respect to any vehicle sending out packet (referred to as the tagged vehicle). Now, we calculate channel performance from the tagged vehicle’s point of view. Definepbas the probability that the channel is sensed busy by the tagged vehicle. Knowing that the channel is busy if there is at least one vehicle transmitting
any type of services in the transmission range of the tagged vehicle, we have transmission from the tagged node is successful. Taking hidden terminal into consideration, we obtain
ps=τ
whereτmay be either τe for emergent transmission or τr for routine transmission;Tvuln=2(P+LH)/Rdis the hidden vulnerable period, pe is packet error probability defined
in Section 3.1, and plb is link breaking probability for a
communication pair, which will be defined and evaluated later in Section 3.5. Note that here “successful” means all nodes within transmission range of the tagged vehicle have received broadcast information from the tagged vehicle. From (7), we can see that the successful transmission takes place under the following conditions: (1) no nodes within transmission range of the tagged vehicle transmit at the time instant when the tagged vehicle starts to transmit; (2) no nodes in the two potential hidden terminal areas
(see Figure 1) transmit during a vulnerable period Tvuln
0 1 1 1 2 · · · 1W0−2 1W0−1
(1−pe0)/W0
(a)
0 1 1 1· · · 1W0−1 1 W0 W0+ 1 · · · Wm−1
1 1 1
(1−pr0)/(Wm−W0)
(b)
Figure2: Markov chain model for backoffprocess in broadcast. (a) Emergency service, (b) routine service.
area, which may cause silence of the other nodes. Since two potential hidden terminal areas inFigure 1are 2Raway from each other, vehicles in one area cannot hear the transmission status of vehicles in the other area. Transmissions in two areas are mutually independent. Each hidden terminal has chances to fail the target vehicle transmission: either by the tagged vehicle starts sending while a hidden terminal is transmitting or by that one hidden terminal starts transmitting while the tagged vehicle is transmitting.
Define pc to be the probability of a collision seen by a packet being transmitted in the medium. It is also the probability that at least one collision takes place in the medium among other vehicles in the interference range of the tagged vehicle under consideration. This yields
pc=1− ∞
i=0
1−τe−τr
i(Ncs)i
i! e −Ncs
×
∞
i=0
1−τe−τr
i(Nph)i
i! e −Nph
(Tvuln/(σ+pbT))
=1−e−(Ncs+(Tvuln/(σ+pbT))Nph)τ.
(8)
3.4. Service Time. The MAC layer service time is the time interval from the time instant when a packet becomes the head of the queue and starts to contend for transmission to the time instant when the packet transmission is over. This time is important when we examine the performance of higher protocol layers. Apparently, the distribution of the MAC layer service time is a discrete probability distribution when the smallest time unit of the backofftimer is a time slotσ. Here, we model the characteristics of each vehicle in the network as two M/G/1 queues and approach service time distributions through probability generating function (PGF). We understand that the backoffcounter in each vehicle will be decremented by a slot once an idle channel is sensed and will wait for a transmission time once a busy channel is sensed. For a tagged vehicle in broadcast communication, the transition for backoffcounter decremented by one can be expressed by the following PGF:
Hd(z)=
1−pb
z+pbzT
/σ
, (9)
where is a function to round floating point numbers to integers. Denote qi as the steady state probability that the packet service time isiσ. LetQ(z) be the PGF ofqi, which is
Q(z)= i
qizi. (10)
Now, it is possible to draw the generalized state tran-sition diagram for both the emergent packet broadcast transmission and routine packet broadcast transmission, as shown inFigure 3. Knowing that successful transmission and transmission with collision take same amount of time in broadcast, we haveSC1(z) = SC2(z) = z(P+LH)/σRd. From
Figure 3, we can derive the transfer functions of the linear
systems or distributions of the emergent service time and routine service time, respectively,
Qe(z)=
i
qeizi=
z(P+TH)/σ
W0 W0−1
i=0
Hdi(z), (11)
Qr(z)=
i
qrizi=
z(P+LH)/σRd
Wm−W0 Wm−1
i=W0
Hdi(z). (12)
Based on (12) and (13), we can obtain the arbitrarynth moment of service time by differentiation. Therefore, the average service times or service rates can be obtained by
Te s ave=
1
μe =
i
qe
i(iσ)=Qe(z)z=1, (13)
Tr s ave=
1
μr =
i
qr
i(iσ)=Qr(z)z=1. (14)
In order to derive the average service time distributions, the probability pe0 (pr0) must be determined, while pe0 (pr0) calculation depends on the duration of service time. In this paper, we apply an iterative algorithm to calculatepe0 (pr0).
The iterative steps are outlined as follows.
0 1 2 · · · W0−2 W0−1
1/W0
Hd(z) Hd(z) Hd(z) Hd(z) SC1(z)
1/W0
Start
End
(a)
0 1 · · · W0−1 W0 W0+ 1 · · · Wm−1 Hd(z) Hd(z) Hd(z) Hd(z) H
d(z) SC2(z)
1/(Wm−W0)
Start
End
(b)
Figure3: Generalized state transition diagram for broadcast. (a) Emergency service, (b) routine service.
Step 2. With pe0(p0r), calculateT andpb according to (3), (4), (5), and (6).
Step 3. Calculate service time distributions through PGF.
Step 4. Calculate service ratesμe=1/Qe(1); μr=1/Qr(1).
Step 5. if (λe+λr)/(μe+μr)≤1, pe0=1−λe/(μe+μr); pr0= 1−λr/(μe+μr), otherwise,pe0=pr0=0.
Step 6. If bothpe0andp0rconverge with the previous values, then stop the algorithm; otherwise, go to Step 2 with the updatedpe
0 (pr0).
3.5. Delay. Packet transmission delay E[D] is the average delay a packet experiences between the time at which the packet is generated and the time at which the packet is successfully received. It includes the medium service time (due to backoff, busy channel waiting, interframe spaces, transmission delay, and propagation delay, etc.), and queuing delay.
For the case of unsaturated condition (λe+λr)/(μe+μr)≤ 1, the expected virtual queuing delay can be obtained by thePollaczek-Khintchine mean value formula[23] for M/G/1 queues
EDe q =
λe(Qe(1) +Qe(1)) 2(1−λe/(μe+μr)),
EDr q =
λr(Qr(1) +Qr(1)) 2(1−λr/(μe+μr)).
(15)
The average packet transmission delays for two services can be calculated as
EDe =EDe
q +Ts avee + DIFS +σ+δ,
EDr =EDr
q +Ts aver + DIFS +σ+δ.
(16)
3.6. Link Breaking Probability. DefineX to be the distance from the position of any vehicle at instant when the tagged
vehicle is requesting channel for packet transmission to the boundary of the tagged vehicle transmission range.
From the assumption that all vehicles in the network are one-dimensional Poisson distributed with densityβ, the PDF ofXof a vehicle is
fX(x)=βe−β|x|, −R≤x≤R. (17)
The time period which a mobile vehicle spends within radio transmission range of the tagged vehicle is defined as the radio dwell timeTdwell, which follows
Tdwell= X
V, (18)
whereV is speed of a vehicle relative to the tagged vehicle, andXandVare assumed to be independent. Consequently, given that the relative velocity of vehicles in the network is uniformly distributed in the interval [0,vm], the PDF of the dwell time can be obtained by
fTdwell(t)=
vm
0 v fV(v)fX(tv)dv
=
vm
0
vβ vme
−βtvdv
= −1 te
−βtvm+ 1
βt2v m
1−e−βtvm.
(19)
Specifically, if the relative velocity is a constantv, we have
fTdwell(t)=β ve−
β vt, ET dwell =
1
β v. (20)
Furthermore, we define the link holding time Tlh as the time period during which a vehicle in the network keeps connected with the tagged vehicle. It is equal to the smaller one between the radio range dwell timeTdwelland the packet transmission timeT. That is
Tlh=min
Since the radio range dwell time and the virtual packet transmission timeT are independent, we can get the PDF of the link holding time by
fTlh(t)=fTdwell(t)
whereFT(t) is the cumulative distribution function (CDF) of the packet transmission timeT, andFTdwell(t) is the CDF of the radio range dwell timeTdwell.
When the tagged vehicle is transmitting, the fact that some of receivers are moving out the tagged vehicle’s transmission range makes the link break. The link breaking probability plb of a communication pair is the probability that the packet transmission time exceeds the radio range dwell time. Thus, we have
plb=Pr
Knowing thatTis a constant, we have
plb=
T
0fTdwell(t)dt=1−e
−β vT. (24)
3.7. Normalized Channel Throughput. DefineS as the nor-malized throughput, defined as the fraction of time the channel is used to successfully transmit payload bits. For DSRC V2V network, we analyze the throughput based on a single vehicle’s standpoint, and then derived to the total network throughput by summing up individual vehicle’s throughput. Also, the computation of nonsaturated through-put and the comthrough-putation of saturated throughthrough-put are carried out separately. Besides, accounting for mobility of vehicles, the throughput decreases since mobile receivers cross the tagged vehicle’s transmission range more often causing the network transmission failure. Thus, we have
S=E[payload information transmitted in a slot time] E[length of a slot time]
=
3.8. Packet Reception Rate. Packet reception rate (PRR) is defined as the ratio of the number of packets successfully received to the number of packets transmitted. SoPRRcan be interpreted as the probability that all vehicles within transmission range of the tagged vehicle receive the broadcast message successfully in a virtual slot.
Impact of Hidden Terminal.We observe that the ratio of receivers affected by the hidden terminals only depends on the position of the hidden node (referred to as hidden crucial node) that has the closest distance to the boundary of the
transmitter’s sensing range among all transmitting nodes in the potential hidden terminal area. DenoteX as a random variable that represents the distance from the hidden crucial node (seeAinFigure 1) to the outer boundary of [0,R+lcs]. Let Rs be the range in the potential hidden terminal area where no node transmits, such that
Rs=
lcs,R+lcs−x . (26)
Then the cumulative distribution function (CDF) forX is [13] (normalized to the time slot) during which the tagged node’s transmission is vulnerable to hidden terminal problem.
Equation (27) gives the probability that the closest interfering node (or hidden crucial node) in the potential hidden terminal area is at least (R+lcs−x) away from the transmitter, that is, the probability that no nodes within
Rstransmit during the transmission from the tagged node. Since all nodes are exponentially distributed on a line, we have of failed nodes in [0,R] due to transmissions of the hidden nodes can be expressed as
NFh=
Therefore, the percentage of receivers that are free from collisions caused by hidden nodes is evaluated as
PRRh=
collisions will take place if any node in the transmission range of the tagged node (i.e., node in [0,R]) transmits in the slot. As shown in Figure 1, any node transmitting in the right-hand side of the tagged node (i.e., node in [0,R]) will result in the failure of all nodes in [0,R] receiving the broadcast packet. So the ratio of successful receiving nodes in the range [0,R] can be expressed as
On the other hand, transmissions of any node in the left-hand side of the tagged node (i.e., node in [−R, 0]) will only result in the failure of partial nodes receiving the broadcast packet in [0,R]. Similar to the analysis of the hidden terminal impact, the ratio of successful receiving nodes due to any transmission in [−R, 0] depends on the position of the closest node transmitting in [−R, 0] to the tagged node. DenoteY
as a random variable that represents the distance from the closest node transmitting in [−R, 0] (seeBinFigure 1) to the outer boundary of range [−R, 0]. LetRt be the range in the left-hand side area where no station transmits such that
Rt=[−R+y, 0]. (32)
It gives the probability that the closest interfering node in [−R, 0] is at least (R−Y) away from the transmitter, that is, the probability that no nodes withinRttransmit in the mean time the tagged node starts to transmit. So we have
P(Y≤y)=
Thus, the expected number of failed nodes in [0,R] due to concurrent transmission of nodes in [−R, 0] can be expressed as
Therefore, the percentage of receivers in [0,R] that are free from collisions caused by concurrent transmissions of nodes in the range [−R, 0] can be evaluated
Packet Reception Rate (PRR).PRRis defined as a percentage of nodes that successfully receives a packet from the tagged node given that all receivers are within transmission the range of the sender at the moment when the packet is sent
Table2: Parameters for communications in DSRC.
Parameter Value
Modulation BPSK, QPSK, 16-QAM, 64-QAM
Coding rates 1/2, 2/3, 3/4
OFDM symbol duration 8μs
Signal bandwidth 10 MHz
Channel data rate 6, 9, 12, 24, 36, 54 Mbit/s
DIFS for 802.11a 64μs
Slot time,σ 16μs
SIFS for 802.11a 32μs
Propagation delay,δ 1μs
Preamble length 40μs
PLCP header length 8μs
CWMin 15
out [8]. From the above definition,PRRcan be interpreted as the percentage of the mobile nodes in the tagged node’s transmission range that receives the broadcasted message successfully in a virtual slot. Taking hidden terminal and possible packet collisions into account, we derivePRRfor a single packet transmission or first packet in multiple packet transmissions as
PRRexpression (37) is divided into five parts (1) all nodes will receive the transmitting packet from the tagged node if no nodes within the transmission range of the tagged node transmit at the time instant when the tagged node starts to transmit; (2) only part of nodes will receive the transmitting packet as there is at least one node in the transmission range of the tagged node transmitting in a virtual slot; (3) some nodes in [−R,R] may fail to receive the broadcast packet if any nodes in the two potential hidden terminal areas (see Figure 1) transmit during the vulnerable period
Tvuln; (4) some nodes in [−R,R] may fail to receive the broadcast packet if any transmission error occurs during the packet transmission; (5) some nodes in [−R,R] may fail to receive the broadcast packet if the nodes move out of the transmission range during the transmission period.
Notice thatPRRis a very important reliability measure, which evaluates how all vehicles within the transmission range of the tagged transmitting vehicle receive the broadcast safety-related message. Since two levels of safety services share a common control channel, their one-hop theoretical
PRRsshould be identical.
PRRefor the suggested repetition protocol is a probability that at least one out ofNr packets is delivered successfully. Since there is no possible current packet collision after the first transmission,PRRsafter the first packet transmission in the proposed enhancement are
0.2 0.4 0.6 0.8 1 1.2 1.4 1.6
Dela
y
(ms)
0 0.02 0.04 0.06 0.08 0.1 0.12 0.14 0.16 0.18 0.2 Density (vehicles/m)
Rd=24 Mbps, emergency, theoretically. Rd=24 Mbps, emergency, simulation. Rd=24 Mbps, routine, theoretically. Rd=24 Mbps, routine, simulation. Rd=54 Mbps, emergency, theoretically. Rd=54 Mbps, emergency, simulation. Rd=54 Mbps, routine, theoretically. Rd=54 Mbps, routine, simulation.
Delay of IEEE 802.11 MAC for DSRC broadcast
Figure4: Packet delivery delay of DSRC broadcast with parameters R =500 miles,W0 = 15, Wm = 63, E[P] = 200 bytes, pber =
10−4, λe=1 pck/s,λr=10 pck/s.
Combining (38) with (37), we derive thePRRfor the sug-gested enhancement as
PRRe=1−
1−PRR1−PRRm
Nr−1
. (39)
4. Model Validation and Numerical Results
In this section, given a specific DSRC environment, per-formance of IEEE 802.11a for DSRC and perper-formance of the proposed enhancement are derived and compared. We consider a two-lane high freeway system where all vehicles are exponentially distributed. Each vehicle moves on the road with average velocity 60 miles per hour in two directions. The average relative speed of two vehicles is 120 miles per hour. Each vehicle on the road is equipped with DSRC wireless ad hoc network capability with communication parameters shown in Table 2. The control channel is exclusively used for safety-related broadcast communication. Transmission range of each vehicle is 500 miles. The impact of hidden terminal, high mobility, message length and message arrival rate, variable date rate, and carrier sensing range in IEEE 802.11a is all embodied in the numerical computations and the simulations.
4.1. Model Validation. In order to validate the proposed analytic model, we write our own event-driven simulation program in MATLAB. Our simulation is conducted under
0 0.01 0.02 0.03 0.04 0.05 0.06
Thr
o
ug
hpu
t
0 0.05 0.1 0.15 0.2
Density (vehicles/m) Rd=24 Mbps, theoretically. Rd=24 Mbps, simulation. Rd=54 Mbps, theoretically. Rd=54 Mbps, simulation.
Throughput of IEEE 802.11 MAC for DSRC broadcast
Figure5: Channel throughput of DSRC broadcast with parameters
W0=15, Wm=63, E[P]=200 bytes,pber=10−4, λe=1 pck/s,
λr=10 pck/s.
0 0.1 0.2 0.3 0.4 0.5 0.6 0.7 0.8 0.9 1
Pa
ck
et
re
ce
p
ti
o
n
ra
te
0 0.05 0.1 0.15 0.2
Density (vehicles/m) Rd=24 Mbps, theoretically. Rd=24 Mbps, simulation. Rd=54 Mbps, theoretically. Rd=54 Mbps, simulation.
PRRof IEEE 802.11 MAC for DSRC broadcast
Figure6: Packet reception rates of DSRC broadcast with
param-etersR = 500 miles, W0 = 15, Wm = 63, E[P] = 200 bytes,
pber=10−4, λe=1 pck/s,λr=10 pck/s.
0.2 0.4 0.6 0.8 1 1.2 1.4 1.6 1.8
Dela
y
(ms)
0 0.02 0.04 0.06 0.08 0.1 0.12 0.14 0.16 0.18 0.2 Density (vehicles/m)
λe=1, emergent λe=1, routine λe=2, emergent λe=2, routine
Delay of IEEE 802.11 MAC for DSRC broadcast
Figure7: Packet delivery delay of DSRC broadcast with parameters R = 500 miles, Rd = 24 Mbps,W0 = 15, Wm = 63, E[P] = 200 bytes,pber=10−4, λr=10 pck/s.
0.5 0.55 0.6 0.65 0.7 0.75 0.8 0.85
Pa
ck
et
re
ce
p
ti
o
n
ra
te
s
0 0.02 0.04 0.06 0.08 0.1 0.12 0.14 0.16 0.18 0.2 Density (vehicles/m)
λe=1,w/hidden,w/omobility λe=2,w/hidden,w/omobility λe=1,w/ohidden,w/omobility λe=1,w/hidden,w/mobility
PRRof IEEE 802.11 MAC for DSRC broadcast
Figure8: Packet reception rates of DSRC broadcast with
parame-tersR =500 miles,Rd =24 Mbps,W0 =15, Wm =63, E[P]= 200 bytes,pber=10−4, λr=10 pck/s.
consecutive freeze effect in IEEE 802.11 DCF, asynchronous time scale, and the hidden terminal problem are naturally reflected in the simulation process. The time resolution of the simulation program is exactly the minimum time unit (1μs) specified in IEEE 802.11 standard. Each simulation round lasts 1200 seconds.
0 50 100 150 200 250 300 350
Dela
y
(ms)
0 0.02 0.04 0.06 0.08 0.1 0.12 0.14 0.16 0.18 0.2 Density (vehicles/m)
λe=1,Nr=1,Ncs=Ntr
λe=1,Nr=1,Ncs=2Ntr
λe=1,Nr=5,Ncs=2Ntr
λe=10,Nr=10,Ncs=2Ntr
Delay of IEEE 802.11 MAC for DSRC broadcast
Figure 9: Delay of DSRC emergent preemptive broadcast with
parametersR = 500 miles,Rd = 24 Mbps,W0 = 256, E[P] =
200 bytes,pber=10−4.
0.4 0.5 0.6 0.7 0.8 0.9 1
Pa
ck
et
re
ce
p
ti
o
n
ra
te
s
0 0.02 0.04 0.06 0.08 0.1 0.12 0.14 0.16 0.18 0.2 Density (vehicles/m)
λe=1,Nr=1,Ncs=Ntr
λe=1,Nr=1,Ncs=2Ntr
λe=1,Nr=5,Ncs=2Ntr
λe=10,Nr=10,Ncs=2Ntr
PRRof IEEE 802.11 MAC for DSRC broadcast
Figure 10: PRRs of DSRC emergent preemptive broadcast with
parametersR = 500 miles,Rd = 24 Mbps,W0 = 256, E[P] =
200 bytes,pber=10−4.
between simulation results and theoretic results when offered traffic is heavy are mainly due to limited road range in the simulation, limited precision of numerical differentiations in the theoretic computations, and possible asynchronous slots among vehicles in the ad hoc network.
Comparing the obtained reliability and performance under typical DSRC environment with requirements set for safety-related ad hoc communication network, we can see that it is no problem for packet delivery delay for emergency safety service (<1.2 milliseconds) to meet the requirement (500 milliseconds); it is even not a problem for routine safety service to reach its 5 hops away destination (2.5 kilometers) within 5×2 milliseconds =10 milliseconds. However, the obtained packet reception rates (<0.8) fail to meet reliability requirement (1 −0.01 = 0.99) for DSRC safety critical messaging.
4.2. Observations and Discussions. From Figure 4–6, it is observed that increasing data rate (from 24 Mbps to 54 Mbps) helps significantly improve the delay. However, increasing data rate reduces the channel throughput under unsaturated channel condition. Data rate changes have minor effect on packet reception rate. As the road traffic is getting heavier (<0.2 vehicles/mile), transmission delays and packet reception rates are getting worse, but channel throughputs are increased accordingly because the channel is still unsaturated.
As seen in Figures4and7, As a result of two-level priority scheme with different backoff window sizes, the packet delivery delays of the event-driven message are much shorter than that of periodic routine message (e.g., inFigure 4, when traffic density is 0.1,E[Dr] > 1 millisecond;E[De] = 0.35 millisecond). FromFigure 7, we also observe that increasing message generation rates in each vehicle prolongs packet delivery time significantly.
Figure 8shows how hidden terminal problem and
mobil-ity of vehicle affectPRRsof the DSRC broadcast communica-tion. We observe that the hidden terminal problem degrades
PRRs significantly. On the other hand, curves without accounting for mobility and that with taking mobility into account are almost overlapped, indicating higher mobility of vehicles does not significantly affect PRRs. Since the ad hoc broadcast network we consider here for safety application adopts short message, high date rate, and one-hop direct message sending, the link breaking probability due to mobility of vehicles is very small during a packet transmission period.
4.3. Impact of Enhancement. Figures 9 and 10 show the impact of enhancement strategies suggested inSection 2on reliability and performance of the DSRC safety message broadcast networks (in Figures 9 and10, the curves with
Nr = 1, Ncs = Ntr reflect, resp., delay and PRR without the enhancement). As observed from Figure 10, the PRRs
for emergency safety messages reach to 0.998 even with high traffic load as the preemptive broadcast with 5 packet repetitions and bigger backoffwindow size (256) is applied, indicating that it is possible to enhance packet reception
rate to a certain level that meets the safety requirement for reliability (PRRs ≥ 0.99) as preemptive priority is given to emergency messages, and some system parameters are carefully chosen.
As shown inFigure 9, although the enhancement brings longer packet delivery delay, the maximum delay introduced (E[D]max = 350 milliseconds) is still much less than the required message lifetime 500 milliseconds. Increasing the number of message repetitionsNrand carrier sensing range (Ncs) helps improve reliability of safety message transmis-sion. But as emergency traffic is getting higher (λe=10 pck/s
inFigure 10), excessive repetitions may make thePRRsworse
instead (see the curve withNr = 10). The reason for the observation is that increasing Nr actually increases time period on which a transmitting vehicle occupies the channel, thus bringing more chances of collisions and interference. It is noticed that optimal selection ofNrdepends on network environment, network parameters, and vehicle traffic on the road.
5. Conclusions
In this paper, we investigate reliability and performance of DSRC ad hoc V2V communication networks with two levels of safety-related services analytically and by simulation. Several important performance indices for broadcast such as channel throughput, packet reception rates, and packet deliv-ery delay are derived from the proposed analytical model taking IEEE 802.11 backoffcounter process, fading channel, hidden terminal, nonsaturation traffic, mobility, and so forth, into account. Numerical results reveal characteristics of the DSRC communication system for safety application. From the analysis of DSRC safety services on highway, we observe that (1) under typical DSRC environment, IEEE 802.11a is able to meet the safety message delay requirement, but is not able to guarantee high reliability because of possible transmission collision and harsh channel fading; (2) hidden terminal problem in broadcast is more severe than that in unicast; (3) high mobility of vehicles has minor impact on the reliability and performance of the direct single hop broadcast network with high data rate; (4) with direct broadcast and preemptive emergent message transmission, it is possible to meet both performance requirement and relia-bility requirement simultaneously through adjusting backoff window size, appropriate number of packet repetitions, and enough range of carrier sensing.
Our future research work will focus on development and analysis of new effective and robust MAC protocols toward 802.11p, which includes adaptively adjusted network parameters in terms of current traffic load and network situation for optimized performance and reliability.
References
[1] J. Zhu and S. Roy, “MAC for dedicated short range communi-cations in intelligent transport system,”IEEE Communications Magazine, vol. 41, no. 12, pp. 60–67, 2003.
[3] “Dedicated Short-Range Communication (DSRC) Working Group,”http://grouper.ieee.org/groups/index.html.
[4] H. Su, X. Zhang, and H.-H. Chen, “Cluster-based DSRC architecture for QoS provisioning over vehicle ad hoc net-works,” in Proceedings of IEEE Global Telecommunications Conference (GLOBECOM ’06), pp. 1–5, San Francisco, Calif, USA, November-December 2006.
[5] ASTM E2213-03, “Standard Specification for Telecommu-nications and Information Exchange Roadside and Vehicle Systems—5 GHz Band Dedicated Short Range Communica-tions (DSRC) Medium Access Control (MAC) and Physical Layer (PHY) Specifications,” Sepember 2003.
[6] J. J. Blum, A. Eskandarian, and L. J. Hoffman, “Challenges of intervehicle ad hoc networks,”IEEE Transactions on Intelligent Transportation Systems, vol. 5, no. 4, pp. 347–351, 2004. [7] Q. Xu, T. Mak, J. Ko, and R. Sengupta,
“Vehicle-to-vehicle safety messaging in DSRC,” inProceedings of the 1st ACM International Workshop on Vehicular Ad Hoc Networks (VANET ’04), pp. 19–28, Philadelphia, Pa, USA, October 2004. [8] M. Torrent-Moreno, D. Jiang, and H. Hartenstein, “Broadcast reception rates and effects of priority access in 802.11-based vehicular ad-hoc networks,” in Proceedings of the 1st ACM International Workshop on Vehicular Ad Hoc Networks (VANET ’04), pp. 10–18, Philadelphia, Pa, USA, October 2004. [9] D. Jiang, V. Taliwal, A. Meier, W. Holfelder, and R. Herrtwich, “Design of 5.9 GHz DSRC-based vehicular safety communica-tion,”IEEE Wireless Communications, vol. 13, no. 5, pp. 36–43, 2006.
[10] T. ElBatt, S. K. Goel, G. Holland, H. Krishnan, and J. Parikh, “Cooperative collision warning using dedicated short range wireless communications,” in Proceedings of the 3rd ACM International Workshop on Vehicular Ad Hoc Networks (VANET ’06), pp. 1–9, Los Angeles, Calif, USA, September 2006.
[11] J. Yin, T. ElBatt, G. Yeung, et al., “Performance evaluation of safety applications over DSRC vehicular ad hoc networks,” in
Proceedings of the 1st ACM International Workshop on Vehicu-lar Ad Hoc Networks (VANET ’04), pp. 1–9, Philadelphia, Pa, USA, October 2004.
[12] P. Gupta and P. R. Kumar, “Critical power for asymptotic connectivity in wireless networks,” in Stochastic Analysis, Control, Optimization and Applications: A Volume in Honor of W. H. Fleming, pp. 547–566, Birkh¨auser, Boston, Mass, USA, 1998.
[13] J.-M. Choi, J. So, and Y.-B. Ko, “Numerical analysis of IEEE 802.11 broadcast scheme in multihop wireless ad hoc networks,” in Proceedings of the International Conference on Information Networking (ICOIN ’05), pp. 1–10, Jeju, Korea, January-February 2005.
[14] X. Ma and X. Chen, “Delay and broadcast reception rates of highway safety applications in vehicular ad hoc networks,” in Proceedings of IEEE Workshop on Mobile Networking for Vehicular Environments (MOVE ’07), pp. 85–90, Anchorage, Alaska, USA, May 2007.
[15] M. Torrent-Moreno, M. Killat, and H. Hartenstein, “The chal-lenges of robust inter-vehicle communications,” inProceedings of the 62nd IEEE Vehicular Technology Conference (VTC ’05), pp. 319–323, Dallas, Tex, USA, September 2005.
[16] ANSI/IEEE Std. 802.11, “Part 11: wireless LAN medium access control (MAC) and physical layer (PHY) specifications,” September 1999.
[17] S. Biswas, R. Tatchikou, and F. Dion, “Vehicle-to-vehicle wireless communication protocols for enhancing highway traffic safety,”IEEE Communications Magazine, vol. 44, no. 1,
pp. 74–82, 2006.
[18] S.-T. Cheng and M. Wu, “Performance evaluation of ad-hoc WLAN by M/G/1 queueing model,” inProceedings of the International Conference on Information Technology: Coding and Computing (ITCC ’05), vol. 2, pp. 681–686, Las Vegas, Nev, USA, April 2005.
[19] G. Farhadi and N. C. Beaulieu, “Connectivity and bit error rate analysis of mobile ad hoc wireless networks,” inProceedings of the 64th IEEE Vehicular Technology Conference (VTC ’06), pp. 2644–2648, Montreal, Canada, September 2006.
[20] M. K. Simon and M. S. Alouini,Digital Communications over Fading Channels: A Unified Approach for Performance Analysis, John Wiley & Sons, New York, NY, USA, 2000.
[21] X. Ma and X. Chen, “Saturation performance of IEEE 802.11 broadcast networks,”IEEE Communications Letters, vol. 11, no. 8, pp. 686–688, 2007.
[22] X. Ma, X. Chen, and H. Refai, “On the broadcast packet reception rates in one-dimensional MANETs,” in Proceed-ings of IEEE Global Telecommunications Conference (GLOBE-COM ’08), pp. 1–5, New Orleans, La, USA, November-December 2008.
[23] K. S. Trivedi,Probability and Statistics with Reliability, Queuing and Computer Science Applications, John Wiley & Sons, New York, NY, USA, 2nd edition, 2002.