QUALITY BY DESIGN APPROACH TO STABILITY-INDICATING REVERSE-PHASE
HIGH-PERFORMANCE LIQUID CHROMATOGRAPHY METHOD DEVELOPMENT,
OPTIMIZATION, AND VALIDATION FOR THE ESTIMATION OF SIMEPREVIR IN BULK DRUG
VANITHA C
1,2, SATYANARAYANA SV
3, BHASKAR REDDY K
4*
1Department of Pharmaceutical Sciences, Jawaharlal Nehru Technological University, Ananthapuramu, Andhra Pradesh, India. 2Department Pharmaceutical Sciences, Sri Venkateswara College of Pharmacy, Chittoor, Andhra Pradesh, India. 3Department of Chemical Engineering, Jawaharlal Nehru Technological University Anantapur, Ananthapuramu, Andhra Pradesh, India. 4Department of
Pharmaceutics, Sri Venkateswara College of Pharmacy, Chittoor, Andhra Pradesh, India. Email: [email protected]
Received: 13 January 2019, Revised and Accepted: 19 March 2019
ABSTRACT
Objective: Asimple, robust, precise, and selective stability-indicating liquid chromatography (LC) method (reverse-phase high-performance LC) was developed for the estimation of simeprevir through quality by design paradigm.
Methods: The chromatographic separation was performed on Water’s 2695(Alliance) equipped with a photodiode array detector at 300 nm. The method was developed on Discovery C18 column (250×4.6, 5 mm) using orthophosphoric acid and acetonitrile (55:45 % v/v) with the flow rate of 1 ml/min at 30°C. The degradation studies of simeprevir were carried out under the stress conditions of hydrolysis (acid, base, and neutral), oxidation, photolytic, and thermal as per the International Conference on Harmonization (ICH) guidelines. The peroxide hydrolysis shows more critical impurities which were well resolved from pure drug with the application of design of experiment and optimized the method.
Results: Independent variables (critical analytical attributes) selected for the method optimization were mobile phase ratio, flow rate, and temperature of the column based on the risk assessment. The retention time and resolution were selected as the method response. In response surface method, the central composite design and 23 factorial designs were employed for the optimization of the method. The polynomial equation was derived for the estimation of method response.
Conclusion: The method was optimized for better resolution among the drug, and impurity peaks were then validated as per the ICH parameters. Keywords: Central composite design, Design of experiments, Method variables, Quality by design and stability-indicating assay.
INTRODUCTION
One of the most crucial steps in the development of pharmaceutical products is to assess the stability of the product. The stability-indicating assay can assess the stability of the product by subjecting the product under stress condition. It is essential to separate, detect, and quantify the pharmaceutical and its degradation products without interference by stability-indicating assay method. The convenient method to achieve the goal of stability-indicating method is reverse-phase (RP) liquid chromatography (LC), but often this method encounters the method failure or method transferability problem. This problem arises due to the lack of understanding of product and process. The success of a LC stability-indicating assay totally depends on its selectivity of the method [1]. To establish a robust, selective stability-indicating method, it requires deeper knowledge on the product and process along with the identification of risk factors. Hence, the quality by design (QbD) paradigm’s principles have been utilized to develop a successful stability-indicating method. The International Conference on Harmonization (ICH) Q8 (R1) guideline defines QbD as “a systematic approach to development that begins with predefined objectives and emphasizes product and process understanding and process control, based on sound science and quality risk management” [2,12,13].
Hepatitis C is a liver disease caused by the hepatitis C virus (HCV); the virus can cause both acute and chronic hepatitis. In recent years, progress in the development of direct-acting antiviral to treat chronic
HCV infection has accelerated enormously, so the number of affected people count was decreased in worldwide. According to the WHO’s Global Hepatitis, report estimates that 71 million people in 2015 were living with HCV, down from an earlier estimate of 130 million to 150 million [3]. Simeprevir is the second-generation NS3/4A protease inhibitors which was used in the treatment of genotype 1 HCV infection (Fig. 1). NS3/4A protease acts on NS3 site for cleaving and generation of new proteins. Simeprevir is competitive, macrocyclic NS3/4A protease inhibitor that inhibits HCV NS3/4A protease’s cleavage of the HCV polyprotein by binding non- covalently and preventing viral replication in infected cells [4,5].
In the literature review, there was one method reported on stability-indicating assay of simeprevir [6] and few bioanalytical methods were developed using LC with tandem mass spectrometry (MS) [7], ultra-performance liquid chromatography-MS [8], and isocratic RP high-performance LC (RP-HPLC) [9]. There was a spectrophotometric method for the estimation of Simeprevir and its oxidative degradation product [10] and one molecular modeling, in-silico toxicity by spectrofluorimetry method on simeprevir [11].
It is a clear evident from the literature, and no method has been developed through QbD approach. The reported stability-indicating method also not focused on any risk assessment and robustness of the method. Hence, there is a need to develop a robust, precise, simple, cost-effective, and selective stability-indicating RP-HPLC method on simeprevir in bulk drug through the QbD approach.
© 2019 The Authors. Published by Innovare Academic Sciences Pvt Ltd. This is an open access article under the CC BY license (http://creativecommons. org/licenses/by/4. 0/) DOI: http://dx.doi.org/10.22159/ajpcr.2019.v12i5.32027
MATERIALS AND METHODS Reagents and chemicals
The active pharmaceutical ingredient was purchased from MSN Pharmaceuticals, Hyderabad. HPLC-grade water was purchased from Rankem, Avantor Performance Materials India Limited. Orthophosphoric acid (OPA) was purchased from RFCL, Rankem Limited, India. High-purity water was prepared using a Millipore Milli Q Plus purification system.
Instrument
LC equipment used for the development was WATERS 2695 equipped with a photodiode array (PDA) detector using Empower 2 software (Waters Corporation, Milford, MA, USA).
Chromatographic conditions
The chromatographic separation was performed on Discovery C18 (250 mm×4.6, 5 µm) at 300 nm. The column temperature was maintained at 30°C. The mobile phase was OPA and acetonitrile (ACN) (55:45) with a flow rate of 1 ml/min.
Preparation of standard solutions
Buffer (0.1% OPA)
Add 1 ml of OPA solution in a 1000 ml of volumetric flask, add about 100 ml of milli-Q water and final volume make up to 1000 ml with milli-Q water.
Standard preparation
Accurately weighed and transferred 25 mg of simeprevir working standards into a 25 ml clean dry volumetric flask, add three-fourth volume of diluents, sonicated for 5 min, and make up to the final volume with diluents.
Standard preparation for linearity
Pipette 0.25, 0.50, 0.75, 1.0, 1.25, and 1.50 ml of above standard stock solution into 10 ml of standard flask and make up to the mark with diluents. The concentration of simeprevir in the prepared solution was 25, 50, 75, 100, 125, and 150 µg/ml.
Standard preparation for degradation
About 1 ml of stock solution of simeprevir was taken separately and treated with acid, base, hydrogen peroxide separately at different Concentrations. After degradation the solution was neutralised and diluted to obtain 100ppm of simeprevir. Later it was injected into LC system.
Design of expert software
The design expert software 11.0.5.0 free trial version was used to plan the experiment’s design.
RESULTS AND DISCUSSION Defining quality target profile
It is a prospective summary of quality characteristics of a drug product taking into account together with the attributes affecting method performance. The major quality characteristic of a drug product which affects the method performances includes dosage form, color, and impurity percentage.
Selection of chromatographic conditions
Simeprevir maximum absorbance wavelength was selected at 300 nm from scanning the range of 200–400 nm using 25 µg/ml of standard solution of the drug. The elution was carried on C8 and C18 column, but the peak shape obtained on Discovery C18 column with good system suitability parameters. The PDA detector was used to detect the simeprevir. The mobile phase used for the detection was OPA and ACN in the ratio of 55:45 at the flow rate of 1 ml/min. The column temperature was maintained at 30°C.
Forced degradation
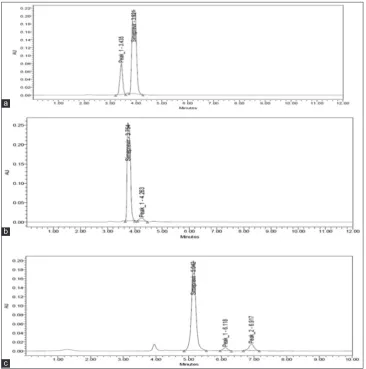
Stress degradation studies of simeprevir were carried out under hydrolysis (acid, base, and neutral), oxidation, and photolytic. The drug was treated with 0.1N HCl for 6 h at 60°C to perform acid degradation, 1 N NaOH for 3 h at 60°C for base degradation, and 20% H2O2 for 3 h at 60°C for peroxide degradation. The standard drug solution was placed in an oven at 105°C for 6 h to study dry heat degradation. Stress testing under neutral conditions was studied by refluxing the drug in water for 72 h at a temperature of 60°C. The chromatograms of forced degradation studies of simeprevir are shown in Fig. 2.
The simeprevir drug was stable under the stress condition of thermal, UV, and water. The drug was treated under acidic and basic condition, and its shows degradation with one degradant peak in each condition. However, in 20% hydrogen peroxide, the peroxide shows two degradant peaks which are more likely to coelute with the drug peak. Results of the percentage of degradations of simeprevir lies within accepted limits and are mentioned in Table 1.
Hence, it is evident that the peroxide condition has a significant effect on the stability of simeprevir drug than any other stress condition. Hence, the emphasis has given the peroxide stress condition to understand method variables on method response. So, design of experiments (DoE) has applied on peroxide stress condition.
Risk assessment
The critical method variables are the parameters which have impact on the quality target profile. “It is a systematic process for the assessment, control, communication, and review of risks to the quality across the product lifecycle.” It is done throughout the life cycle and typically performed. The risk factors for simeprevir method were identified based on the theoretical and practical knowledge and are given in Table 2.
Design of experiment
Based on the risk assessment, the critical analytical attributes were identified % OPA in the mobile phase, the flow rate, and column temperature. The method responses selected were retention time of the drug and resolution between the drug peak and degradation peak 1 which likely coelutes and leads to method failure often. Preferably in response surface method, 23 factorial designs were selected. The selected method responses and its levels are given in Table 3.
The central composite design was selected and 20 chromatogram runs were conducted as per DoE design, and the method responses of each run are mentioned in Table 4.
Statistical analysis of method responses
Analysis of variance (ANOVA) for method response 1 – retention time
and is presented in Table 5. The model shows F value of 36.46 and low probability value which states that the model was significant for
retention time. Values of “Prob > F” <0.0500 indicate that model terms were significant. In this case, A, B and A2 were significant model terms. Values > 0.1000 indicate that the model terms were not significant. The The “ Lack of Fit F-Value of 4.88 implies that there was a 5.34 % chance that it could occur due to noise. Adequate precision 22.230 indicates an adequate signal. This model can be utilized to navigate the design space.
Based on results, the response surface model constructed in this study for predicting retention time was considered reasonable. The final regression model, in terms of their coded factors was given below equation.
RT = +5.26+2.24A−0.29B−0.049C+0.072A×B−5.375e−0.003A×C−0.023B× C+0.74 A2+ 0.091B2+0.053C2
The equation in terms of actual factors can be used to make predictions about the response of retention time and process variables by polynomial equation.
Table 1: Degradation percentage of simeprevir under various stress conditions
Condition % Assay
initial % Assay after degradation % Degradation
Acid 100.00 79.48 20.51
Base 100.00 70.29 29.70
Peroxide 100.00 78.82 21.17
Thermal 100.00 101.99 0.651
UV degradation 100.00 93.37 6.625
Table 2: Critical method parameters
Condition Criticality
HPLC instrument Control
Column Control
Detector Control
API standard Control
Glasswares Control
pH of mobile phase Control
Percentage of OPA in mobile phase Variable X1 Flow rate of Mobile phase Variable X2
Temperature of column Variable X3
HPLC: High-performance liquid chromatography, OPA: Orthophosphoric acid
Table 3: Design of experiments – Levels of variables Name of variables Units Low
level−1 level
Mid level 0 level
High level+1 level
% mobile phase (OPA) % 50.00 55.00 60.00
Flow rate ml/min 0.90 1.00 1.10
Column temperature °C 28 30 32
OPA: Orthophosphoric acid
Fig. 2: Forced degradation chromatograms of simeprevir. (a) Acid degradation: In 0.1 N HCl at 60°C for 6 h, (b) Base degradation: In 1N NaOH at 60°C for 3 h, (c) Peroxide degradation: In 20% hydrogen peroxide at 60°C for 3 h
a
b
RT = +98.83993−2.95197×MP−25.55454×FR−0.67258×TMP+0.14475 MP×FR−5.37500E−004MP×TMP−0.11688FR−TMP+0.029732MP2+ 9.11590FR2+0.013244 TMP2
3D and contour graph for retention time
The 3D surface response and contour plots of the quadratic model were given by the Design–Expert software which provides the interactive relationship of two factors on response by keeping constant of the third factor.
The contour and 3D surface response in Fig. 3 states that the highest retention time reached below 8 min only when maintaining the 60.00% of OPA in mobile phase and 1.10 ml/min flow rate by keeping constant of column temperature at 30°C. Below 51% of OPA at 0.9 ml/min, the retention time of the drug was eluted <4 min which is not recommended.
The flow rate kept constant and interaction of % OPA and column temperature were studied on retention time as shown in Fig. 4. It shows that, at low levels of % OPA and temperature, retention time reduced to below 4 min. At high levels of variables, the retention time achieved at 7.6 min.
The % OPA in the mobile phase kept constant at 55 and interaction of flow rate on column temperature was studied. These two factors show the least effect on retention time of the drug. Changing these two factors from low to high levels which has least effect on retention time of Simeprevir. Hence, these two-term interactions were insignificant in this model.
ANOVA for method response 2 – resolution
The ANOVA of regression parameters of the predicted response surface quadratic model for resolution was obtained from DoE software and is Table 4: Central composite design for screening of method parameters
Std. Run Factor 1
A: Mobile phase Factor 2B: Flow rate Factor 3C: Temperature Response 1Retention time Response 2Resolution
% ml/min °C Time (min) Number
6 1 60 0.9 32 9.103 3.5
13 2 55 1 26.63 5.165 3.9
3 3 50 1.1 28 3.687 4.4
1 4 50 0.9 28 4.516 2.5
14 5 55 1 33.36 4.949 4.5
19 6 55 1 30 5.105 3.9
9 7 46.59 1 30 3.594 4
11 8 55 0.83 30 5.499 4.2
18 9 55 1 30 5.447 4
8 10 60 1.1 32 8.47 1.6
10 11 63.40 1 30 10.425 2
12 12 55 1.16 30 4.831 3.9
4 13 60 1.1 28 8.636 1.6
20 14 55 1 30 5.044 3.5
2 15 60 0.9 28 9.11 3.5
7 16 50 1.1 32 3.608 5.3
15 17 55 1 30 5.042 4
17 18 55 1 30 5.559 3.5
16 19 55 1 30 5.679 4
5 20 50 0.9 32 4.465 2.6
Table 5: ANOVA for quadratic model for method response – retention time
Source Sum of
squares df Mean square F‑value p value
Model 77.43 9 8.60 36.46 <0.0001 Significant
A-MP 68.26 1 68.26 289.23 <0.0001
B-FR 1.12 1 1.12 4.76 0.0541
C-TMP 0.033 1 0.033 0.14 0.7183
AB 0.042 1 0.042 0.18 0.6824
AC 2.311E-004 1 2.311E-004 9.794E-004 0.9757
BC 4.371E-003 1 4.371E-003 0.019 0.8944
A² 7.96 1 7.96 33.74 0.0002
B² 0.12 1 0.12 0.51 0.4925
C² 0.040 1 0.040 0.17 0.6876
Residual 2.36 10 0.24
Lack of
fit 1.96 5 0.39 4.88 0.0534 Not significant
Pure
Error 0.40 5 0.080
Cor Total 79.79 19
ANOVA summary
SD 0.49 PRESS 15.39 Adequate
precision 22.230
R² 0.9704 Adjusted
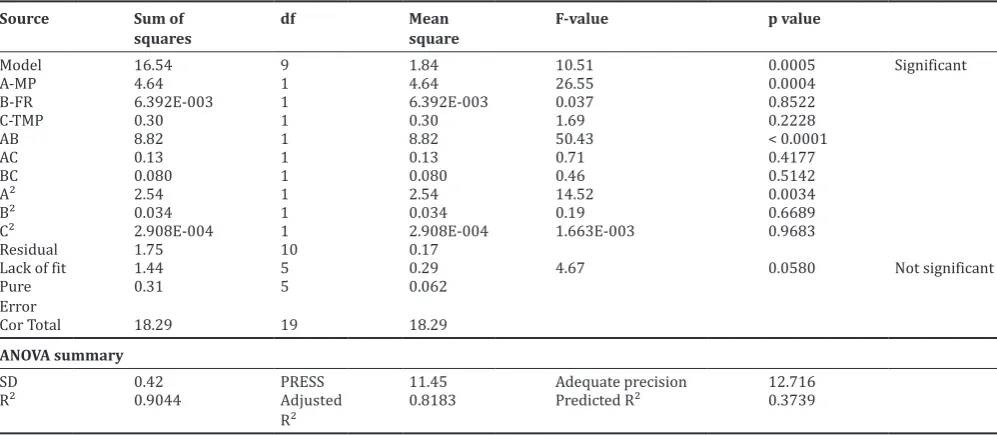
given in Table 6. The Model F-value of 10.51 implies that the model was significant. There is only a 0.05% chance that a “Model F-value” this large could occur due to noise. Values of “Prob > F” <0.0500 indicate that model terms were significant. In this case, A, AB, and A2 were significant model terms. Values >0.1000 indicate that the model terms were not significant. The “Lack of Fit F-Value of 4.67 implies that there was a 5.34 % chance that it could occur due to noise. The “Predicted R-Squared” of 0.3739 was not as close to the “Adjusted R-squared” by 0.8183 as one might normally expect. However, the “adequate precision” ratio of 12.716 indicates an adequate signal, which measures the signal to noise ratio.
Based on results, the response surface model constructed in this study for predicting retention time was considered reasonable. The final regression model, in terms of their coded factors was given below equation.
R2= +3.84−0.58×A+0.022×B+0.15C−1.05A×B-0.13A×C+0.10B×C −0.42A2−0.049×B2+4.492E−003×C2
The equation in terms of actual factors can be used to make predictions about the response of retention time and process variables by polynomial equation.
R2= −167.93273+4.20537×MP+110.42452×FR+0.19367×TMP− 2.10000MP×TMP+0.50000FR×TMP−0.016791MP2−4.85409FR2 +1.12304E-003TMP2
3D and contour graph for retention time
The column temperature was kept constant at 30°C, and the remaining two variables such as % OPA and flow rate interaction effect on resolution are studied from Fig. 5. At higher levels, the % OPA and
flow rate give low resolution (˂2). % OPA ranges lies above 50.00% to
below 57.50% at the flow rate of 1.0 ml/min or lower levels yield good resolution between the peaks.
The flow rate kept constant at 1 ml/min, and then the interaction of %
OPA and column temperature on resolution was studied from Fig. 6 . It
Table 6: ANOVA for quadratic model for method response – resolution
Source Sum of
squares df Mean square F‑value p value
Model 16.54 9 1.84 10.51 0.0005 Significant
A-MP 4.64 1 4.64 26.55 0.0004
B-FR 6.392E-003 1 6.392E-003 0.037 0.8522
C-TMP 0.30 1 0.30 1.69 0.2228
AB 8.82 1 8.82 50.43 < 0.0001
AC 0.13 1 0.13 0.71 0.4177
BC 0.080 1 0.080 0.46 0.5142
A² 2.54 1 2.54 14.52 0.0034
B² 0.034 1 0.034 0.19 0.6689
C² 2.908E-004 1 2.908E-004 1.663E-003 0.9683
Residual 1.75 10 0.17
Lack of fit 1.44 5 0.29 4.67 0.0580 Not significant
Pure
Error 0.31 5 0.062
Cor Total 18.29 19 18.29
ANOVA summary
SD 0.42 PRESS 11.45 Adequate precision 12.716
R² 0.9044 Adjusted
R² 0.8183 Predicted R² 0.3739
Fig. 3: Response surface (a) and contour plots (b) for retention time as a function of orthophosphoric acid % in mobile phase and flow rate, ml/min (contact temperature: 30°C)
a b
Fig. 4: Response surface (a) and contour plots (b) for retention time as a function of orthophosphoric acid % in mobile phase and temperature, °C (constant flow rate, 1.00 ml/min)
shows that if method operated at high levels of % OPA and temperature, the method response resolution achieved < 3.6. But operating the method at low level of OPA %(< 55%) and high level of temperature (>30ºC) can gives rise the resolution more than 4.
The % OPA in mobile phase kept constant at 55, and the interaction of flow rate and column temperature was studied which shows the least effect on resolution. Hence, it is considered as insignificant terms for this proposed model.
Design space
The design space can provide a suitable method performance such as retention time and resolution of the method within the space. The method failure has been detected by a proper understanding of method variable interaction by keeping constant of one variable and studying the two factors interaction on method performance. By careful observation of the contour and 3D diagram, the design space for the method was obtained which can produce acceptable system suitability parameters values as given in Table 7.
Method optimization through DoE software
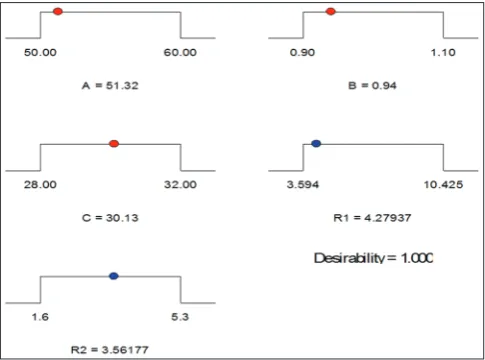
The accuracy of the model was evaluated by numerical optimization method by the Design-Expert software. The desired goals for method response, retention time (3.594–10.425), and Resolution (1.6–5.3) were set as in rage. 30 solutions were suggested, but based on desirability 1.0, the software selected one condition. The experiment run was conducted based on the optimal condition mentioned in Design-Expert. The chromatographic conditions suggested by Design-Expert were % OPA in mobile phase at 51.3%, flow rate at 0.94 ml/min, and column temperature at 30.13°C and predicted method responses by the model were retention time at 4.27 min and resolution at 3.56 as shown in Fig. 7.
The same experimental conditions were maintained and run the HPLC system. The optimized chromatogram of simeprevir with peroxide impurities was obtained as indicated in Fig. 8 and it produced satisfactory system suitability parameters. The method responses of simeprevir in chromatogram had shown almost nearer to predict values.
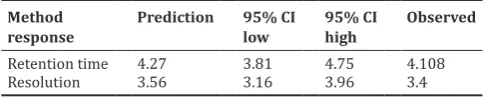
The verification data of predicted values by the model and observed values are given in Table 8.
The correlation between the predicted values and observed values was found to be 1 as given in Fig. 9. Hence,the model successfully can predict the method response within the 95% of the confidence interval of low and high.
The proposed optimized method was validated as per ICH parameters. Validation summary data are provided in Table 9.
DISCUSSION
A novel, selective, robust stability-indicating RP-HPLC method was developed for the estimation of simeprevir in bulk drug by QbD approach. Initial method was developed using OPA and ACN Fig. 7: Optimization and prediction of method responses by model Fig. 5: Response surface (a) and contour plots (b) for the resolution as a function of orthophosphoric acid % in mobile phase and flow
rate, ml/min (contact temperature: 30°C)
a b
Fig. 6: Response surface (a) and contour plots (b) for resolution as a function of orthophosphoric acid % in mobile phase and temperature, °C (constant flow rate of 1.00 ml/min)
(55:45% v/v) with the flow rate of 1 ml/min at 300 nm. The drug was subjected to various stress conditions such as hydrolysis (acid, alkali, and neutral), peroxide, and thermal. Under peroxide stress conditions, the chromatogram shows more number of critical impurity peaks which affect the selectivity of method. To resolve it, the design of experiment was applied. In response surface method, central composite design was used by taking three factors like % OPA, pH, and flow rate as input variables. The retention time and resolution were output variables.
The statistical tools were implemented to know the significant effect of each factor on method responses. The polynomial equation was derived for retention time and resolution. Chromatographic conditions suggested by Design-Expert were OPA % in mobile phase at 51.3%, flow rate at 0.94 ml/min, and column temperature at 30.13 ºC. The model predicted that the retention time of simeprevir was 4.27 and resolution was 3.56. The method was verified by performing the above-mentioned chromatographic conditions. The retention time and resolution obtained in these conditions were 4.108 min and 3.4. With 95 % of confidence interval, the proposed model can predict the response variables. The optimized method was validated as per the ICH Q2 (R1) guidelines.
CONCLUSION
A quadratic model of a central composite design with a high degree of correlation and predicting ability was developed to predict the retention time of simeprevir and resolution between simeprevir and its degradant using OPA % in mobile phase, flow rate, and column temperature as method variables. Interaction among all the variables was investigated by employing RSM. The significant effect was shown by % OPA in mobile phase on both response retention time and resolution. The accuracy of the model was tested by running the chromatographic condition suggested by the model. The forecast values of retention time and resolution by the design were matched with the observed values. The method was optimized and validated as per the ICH guidelines.
ACKNOWLEDGMENT
The Principal author (VANITHA C) thanks Sri Venkateswara College of Pharmacy, RVS Nagar, Chittoor, Andhra Pradesh, for providing research facilities for successful completion of this research work.
Fig. 8: Optimization chromatogram of simeprevir in peroxide degradation
Fig. 9: Correlation graph of predicted values versus observed values
Table 7: Method operable design region
Constant factor Variable range for method response
Y1 Factor A
(% OPA) Factor B(Flow rate ml/min)
Factor C (Temperature °C)
Temperature (30°C) 50–55 0.9–1.0 Constant
Flow rate (1.0 ml/min) 50–55 Constant 28–32 % OPA in mobile
phase (55%) Constant 0.9–1.0 28–32
OPA: Orthophosphoric acid
Table 8: Verification of experiment at optimum conditions Method
response Prediction 95% CI low 95% CIhigh Observed
Retention time 4.27 3.81 4.75 4.108
Resolution 3.56 3.16 3.96 3.4
CI: Confidence interval
Table 9: Validation summary of simeprevir
Parameters Simeprevir
Linearity
Range 25–150 µg/ml
Slope 41,204
Intercept 66,756
LOD (µg/mL) 0.96 µg/ml
LOQ (µg/mL) 2.90 µg/ml
Accuracy (Average recovery %) 101.89
Precision (% RSD)
Intraday precision 0.2
Inter day precision 0.3
Robustness Robust
AUTHORS’ CONTRIBUTIONS
The article was taken from the research work of Vanitha C under the guidance of supervisor Dr. K. Bhaskar Reddy and co-supervisor Prof. S.V. Satyanarayana as a part of her PhD work. All authors have made considerable contributions to the work reported in the manuscript.
CONFLICTS OF INTEREST
The authors declare that they have no conflicts of interest.
REFERENCES
1. Bakshi M, Singh S. Development of validated stability-indicating assay methods-critical review. J Pharm Biomed Anal 2002;28:1011-40. 2. ICH Q8 Quality Guidance: Pharmaceutical Development; 2009. 3. A Report of World Health Organization’s on Hepatitis C virus. Available
from: https://www.who.int/news-room/fact-sheets/detail/hepatitis-c. [Last accessed on 2019 Mar 17].
4. Izquierdo L, Helle F, François C, Castelain S, Duverlie G, Brochot E. Review on Simeprevir for the treatment of Hepatitis C virus infection. Pharmgenomics Pers Med 2014;7:241-9.
5. Kanda T, Nakamoto S, Wu S, Yokosuka O. Review on new treatments for genotype 1 chronic hepatitis C focus on simeprevir. Ther Clin Risk Manag 2014;10:387-7.
6. Attia KA, El-Abasawi NM, El-Olemy A, Serag A. Stability-indicating HPLC-DAD method for the determination of simeprevir. Anal Chem Lett 2017;7:43-8.
7. Vanwelkenhuysen I, De Vries R, Timmerman P, Janssen TV. Determination of simeprevir: A novel, hepatitis C protease inhibitor inhuman plasma by high-performance liquid chromatography tandem mass spectrometry. J Chromatogr B 2014;958:43-4.
8. Ariaudo A, Favata F, De Nicolò A, Simiele M, Paglietti L, Boglione L,
et al. A UHPLC-MS/MS method for the quantification of direct antiviral agents simeprevir, daclatasvir, ledipasvir, sofosbuvir/GS-331007,dasabuvir, ombitasvir and paritaprevir, together with ritonavir, inhuman plasma. J Pharm Biomed Anal 2016;125:369-6.
9. Nannetti G, Pagni S, Parisi SG, Alberti A, Loregian A, Palù G. Development of a simple HPLC-UV method for the determination of the Hepatitis C virus inhibitor simeprevir in human plasma. J Pharm Biomed Anal 2016;121:197-6.
10. Attia KA, El-Abasawi NM, El-Olemy A, Serag A. Different spectrophotometric methods applied for the analysis of simeprevir in the presence of its oxidative degradation product: A comparative study. Spectrochim Acta A Mol Biomol Spectrosc 2018;190:1-9.
11. Attia KA, El-Abasawi NM, El-Olemy A, Serag A. Simeprevir oxidative degradation product: Molecular modeling, in silico toxicity and resolution by synchronous spectro flourimetry. Luminescence 2017;33:1-9. 12. Zope MV, Patel RM, Patel AK, Patel SG. Development and validation
of a stability indicating RP-HPLC method for the determination of potential degradation products of difluprednate in ophthalmic emulsion. Int J Pharm Pharm Sci 2018;10:79-7.