R E S E A R C H
Open Access
The improvement of centralized intelligent
control architecture and data collection
algorithm
Yue-xin Li
*, Zhu Ming and Shen Chunjie
Abstract
The commonly used structure of centralized temperature control systems is the bi-layer structure with upper computer directly controlling thermostats. But this kind of structure has obvious drawbacks, such as high cost, inability to scale up, low degree of intelligence, etc.. This paper presents a design scheme of an intelligent three-tier structure, namely thermostats, intelligent logging devices, and upper computer. The upper computer can read data directly from both thermostats and logging devices. This scheme can solve the problems in bi-layer structure well, and it is also suitable for other types of large-scale control system. However, there still exists data loss problem in this scheme when systems reach a great scale. A method of using historical data in the database and linear feature of temperature curves is also proposed in this paper to improve data collection algorithm, which preferably solve this data loss problem. Appropriate products have been
developed based on the techniques of this scheme, and have been applied in practical industrial production and experimental teaching.
Keywords: Thermostat, Intelligent logging device, Upper computer, Data collection
1 Introduction 1.1 Problem proposition
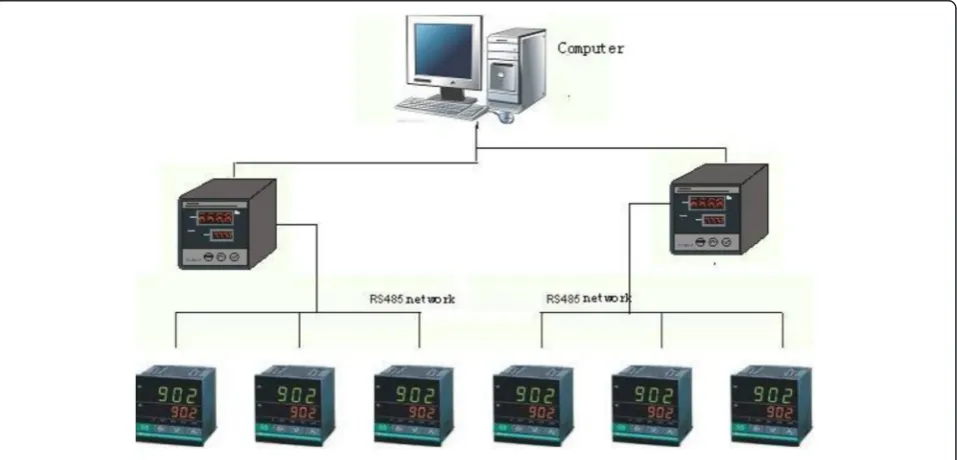
Temperature control systems are widely used in chem-ical, food processing, motor painting [1] and tobacco pro-cessing industries, most of which adopt bi-layer control structure with intelligent and more complex thermostats at the bottom, as shown in Fig. 1.
From the perspective of practical application effects, there are several deficiencies [2] in this control structure: (1) thermostats are required to possess more powerful processing and storage capabilities; (2) upper computer uses sophisticated software and must always be with power on; (3) the number and location of temperature control points are limited; and (4) the price is high but the cost performance is relatively low.
2 Intelligent design scheme
To solve the above problems [3], the author proposes a con-trol system with a three-layer structure, called intelligent
centralized temperature control system. This system can solve the above four problems preferably, whose struc-ture is shown in Fig. 2.
2.1 The system constituting
At the bottom are still the most common portable ther-mostats (also called basal meters), simple hardware com-ponents without CPU used as the control equipment of the proportional-integral-derivative (PID) controller. In-telligent centralized temperature control detectors (or intelligent logging devices for short) are located at the middle layer. Intelligent control system is consisted of MS51 series chips, possessing strong processing and storage capabilities. At the top layer [4] stands the upper-computer system.
2.2 System advantages
Thermostats [5] (basal meters) at the bottom can adopt the simplest design and are not required to have powerful
* Correspondence:[email protected]
Faculty of Computer and Information Engineering, Hubei University, Wuhan 430062, China
processing and storage capabilities, the cost is greatly re-duced. At the same time, RS485 communication inter-face lines is used to improve the transmission distance, the number of temperature control points which can also be flexibly customizable, thus widening geographical scope. The functions such as collecting and storing data can be performed by intelligent centralized temperature control detector, which is a good solution to make up for the deficiency of the bi-layer control structure. The con-trol management function between upper computer and thermostats is also performed by intelligent logging
devices, thus more control functions are extended to services, such as providing queries for historical data, comparing historical data with the current data, statisti-cally analyzing reports in many ways and many direc-tions, monitoring the real-time state of thermostats, intelligently adjusting temperature curves, generating and drawing temperature curves, missing data comple-ment tours [6], etc. Good solution to the bi-layer control struc-ture in the second defect. Intelligent data logging devices using intelligent design will be focused on the next section.
Fig. 1Temperature control systems with bi-layer control structure
3 Intelligent logging devices
Intelligent logging devices [7] play a role in connecting link between the preceding and the following because the basal meters adopt the simplest design with PID control-ler and thermocouple as the core components, and it can concentrate the scattered thermostat together. This can well solve the problems of expanding control scale, reducing the cost [8], keeping upper computer in working state all the time, or allowing it to stay offline, etc.
3.1 Composition
Intelligent logging device is composed of MS51 series CPU chip, RS485 communication interface, 8 K and 32 K RAM. Each intelligent logging devices [9] can connect up to 80 thermostats, an acquisition cycle using RAM approximately 1.2 KB.
3.2 Function
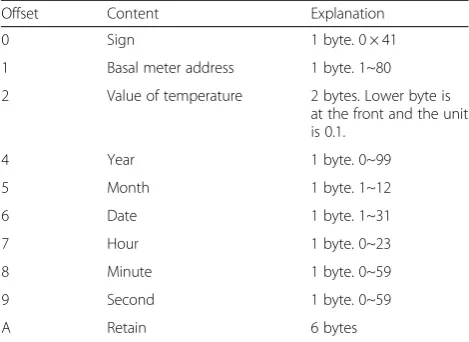
The functions of the intelligent logging devices are to collect, to store and forward thermostat data, to control the action of thermostat, and to receive the order from upper computer [10] (Table 1).
3.3 Intelligent logging devices tested
Test conditions were CPU MS51, RAM 8 M, communi-cation port is with a bit rate of 9800 RS485, and simula-tion of the thermostat is 16 to 80.
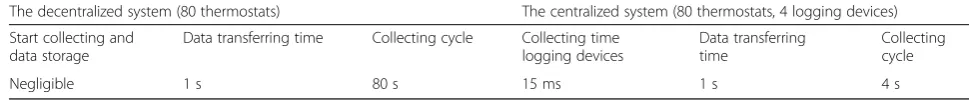
Table 2 shows that the ROM data is essentially the same, the resources needed for the program, RAM use is up to 1.2 K in a collection cycle. Due to 32 KB of RAM, therefore the data can be stored in the case of 30 cycles upper computer offline. An upper computer data acquisition takes 4 s. Assuming moderate precise temperature control system, the acquisition cycle is 2 min, according to the design requirements of this art-icle: to achieve 80 logging devices, each logging devices connected 80 thermostats. Have done a test shown in Table 3. Because the time to transmit a data to upper computer is with a fixed value of 1 s, 80 thermostats need 80 s to upload data logging devices; therefore, each logging devices can only capture 80 thermostats with a 0.5-s time data, that is, for each collecting data logging device, temperature data can only be used 6 ms, but the actual test time is 15 ms. The phenomenon of data loss occurs. In another paper of this issue,“intelligent control system based on centralized upper computer data acqui-sition algorithm” was discussed in detail. To this end, a third experiment was made to find an optimal system design size. Most of the final products are based on the data in Table 4.
Table 5 shows the test data comparison of the non-centralized structure of the system and non-centralized archi-tecture system; at the same time, the data collection and the transmission of data points with the host computer, Table 1Some protocols and commands
Offset Content Explanation
0 Sign 1 byte. 0 × 41
1 Basal meter address 1 byte. 1~80
2 Value of temperature 2 bytes. Lower byte is at the front and the unit is 0.1.
4 Year 1 byte. 0~99
5 Month 1 byte. 1~12
6 Date 1 byte. 1~31
7 Hour 1 byte. 0~23
8 Minute 1 byte. 0~59
9 Second 1 byte. 0~59
A Retain 6 bytes
Table 2Test data
Thermostat
Table 3Test data
Logging
Table 4Test data
the data logging devices acquisition cycle is 300 ms, and the obviously centralized structure of the system acquisi-tion cycle is short, easy for system expansion.
Decentralized architecture with a strong thermostat system control functions are programmable, and having a CPU processing power and storage capacity. Table 6 is the same size of the temperature control system in accordance with the moderately priced under market conditions, the price comparison of the two control schemes.
4 Upper computer software
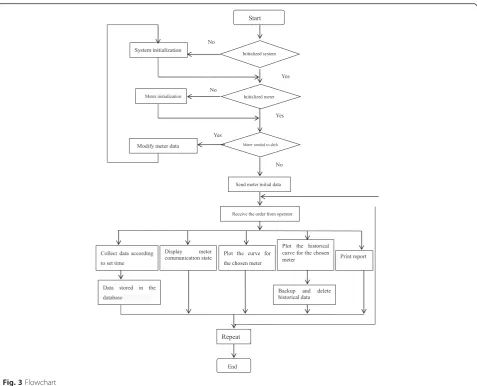
The intelligent logging device is required to be con-nected to upper computer, and its parameters are set through the upper computer programs. The main content of upper computer programs includes the following:
1. System initialization
To set the number of logging devices, the number of basal meters connected to each logging device, and the location of each meter.
2. Initialization of basal meter function
Serial port setting, clock correction, determination of the number and address of basal meters, meter curve setting, intervals (or cycle) of meters collecting data, and intervals (or cycle) of upper computer collecting data from logging devices. 3. Inspection function
To read out or repeatedly read out the current data from the specified basal meter; to clean up the data of logging devices; and to read out data from logging devices in real time.
4. Curve plotting
To plot the current temperature inspection data curve graph of some specified meter or several meters.
5. Historical data inquiry and historical curve plotting
To store the inspection data in database as historical data allowing managerial staff to inquire or draw curves according to requirements.
6. Warning function 7. Report printing
8. Real-time communication between logging device and basal meters (Fig.3)
9. Shift of basal meters
The shift of basal meters refers to the shift of meters from one logging device to another. Thus, system is required to perform shift operation, delete the basal meter information from the original logging device, and add the meter information to the new device.
5 Experiments
After completion of the study design of the entire system, two laboratories, Wuhan University of Textile Industry and Wuhan University of Light Industry, both use the system for more than 2 years. They be-lieve that the basic design requirements met their needs. Figure 4 shows centralized three-tier structure of the temperature control system. Figure 5 shows interface screenshots of the major upper software during field trials.
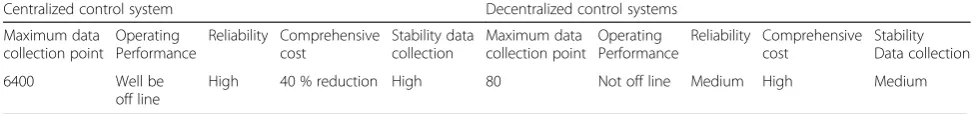
6 Contrast
Using a centralized control system whose system per-formance, scalability, and cost price is significantly better than the non-centralized. The comparison between the specific descriptions is shown in Table 7.
7 Data collection algorithm improve
The intelligent centralized temperature control system hardware structure is shown in Fig. 2.
The topmost is called upper computer which is the heart of the system and where all the inputs and outputs are performed. At the middle layer are the logging Table 5Test data comparison
The decentralized system (80 thermostats) The centralized system (80 thermostats, 4 logging devices)
Start collecting and data storage
Data transferring time Collecting cycle Collecting time logging devices
Table 6Price comparison (US dollar)
The decentralized system The centralized system
80 thermostats 2 switches 1 upper computer 80 thermostats 4 logging devices 1 upper computer
Price Subtotal Price Subtotal Price Subtotal Price Subtotal Price Subtotal Price Subtotal
0.14 11.2 0.3 0.6 0.6 0.6 0.1 8 0.22 0.88 0.6 0.6
devices which can distribute temperature curves, collect data from basal meters, and control meters. There can be at most 80 logging devices connected at this layer. At the bottom are the basal meters (or thermostat) which perform such functions as raising temperature, reducing temperature, keeping constant temperature, communi-cating with logging device and warning, etc. For each logging device, there can be at most 80 thermostats con-nected at this layer.
The merits of this structure are as follows:
(1)The scale of the system can be expanded flexibly (2)Upper computer can be shut and then the
real-time data of basal meters can be stored in the logging devices
(3)The design complexity of basal meters can be greatly simplified, reducing the system costs considerably
In theory, the value of temperature control points con-nected to intelligent centralized temperature control
Fig. 3Flowchart
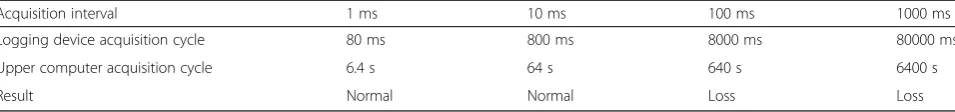
system is 80 × 80, which means the upper bound of log-ging devices in the system is 80 and that of thermostats is also 80; thus, the upper limit of the number of ther-mostats in the system is 6400. Logging devices collect data every 1 ms, 10 ms, 100 ms, and 1 s, and then, the upper limit values of collecting cycle are 6.4, 64, 640, and 6400 s, respectively (Table 8). In the case of temperature control accuracy is not very high, most de-vices collect data every 100 ms and 1 s; the upper limit value of collecting cycle being 11 and 110 min. In the ac-tual industry, however, temperature during this period must have been changed; thus, the collected data will
not be continuous, the plotted temperature curve will be on and off. This means that there are possibilities that data is lost when upper computer collects data according to the theoretical maximum of temperature control points:
1. The logging device sends wrong data due to environmental interferences and the upper computer loses this data
2. Because of too many temperature control points, the upper computer just misses them in acquisition cycles and data which logging devices have collected
Fig. 5Several major upper computer software interface screenshots of field experiments.aSet curve data of thermostat.bReserving technology curve.cMonitoring the state of implementation of the thermostat.dOutput test report
Table 7Performance, price, cost, and scalability
Centralized control system Decentralized control systems
Maximum data collection point
Operating Performance
Reliability Comprehensive cost
Stability data collection
Maximum data collection point
Operating Performance
Reliability Comprehensive cost
Stability Data collection
6400 Well be
off line
on the period covered by the new data, the original data cannot be read and loss, severely creating a vicious circle. The upper computer does not read out data, resulting in data loss
The author proposes data sampling compensation al-gorithm in order to use computational methods to make up the lost data on acquisition points, keeping data in-tegrity when system draws temperature curves in real time, and at the same time, adding this data into data-base to preserve the integrity of experiment data.
7.1 Design philosophy
If thermostats are to be read every 1 min, the upper limit value of acquisition is 11 min, which means every thermostat loses 10 data. We can acquire these 10 data by computation through the following formula. To sim-plify the computation, we fetch the upper or lower limit of the interval (60, 6400) as the number of thermostats described in the algorithm, i.e., 60 or 6400.
Linear equation method: let x be time and y be temperature value of thermostats, then the linear equa-tion of any segment of temperature curve is:
Y¼ðy2‐y1Þ=ðx2‐x1Þ X
þðy1x2‐y2x1Þ=ðx2‐x1Þ ð1Þ
where x1 and x2 are the beginning and ending time
of some section of the curve; y1 and y2 are the
temperature value at the beginning and ending of the curve section.
Historical data reference: let Uji be lost temperature value andVjibe the temperature value of the same basal meter i and the same logging device jat the same mo-ment during the same temperature control period of the same prescribed temperature curve in the database;
∑Vji(t= 1……n) is the sum of nhistorical data;Yji is the value of the same meter computed according to the pre-scribed temperature curve value, that is, formula (1), thenUjiis formula (2) or (3).
Table 8Data acquisition cycle (with the thermostat 6400)
Acquisition interval 1 ms 10 ms 100 ms 1000 ms
Logging device acquisition cycle 80 ms 800 ms 8000 ms 80000 ms
Upper computer acquisition cycle 6.4 s 64 s 640 s 6400 s
Result Normal Normal Loss Loss
Uji¼MinfYji‐Vji12; Yji‐Vji22; Yji‐Vji32……
Yji‐Vji
n‐12; Yji‐Vji
n2g
ð2Þ
Uji¼
X
Vji=n ð3Þ
Simplified system workflow Fig. 6.
7.2 Algorithm design
(1) Description of algorithm STEDAFA (Statistics Temperature Data Fitting Algorithm)
The data fitting algorithm for temperature control data acquisition is described with pseudo-C language as follows, where 60≤ThermostatNum≤6400 for the thermostat number, 1≤j≤80 for the logging device number, 1≤i≤80 for the number on the thermostat logging devices connected, U is calculated compensa-tion value, vector Vji [n] for the same point, the same process temperature curve in, earlier time different values of n.
(2) Temperature data collecting algorithm
Within the prescribed sampling period, logging de-vices may without send data or send wrong data; temperature data collecting algorithm means that upper computer reads out the real-time temperature values may not right. In the paper, we proposed
temperature data collecting algorithm. The algorithm can resolve the defect of missing data and wrong data. The algorithm is called TDCA(int j, int i). Its work flow can be seen in Fig. 7, and its pseudo-C language code is described as follow. The variables ThermostatNum, j, and i meaning the same with STEDAFA (ThermostatNum, j, i). U is the collected or calculated compensation value, m is the number of losing data and num is the loop control variable.
7.3 Contrast
(1) Performance contrasting
According to the proposed algorithm, the hardware and software designs are completed, and a centralized control system is realized. The system has been used by many university laboratories and a number of enter-prises recently. The users who offered statistical results are reflected in Table 9.
(2) Curve contrasting
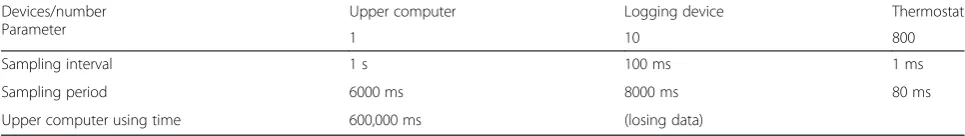
An experimental comparison of the technology curve is displayed in Fig. 4. The experimental conditions, which are a simulation environment, are shown in Table 10. Data can be collected by upper computer read from logging devices once per minute. There are 10 log-ging devices. Each loglog-ging devices connected to 80 thermostats.
Fig. 7Upper computer acquisition process
Table 9Performance contrasting
Without using data fitting algorithm Using data fitting algorithm
Accuracy Scale Reliability Satisfaction Accuracy Scale Reliability Satisfaction
After several tests, the ideal technology curve, missing data technology curve, and after using the algorithm (shown in Fig. 4) technology curves are shown in Fig. 8. In this test, t0 to t8 are time 0 to 120 min. The tempera-tures are 20 to 60 °C. Obviously, after the adoption of this algorithm to compensate for the lost data, the curve seemed to be more complete in this process.
(3) Price contrasting
In order to correctly compare different scale systems, the sizes of the assumed temperature control system are 160, 640, 1280, and 2560 units; according to the market
price of modest hardware equipment, the system using data fitting algorithm and system without using data fitting algorithm, these results are recorded in Table 11.
7.4 Software screenshot
The upper computer software has been completed, temperature control, for example, and is currently being controlled on-site corporate and university laboratories test run, looking forward to the follow-up gradually im-proved (Fig. 9).
Table 10The simulation environment
Devices/number Parameter
Upper computer Logging device Thermostat
1 10 800
Sampling interval 1 s 100 ms 1 ms
Sampling period 6000 ms 8000 ms 80 ms
Upper computer using time 600,000 ms (losing data)
8 Conclusions
Temperature control system structure used mostly for the upper computer is connected directly to the control thermostat decentralized bi-slayer structure, which has obvious flaws, such as high cost, not to scale and low intelligence. This article proposes a design scheme of telligent three-layer structure including thermostats, in-telligent logging devices, and upper computer; it can be called centralized control systems. Upper computer can read out data not only directly from thermostats, but also from intelligent logging devices. This scheme solves the problems in the application of bi-layer structure preferably, and it is also suitable for larger scale control
systems of other kinds. Based on it, the corresponding products have been developed and applied in practical industrial manufacture and experiment teaching. There are still some imperfections in this scheme, for example, the logging intelligent devices may lose the collected data.
There also exists data loss during data gathering of upper computer in this scheme when systems reach a great scale. In this article, the author proposes an algo-rithm making use of the historical data in DB and the linear characteristics of temperature curves to improve data collection, preferably solving the problem of data loss. For this algorithm, we have applied for the country Table 11Price contrasting (ten thousand US dollar)
Without using data fitting algorithm Using data fitting algorithm
160 640 1280 2560 160 640 1280 2560
2.3 11.2 21.4 45.8 Reduction 15 % Reduction 23 % Reduction 31.5 % Reduction 38 %
d
patent of invention and have already succeeded in apply-ing it to the products of centralized temperature control system.
Acknowledgements
We have benefited a lot from Professor Liao Bin’s guidance. We very much appreciate the comments made by Professor Wang from Wuhan Textile University. Fund subsidized: The Hubei Technology Support Program No. 2014BAA089. This study has applied for People’s Republic of China’s national invention patents, patent application number is 201310037466.4.
Received: 2 September 2015 Accepted: 20 December 2015
References
1. M Ondrovicova, M Bakosova,PID controllers of industry system semantic[C]. 7th International Scientific Technical Conference—process control 2006(Kouty nad Desnou, Czech Republic, 2006)
2. Gibler J, Schmid M, Vom Prozeb zur Regelung. Analyze Realisierung in der Praxis. Siemens AG[M]. 2008, ISBN 3-8009-1551-0.
3. S Jaszczak, J Kołodziejczyk,A method of fast application of the fuzzy PID algorithm using industrial control device[M](Springer, Berlin Heidelberg, 2011). ISBN 978-3-642-29346-7
4. G Zaidner, S Korotkin, Non linear PID and its application in process control[C]. 2010 IEEE 26th Convention of IEEE Electrical and Electronics Engineers in Israel (IEEEI), 2010:000574-000577 (IEEE press, Eliat)
5. J Han, From PID to active disturbance rejection control[J]. IEEE Transaction on Industrial Electronics56(no.3), 432–438 (2009)
6. S Zhi-gang, Q-x Yu, A design of hyperbola and parabola drawing apparatus[J]. Mechanical Design and Manufacturing4, 11–13 (2003) 7. Y Zheng-rui, X Ke-xin, Identification of temperature and humidity
control systems based on neural system [J]. Transactions of China Electrotechnical Society, 2004(10)
8. Y Qi-wei, C Yi. The comparison of common methods of controlling temperature[J]. Ordnance Industry Automation, 2005(6):86-88
9. X-J Liu, CW Chan, Neuro-Fuzzy Generalized Predictive Control of Boiler Steam Temperature[J]. IEEE Transactions on Energy Conversion21(4), 900–908 (2006) 10. Y Ge, C Wang, H Wang, et al. Research on scanning motor digital control
system based on single neuron self-adaptive PID[C]// Computer Science and Information Technology (ICCSIT), 2010 3rd IEEE International Conference on. IEEE, Cheng du, China, 2010:134-138
Submit your manuscript to a
journal and benefi t from:
7 Convenient online submission
7Rigorous peer review
7 Immediate publication on acceptance
7Open access: articles freely available online
7 High visibility within the fi eld
7Retaining the copyright to your article