Automatic determination of source parameters of the 2007 Noto Hanto
earthquake
Changjiang Wu and Shigeki Horiuchi
National Research Institute for Earth Science and Disaster Prevention, 3-1 Tennodai, Tsukuba, Ibaraki 305-0006, Japan
(Received June 29, 2007; Revised November 21, 2007; Accepted December 5, 2007; Online published November 7, 2008)
Large earthquakes have been observed to be caused by the rupture of several asperities. The rapid determination of source parameters is hence of great importance for correctly determining shaking intensities or evaluating the strong motion distribution generated by a large earthquake. This study shows that we can automatically preprocess strong motion data using automatic P- and S-phase pickers, determine the focal mechanism, and identify the fault plane from two nodal planes. A real-time simulation is performed for the 2007 Noto Hanto earthquake. Using our automatic fault plane identificator, we were able to identify one of the nodal planes with a strike of 62◦ and a dip of 70◦within a 30-s interval from the beginning of focal mechanism determination to the end of waveform inversion. Results from automatic inversions showed that the slip was confined to a shallow portion with a maximum slip of about 3 m. The total seismic moment released in 10 s was 2.0×10¹⁸N m, which
corresponds to a moment magnitude of 6.8.
Key words:Real-time, earthquake, source parameter, rupture process.
1.
Introduction
With the enhancement of regional seismic networks as well as the rapid development of internet communication technology and computer technology, real-time seismol-ogy has become a practical approach to effectively mitigate damage from earthquakes. For example, using P-wave ar-rival times and amplitudes from only a few stations, a real-time earthquake analysis system developed by Horiuchiet al.(2005) can precisely locate the earthquake within a few seconds and issue an early-warning for the S-wave shak-ing. This system is installed in the National Research Insti-tute for Earth Science and Disaster Prevention (NIED) and worked well when the Noto Hanto earthquake occurred on May 25, 2007. This automatic procedure, however, mod-els an earthquake as a point source, which provides in-sufficient data for determining shaking intensity or evalu-ating strong motion distribution caused by a large earth-quake, since large earthquakes are usually observed as two-dimensional asperities (e.g., Yamanaka and Kikuchi, 2004). Several methods aimed at rapidly and automatically de-termining earthquake fault planes or revealing the rupture process have been proposed (e.g., Dreger and Kaverina, 2000; Kuge, 2003; Hori, 2004). After the moment of ten-sor inversion, one should determine which of the nodal planes of the focal mechanism is the fault plane and subse-quently estimate the dimensions of the faulting area before the finite-plane source inversion. A finite-fault model was thus obtained in 11–20 min by applying Dreger and Kave-rina’s method for the earthquakes with M >5.5 in North-ern California. Kuge (2003) proposed a similar automatic
Copyright cThe Society of Geomagnetism and Earth, Planetary and Space Sci-ences (SGEPSS); The Seismological Society of Japan; The Volcanological Society of Japan; The Geodetic Society of Japan; The Japanese Society for Planetary Sci-ences; TERRAPUB.
method and verified it using simulations of six earthquakes in Japan. In contrast, Hori (2004) proposed a method for rapidly estimating the seismic fault plane using the after-shock hypocenters in a short period. Unfortunately, how-ever, all of these methods are time consuming and imprac-tical for a real-time warning system. In this study, we pro-posed an automatic method leading toward real-time deter-mination of the finite-fault slip distribution.
2.
Methodology
Our methodology is shown in as a flow chart in Fig. 1. In-stead of waiting for the moment tensor solutions of a larger earthquake, we determine the focal mechanism using the amplitude (with polarity) of the P-wave first motions as soon asP-wave arrivals are detected. The focal mechanism consists of two nodal planes, and the fault plane is identified by comparing the moment indexes of the two nodal planes using P-waves only. Given that the magnitude of a larger earthquake is known (it has been reliably estimated by the Horiuchi system; Yamamotoet al., 2007), waveform inver-sion for a finite-fault plane source model is then carried out. 2.1 AutomaticP-wave andS-wave pickers
Robust and automaticP-wave detection is of crucial im-portance for a real-time earthquake location system. P -wave particle motion is usually observed in a direction that is nearly perpendicular to the surface, whereas particle mo-tion of noise is random and surface-wave-like. It is this property of P-waves, in addition to the ratios of the short time average (STA) to the long time average (LTA), which is used for ourP-wave picker. To estimate the magnitude and to identify the fault plane from the P-wave, we also need an automatic S-wave picker. OurS-wave picker takes into account the physical property that the plane ofS-wave par-ticle motion is perpendicular to the direction of theP-wave
Wait for warning
Fig. 1. Flow chart of the automatic inversion method. Simulation is performed given that the warning of an earthquake withM = 6.0 is issued.
particle motion. This property has been widely used for au-tomatic detection ofS-waves (e.g., Cichowicz, 1993; Oon-incx, 1999). Following the denotation of OonOon-incx, we con-structed a cross-power matrix{Ci j}of a three-component seismic signalu=(u1,u2,u3)
and calculated four characteristic functions as follows
κp =
where λi are the eigenvalues of the cross matrix C with
λ1 ≥ λ2 ≥ λ3, vi is the corresponding eigenvectors, vp is the vector of the P-wave direction, andais an adjusting parameter equal to the largest eigenvalue of the background noise cross power matrix. Here we have a robust estimator forP-wave arrivals
TP =T(max(STA/LTA)|κP ≥0.8) (6)
and forS-wave arrivals
TS =T(max(κ=κ12·κ22·κ32)|STA/LTA≥2) (7)
where max(x)means a local maximum ofx. 2.2 Fault plane identificator
In order to rapidly identify the fault plane from the two nodal planes of the focal mechanism, the Green’s func-tions Gn(t;τ,i,j)used in this step are simplified so that only the geometrical spreading effects and radiation ef-fects (Aki and Richards, 1980) are considered. The re-leased moment m(τ,i,j) at the time step τ at the (i,j)
grid can be determined by minimizing the error between
isk001
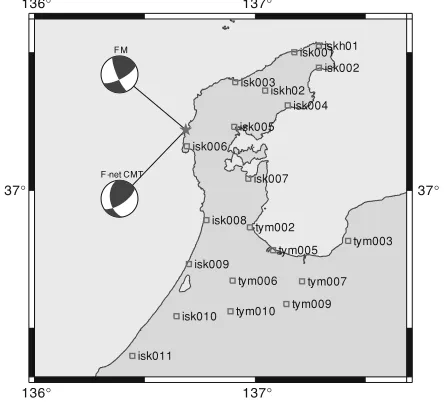
Fig. 2. Station map. Squares mean the location of stations used in this study. The epicenter is marked by the star. Two mechanisms listed in Table 1 solutions are shown, where FM means the focal mechanism solution obtained in this study.
the observed amplitudeun(t)and the predicted amplitude
m(τ;i,j)·Gn(t;τ,i,j). For simplicity, only grids inside a ring betweenr (in km) =2.0t andr =3.5t (in second) are searched at each time step. The moment release at each grid can be estimated as follows
m(τ,i,j)=
If one summarizes the released moment of all grids at all time steps for the two nodal planes, respectively, the sum on the actual rupture plane should be smaller than the other one. Summation ofm(τ,i,j)is hence defined as the fault plane identificator. It corresponds to a minimum moment inversion (Jiet al., 2002).
2.3 Automatic waveform inversion
To rapidly invert the source process, one should first con-struct a database of standard Green’s functions. The stan-dard Green’s function can be readily convolved with any source time function and interpolated at any distance. In this study, the Green’s functions were calculated using the reflection/transmission matrix method (Kennett and Kerry, 1979). Using the magnitudeMissued by Horiuchi system, we estimate the fault size as follows
L =100.6∗M−2 (9)
The fault plane is divided into small subfaults, allowing their slip vectors to be rotated up to 90◦. The source time function on each subfault is expressed by six half-overlapped isosceles triangles with a width of 1 s. The inversion method has been described in detail in previous studies (see, for example, Wu and Takeo, 2004).
3.
Strong Motion Data and Preparation for
Inver-sion
-Fig. 3. Example of automaticS-phase picker for records. T0 is detected as theP-phase arrival and T1 as theS-phase arrival. The upper two show calculated indices (see formula (7)) forS-wave picker. The lower three show the seismogram recorded at ISK002.
Table 1. Focal mechanism and fault plane identification. Nodal Strike Dip Rake Identification Index
1 62.01 69.53 167.16 118.46 (identified) 2 156.56 77.98 20.95 334.89 (rejected) F-net MT 56/173 66/48 132/34
andS-wave arrival times were picked automatically by the
P- andS-wave pickers. An example is shown in Fig. 3. Ta-ble 1 lists the focal mechanism as well as the identification index of the fault plane. The F-net Moment tensor solution is also listed for comparison. The velocity model proposed by Ukawaet al. (1984) was used for calculating Green’s functions.
4.
Simulation Results
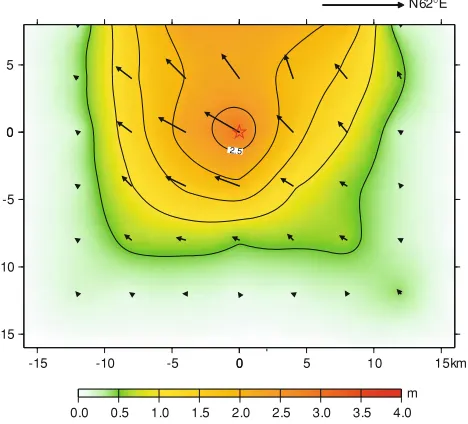
An automatic source inversion was simulated for the 2007 Noto Hanto earthquake in the same computer where the Horiuchi system is operated. It took less than 15 s to identify the fault plane using P-waves at 20 stations. The fault plane is automatically divided into 7×6 subfaults (of size 4×4 km). Approximately another 15 s is needed to invert the source process if we use 5 Hz-sampled wave-forms with a duration of 30 s recorded at eight stations (au-tomatically selected according the order of P-wave arrival times). As Fig. 4 shows, the large slip is confined to the shallow part around the hypocenter, with the maximum slip of about 3 m. The seismic moment determined from this finite source model is 2.0×10¹⁸N m, corresponding to a
moment magnitude of 6.8. The waveform fitting is excel-lent considering that only eight stations are included (see Fig. 5). Our result is consistent with the source model in-verted from teleseismic body waves (Yamanaka, 2007).
5.
Discussion and Conclusions
Using a novel approach to quickly determine the fault plane, we are able to determine the focal mechanism based
-15 -10 -5 0 5
-15 -10 -5 0 5 10 15km
2.5
0
0
0.0 0.5 1.0 1.5 2.0 2.5 3.0 3.5 4.0
m N62 E
Fig. 4. Slip and slip vector distribution of the Noto Hanto earthquake obtained from the automatic inversion using records at 8 stations. Hypocenter is marked by a red star. The flame axes are given in kilome-ters.
on the amplitude (with polarity) ofP-wave first motions. A proper velocity model is required for a stable solution of the focal mechanism. The automatic procedure needs to wait for CMT solutions when the focal mechanism solution is not satisfactory. Once the focal mechanism is determined, the more observations that are used, the more reliable the identification of the fault plane becomes. To achieve this, a natural feature of a real-time system can be used: the length of the signals and the number of available stations increase with time.
inter-isk006_ud 9.2 isk006_ns 14.7 isk006_ew 7.5 isk005_ud 4.9 isk005_ns 3.9 isk005_ew 13.9
isk003_ud 3.5 isk003_ns 6.2 isk003_ew 4.1 isk007_ud 2.1 isk007_ns 4.2 isk007_ew 5.5
iskh02_ud 1.9 iskh02_ns 3.9 iskh02_ew 2.4 isk008_ud 3.6 isk008_ns 9.3 isk008_ew 15.0
isk004_ud 1.8 isk004_ns 4.5 isk004_ew 2.1 tym002_ud 1.6 tym002_ns 6.6 tym002_ew 7.4
30.00s observation
synthetic
Fig. 5. Comparison of observation waveform (black) with synthetic waveform (red). The maximum amplitude (in cm/s) is shown on the upper right corner for each component.
-15
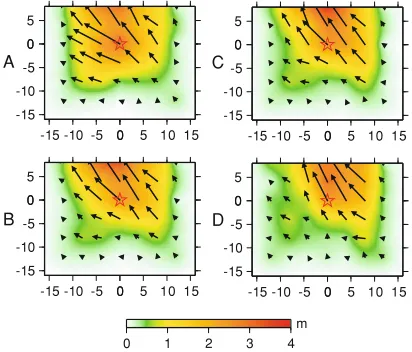
Fig. 6. Comparison of slip distributions of the Noto Hanto earthquake using different sets of records. A: slip inverted from records of eight stations; B: slip inverted from 12 stations; C: slip inverted from 16 stations; D: slip inverted from 20 stations. The flame axes are given in kilometers.
esting to note that the asperity area (i.e. large slip) moved landward when more stations were included while at the same time the time consumed for Green’s function convo-lution and waveform inversion increased to 30 s. Because of the trade-off between the resolution and time, automatic selection of stations on the basis of station azimuth should be considered when more and more stations are available for inversion. In the case of a large earthquake, such a se-lection could save significant time.
We should point out that our simulation was performed using offline K-NET and KiK-net strong motion data. We will test this method for other large earthquakes using K-NET or KiK-net strong motion data, but it is still not a practical real-time procedure unless we can successfully perform simulations using real-time net data. Since Hi-net sensors have a much narrower dynamic range and show a cutoff of frequencies below 1 Hz (Obara, 2005), real-time source process inversion will become more difficult.
In conclusion, using our automatic P-wave and S-wave pickers, we can read the amplitude (polarities included) of
P-wave first motions and determine the focal mechanism automatically. The fault plane can be identified from the two nodal planes using the P-phase data. It takes 30 s for an automatic inversion when there are less than ten stations. When we performed a simulation for the 2007 Noto Hanto earthquake, we were able to identify one of the nodal planes with a strike of 62◦and a dip of 70◦as the fault plane using our automatic fault plane identification method. The result from automatic inversion showed that the slip was confined to shallow part with the maximum slip of about 3 m. The total seismic moment released in 10 s was 2.0×10¹⁸N m,
corresponding to a moment magnitude of 6.8.
Acknowledgments. This study is supported by the leading project ‘Research Project for the Practical Use of Real-time Earth-quake Information networks’. We used strong-motion seismo-grams recorded by the K-NET and KiK-net of NIED, Japan.
References
Aki, K. and P. G. Richards,Quantitative seismology, Freeman and Com-pany, San Francisco, 1980.
Cichowicz, A., An automaticS-phase picker,Bull. Seismol. Soc. Am.,83, 180–189, 1993.
Dreger, D. S. and A. Kaverina, Seismic remote sensing for the earthquake source process and near-source strong shaking: a case study of the October 16, 1999 Hector Mine earthquake,Geophys. Res. Lett.,27, 1941–1944, 2000.
Hori, S., Automated methods for rapid estimation of a seismic fault plane, Research Report of National Research Institute for Earth Science and Disaster Prevention, No. 65, 1–23, 2004.
Horiuchi, S., H. Negishi, K. Abe, A. Kamimura, and Y. Fujinawa, An auto-matic process system for broadcasting earthquake alarms,Bull. Seismol. Soc. Am.,95, 708–718, 2005.
Ji, C., D. J. Wald, and D. V. Helmberger, Source Description of the 1999 Hector Mine, California, Earthquake, Part II: Complexity of Slip His-tory,Bull. Seismol. Soc. Am.,92, 1208–1226, 2002.
Kennett, L. N. and N. J. Kerry, Seismic waves in a stratified half space, Geophys. J. R. Astr. Soc.,57, 557–583, 1979.
Kuge, K., Source modeling using strong-motion waveforms: toward au-tomated determination of earthquake fault planes and moment-release distribution,Bull. Seismol. Soc. Am.,93, 639–654, 2003.
76, 021301-1-12, 2005.
Oonincx, P. J., A wavelet method for detectingS-wave in seismic data, Computational Geoscience,3, 113–134, 1999.
Ukawa, M., M. Ishida, S. Matsumura, and K. Kasahara, Hypocenter de-termination method of the Kanto-Tokai observational network for mi-croearthquakes,Rep. Natl. Res. Inst. Earth Sci. Disas. Prev.,53, 1–88, 1984.
Wu, C. and M. Takeo, An intermediate deep earthquake rupturing on a dip-bending fault: Waveform analysis of the 2003 Miyagi-ken Oki earthquake,Geophys. Res. Lett.,31, doi:10.1029/2004GL021228, 2004. Yamamoto, S., S. Horiuchi, H. Nakamura, and C. Wu, Effectiveness of
seismic intensity magnitude for earthquake early warning,Geophys. Explora., 2007 (in Japanese) (in press).
Yamanaka, Y., The March 25, 2007, Noto Hanto earthquake,EIC Seismol. Note, No. 185, 2007.
Yamanaka, Y. and M. Kikuchi, Asperity map along the subduction zone in northeastern Japan inferred from regional seismic data,J. Geophys. Res.,109, doi:10.1029/2003JB002683, 2004.