Deviation of linear relation between streaming potential and pore fluid
pressure difference in granular material at relatively
high Reynolds numbers
Tohru Watanabe and Yoshiko Katagishi
Department of Earth Sciences, University of Toyama, Gofuku 3190, Toyama 930-8555, Japan
(Received December 24, 2005; Revised May 29, 2006; Accepted June 9, 2006; Online published September 16, 2006)
We conducted streaming potential measurements on the packing of glass beads, and investigated the deviation of streaming potential from the Helmholtz–Smoluchowski (H-S) equation. The H-S equation was originally derived on the assumption of laminar flows. Studies using a capillary have shown that the H-S equation is valid for turbulent flows in so far as the viscous sublayer is thicker than the electrical double layer and the entrance effect is negligible. Although the streaming potential in porous media has been reported to deviate from the H-S equation for turbulent flows, its mechanism is still poorly understood. We measured the fluid flux and the streaming potential as a function of the pore fluid pressure difference. The fluid flux begins to deviate from Darcy’s law at Reynolds number>3, and the streaming potential begins to deviate from the linear relation at larger Reynolds numbers. When the flow is fast, the fluid inertia separates the boundary layer from the solid surface and induces the counter flows. The fluid in the counter-flow region is separated from the circulating fluid, and ions there cannot contribute to the convection current. We think that this results in a lower streaming potential than expected from the H-S equation.
Key words:Streaming potential, Helmholtz-Smoluchowski eauation, turbulent flow, Reynolds number.
1.
Introduction
The streaming potential is the most plausible mechanism for generation of electrical potential variations observed in geothermal area and volcanoes. It is generated by the flow of a fluid in contact with a solid. When a solid and an electrolytic solution are in contact, the solid surface is negatively charged in general. Cations in the solution are electrically attracted to the surface. The attractive force and the thermal agitation operate competitively to form an electrical double layer, which consists of a partially fixed part (Stern layer) and a diffuse part (e.g., Shaw, 1980). The solution outside the double layer is electrically neutral. When a flow is driven, excess cations in the diffuse layer move and generate a potential difference across the flow.
The generated potential difference reflects the driving fluid pressure gradient. For simplicity, we consider a flow in a circular tube. The electrical current density is expressed by
j = −σf +Ss
∇V +ες η ∇P,
whereV is the electrical potential, Pthe fluid pressure,σf
the fluid conductivity, s the surface conductance, the
fluid permittivity, ζ the zeta potential (the potential at the slipping plane),ηthe fluid viscosity, andSthe specific sur-face area (Ishido and Mizutani, 1981). The first term rep-resents a conduction current governed by Ohm’s law, and
Copyright cThe Society of Geomagnetism and Earth, Planetary and Space Sci-ences (SGEPSS); The Seismological Society of Japan; The Volcanological Society of Japan; The Geodetic Society of Japan; The Japanese Society for Planetary Sci-ences; TERRAPUB.
the second term a convection current generated by moving excess ions. In the stationary state with a fixed fluid pres-sure gradient, the net electrical current is vanishing. The generated potential difference (streaming potential) is thus related to the fluid pressure difference as
V
P =
εζ ησf +Ss
, (1)
which is the Helmholtz–Smoluchowski (H-S) equation. Observed electrical potential variations can be used to map subsurface fluid flow in terms of the streaming poten-tial (Hashimoto and Tanaka, 1995). One application is de-lineating the geometry of faults (Revil and Pezard, 1998). These studies are based on the H-S equation. The pressure difference along a subsurface flow can be, thus, estimated from the potential difference, if the properties of the liquid and solid-liquid interface are known.
The H-S equation has been applied to porous media in which pore spaces are tortuous and have various apertures. The surface conduction is due to migrations of ions in the double layer. Revil and Glover (1998) showed that cations in the Stern layer are principal charge carriers. Anions mi-grate only through connected pore spaces, while the sit-uation is more complex for cations (Revil et al., 1998). Cations migrate dominantly through connected pore spaces at high salinities, while the solid-liquid interface is the dom-inant migration path at low salinities. This gives rise to non-linear behavior of the relationship between the effective conductivity of fluid-saturated porous media and the fluid conductivity (Bernab´e and Revil, 1995). At high salinities,
we can suppose that the surface conduction works parallel with the conduction in the bulk fluid (Revil, 2002). The H-S equation for porous media is thus written as
V
P =
εζ ησf +2s
, (2)
where 2/is an effective surface-to-pore-volume ratio de-fined by whereψis the electric potential (Johnsonet al., 1986). In-tegration in the numerator is over the pore surface, and that in the denominator over the pore volume. Each area or volume element is weighted according to the local electric field. This eliminates contributions from isolated pores that do not contribute to transport. The length-scaleis thus considered to be an effective pore-throat radius that con-trols the transport properties through the connected porosity (Revil, 2002).
The coupling coefficient (V/P) is insensitive to the
pore structure when the contribution of the surface conduc-tion is negligible. When the fluid conductivity is sufficiently high and/or the effective pore throat radius is sufficiently large, the contribution of the surface conduction is negligi-ble and the coupling coefficient is independent of the effec-tive pore throat radius. However, the coupling coefficient depends on the pore structure when the surface conduc-tion significantly contributes to the electrical conducconduc-tion. Bernab´e (1998), using a detailed theoretical model, demon-strated that the coupling coefficient shows distinct depen-dence on the pore size for dilute solutions. Jouniaux and Pozzi (1995) conducted streaming potential measurements on rock samples, and found that the coupling coefficient in-creases with the permeability. This can also be explained by the contribution of the surface conduction. A lower per-meability sample may have a smaller effective pore throat radius. Because of the larger contribution of the surface conduction, it has higher conductivity to decrease the cou-pling coefficient.
The H-S equation was originally derived on the assump-tion that the fluid flow is laminar. Excess ions are assumed to move parallel to the tube wall and to have velocities proportional to the applied pressure gradient. In turbulent flows, excess ions can also move in the radial direction. The validity of the H-S equation for turbulent flows has been long examined.
Streaming potential measurements using a capillary have shown that the H-S equation is valid, even for turbulent flows in so far as the viscous sublayer is thicker than the electrical double layer (Bocquetet al., 1956; Rutgerset al., 1957; Stewart and Street, 1961; Kurtzet al., 1976). The viscous sublayer is a region near the solid surface where the viscous resistance is dominant, and the flow outside this layer is turbulent (e.g., Landau and Lifshitz, 1980). If the viscous sublayer is thicker than the double layer, the motion of excess ions is similar to that in the laminar flow. The number of carried excess ions is proportional to the pressure gradient, though the total fluid flux is no longer proportional to the driving pressure gradient.
The thickness of the viscous sublayer is in the order of
η/ρv, where ρ andv are the fluid density and the aver-age fluid velocity, respectively (Landau and Lifshitz, 1980). The double layer thickness is of the order of Debye screen-ing lengthχd, which is given by
wherekis the Boltzmann constant,T the absolute temper-ature, ethe elementary charge, zi andni are the valence
and the number density of theith ionic species (Revil and Glover, 1997). When we consider a 10−4mol/l NaCl aque-ous solution, Debye screening length is around 30 nm at 27◦C. Therefore, the viscous sublayer is thicker than the electrical double layer, if the average velocity is lower than 30 m/sec. This is usually the case.
Rutgerset al.(1957) conducted very interesting experi-ments on the streaming potential. They used benzene doped with Zn-di-isopropyl salicylate as an electrolytic solution. They used an extremely dilute solution to make the dou-ble layer thicker than the viscous sublayer, and detected the onset of the turbulent flow by the streaming potential mea-surements. When the flow became turbulent, excess ions obtained large velocities and generated large streaming cur-rents.
Bocquetet al.(1956) also pointed out that the entrance effect should be negligible for the H-S equation to be valid. When the fluid flux is introduced from a wider conduit to a capillary, the fluid inertia makes the velocity profile tran-sitional near the entrance. The boundary layer is a re-gion where the fluid velocity steeply increases with dis-tance from the solid surface (Landau and Lifshitz, 1980). The thickness of the boundary layer increases with distance from the entrance. The flow is considered to be established when the boundary-layer thickness becomes comparable to the capillary radius. The H-S equation was derived for fully established flows. The ionic flux in the transitional region can give rise to the deviation of the streaming potential from the H-S equation. This is called the entrance effect. If the capillary is long enough compared with the transitional re-gion, the entrance effect can be neglected.
The fluid paths in porous media are tortuous and have changing apertures. The flow in porous media thus cannot be treated simply as an analog of a capillary. For slow flows, the fluid flux obeys Darcy’s law and the streaming potential the H-S equation (Ishido and Mizutani, 1981). It can be understood on the basis of the flow in a capillary. However, the streaming potential in porous media has been reported to deviate from the H-S equation for fast flows (Tuman, 1963; Lorneet al., 1999). Although the deviation has been attributed to the influence of turbulent flow, its mechanism is still poorly understood. The influence of turbulent flow might be important in some geophysical systems like fault zones (Lorneet al., 1999).
NaCl Solution (a) Hydraulic Head
Inlet
Electronic Balance Outlet
Glass-beadsGlass beads
Pressure Transducer (Max: 4.9 kPa)
Pressure Transducer (Max: 49 kPa)
Transducer Amp. Transducer Amp.
Ag-AgCl Electrodes
Differential Amp.
Inlet
(b) N2 Gas
NaCl Solution
N2 bomb
Inlet
Fig. 1. A schematic diagram of streaming potential measurement system. The fluid flow is driven by (a) the hydraulic head of a fluid reservoir (P<20 kPa), or (b) the compressed N2gas (P<100 kPa).
and the streaming potential began to deviate from the H-S equation at a higher flux. In this paper, we will report our streaming potential measurements, and discuss the devia-tion mechanism on the basis of detailed structures of porous flows.
2.
Experiments
2.1 Sample assemblyWe used the packing of glass beads as a porous medium to study the nature of streaming potential. The use of glass beads provides us with a chemically uniform and inert solid-liquid interface. It also enables us to check our exper-imental method easily, because the interface between glass and water has been well studied (Jednaˇcak et al., 1974). Glass beads of various sizes are manufactured for industrial use. The size of pore space can be controlled by changing the bead size.
Glass beads were densely packed in a cylindrical con-tainer (PMMA: polymethyl methacrylate), 19 mm inner di-ameter and 40 mm length. The container was closed at both ends by insulating Tetron mesh (opening: 100 μm). We used three sets of glass beads: BZ-02 (Diameter=177–250
μm, Median=214 μm), BZ-04 (Diameter=350–500 μm, Median=425 μm), and BZ-08 (Diameter=710–990 μm, Median=850μm). In the following, we will use the median of diameters as the characteristic size of each set. Though the detailed chemical composition of the glass is unknown, the composition is identical for three sets (density=2.5 g/cm3). The porosity was calculated by the density method (Gu´eguen and Palciauskas, 1994), and it was 0.35±0.01 irrespective of the bead size. The sample was connected to end plugs through which the fluid was flown in and out (Fig. 1). An electrode and a pressure transducer are mounted on each plug.
The NaCl aqueous solution was used for the streaming potential measurements. NaCl is one of the well-studied simple 1:1 electrolytes, and the electrical conductivity can be easily controlled by its concentration. The concentration of 5×10⁻⁵mol/l was chosen to perform high-quality poten-tial measurements and to make the conduction in the bulk fluid dominate the electrical conduction. The H-S equa-tion (2) implies that larger potential difference is generated
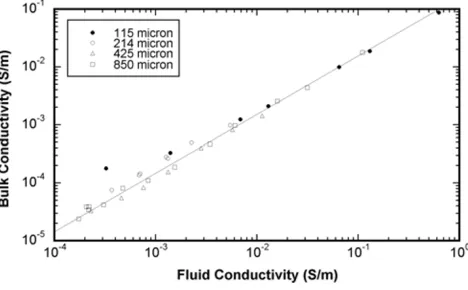
Fig. 2. The effective conductivity of fluid saturated glass bead samples as a function of the fluid conductivity. The bulk conductivity is proportional to the fluid conductivity for the median diameter larger than 214μm, implying that the conduction in the bulk fluid dominates the electrical conduction.
for lower fluid conductivity. The use of a low conductivity fluid thus increases the S/N ratio of potential measurements. However, it increases the contribution of surface conduction and complicates the interpretation of the measured stream-ing potential with different bead sizes. When the fluid con-ductivity is sufficiently high and the bulk conduction dom-inates the electrical conduction, the contribution of the sur-face conduction can be neglected. The relation between the effective conductivity and the fluid conductivity shows that the surface conduction is negligible when the fluid conduc-tivity is higher than 10−4S/m for three sets of beads (Fig. 2). The surface conduction contributes significantly to the con-duction for glass beads with a diameter of 105–125μm.
The solutions of 5×10⁻⁵mol/l were prepared by diluting a solution of 1×10⁻²mol/l. We used the solution with the conductivity of (7.5±0.6)×10−4 S/m at 23◦C, and pH was 7.5. The electrical conductivity was measured with an LCR meter (NF, ZM2355).
2.2 Measurement system
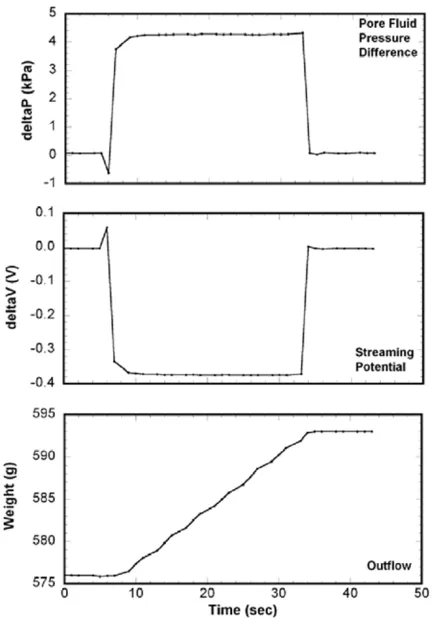
Fig. 3. A typical data measured for the bead sample with the median diameter of 214μm. The average pore fluid pressure difference is calculated to be 4.272±0.008 kPa for the time interval from 15 to 30 second, and the average streaming potential−0.3744±0.0005 V. The average flux is calculated to be 0.644±0.002 g/sec.
for the hydraulic head and the N2 gas, respectively. The flow rate is calculated from the weight of outflow measured with an electronic balance (Mettler Toled, PB602-S). The resolution of the weight is 10 mg.
Precision semiconductor pressure transducers (Mat-sushita Electric Works, ADP1101 (Max: 4.9 kPa) and ADP1131 (Max: 49 kPa)) measure the pressure deviation from the ambient pressure. The amplifier converts the pres-sure deviation to voltage, which is meapres-sured by a data log-ger (Agilent Technology, 34970A).
Electrodes used for the potential measurement are made of Ag-AgCl, which is regarded as good reversible elec-trode material to minimize the interfacial polarization. Fol-lowing Wong (1999), we made Ag-AgCl electrodes by ap-plying household chlorine bleach on silver wire (0.3 mm diameter). The electrodes are connected to a high input impedance (>100 G) differential amplifier using preci-sion OP amps (Analog Devices, OP07), and the potential difference is measured by the data logger.
All experiments were conducted at room temperature (23±1◦C). The readings of the electronic balance and the data logger are transferred to a computer and stored for analysis. An example of measurement data is shown in Fig. 3. The pore fluid pressure difference, potential differ-ence, and weight of outflow are shown as a function of time. We calculate averages of the pore fluid pressure difference and the potential difference at an interval of quasi-stationary
Fig. 4. The fluid flux as a function of the pore fluid pressure difference across the samples. At small pressure differences, the flux is propor-tional to the pressure difference. At large pressure differences, the flux deviates from the linear relation in the samples with the median diame-ter of 425 and 850μm. In the sample with the median diameter of 214
μm, no deviation was observed.
state. The flow rate is calculated by the least-square method at the same interval.
3.
Results
3.1 Fluid fluxThe volumetric flow rate is shown in Fig. 4 as a func-tion of the pore fluid pressure difference across the ple. A larger flux is observed for a larger bead size sam-ple. For small pore fluid pressure differences, the flux is proportional to the pressure difference. The flux-pore fluid pressure difference relation deflects from this linear rela-tion, when the pressure difference exceeds a certain value. The flux becomes lower than that expected from the lin-ear relation, and the deviation increases with the pore fluid pressure difference. The deflection begins at about 7.5 and 2 kPa for 425 and 850μm glass-bead samples, respectively. On the contrary, the deflection was not observed for 214μm the glass-bead sample.
becomes turbulent.
The contribution of the inertial resistance is characterized by the Reynolds number given by
= ρvηa,
wherea is the characteristic length of the flow (Batchelor, 1972). We use the effective pore throat radius defined by Eq. (3) as a characteristic length. For a suspension of spheres (porosity>0.4),is given by
= 2φd
9(1−φ)m
where d is the diameter of a sphere and φ the porosity (Johnsonet al., 1986). We think that the value calculated from this relation gives a good approximation, because the porosity in this study (0.35±0.01) is reasonably near to 0.4. The fluid mean velocity is calculated from the flux, the cross-sectional area, and the porosity. The deflection occurs at Reynolds number of 3.1 and 5.0 for 425 and 850
μm glass-bead samples, respectively.
The permeability of glass-bead samples is calculated from the slope of the flux - pore fluid pressure difference relation before the deflection. It is 2.0×10⁻¹¹, 1.1×10⁻¹⁰ and 3.5×10⁻¹⁰m2for 214, 425 and 850μm bead samples. The calculated permeability is almost proportional to the square of the median of diameters. This implies that the topology and geometry of pore space in three samples are quite similar (Turcotte and Schubert, 1982).
3.2 Streaming potential
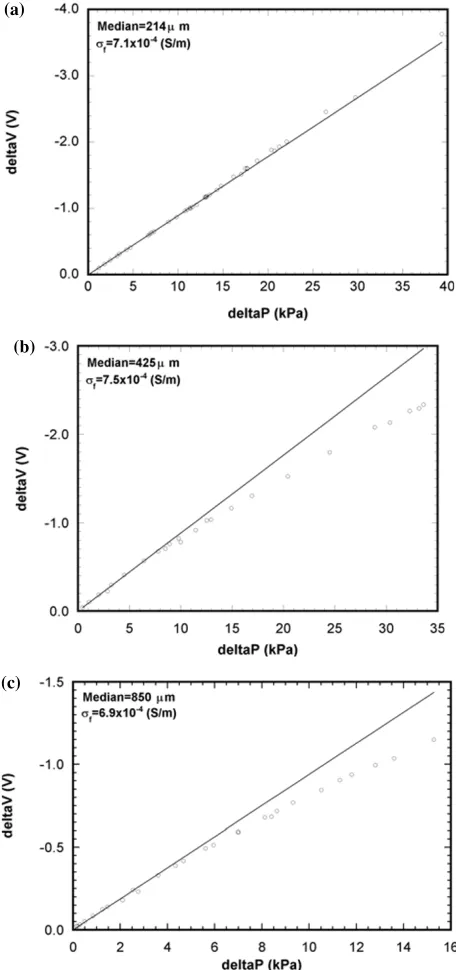
The streaming potential is shown as a function of the pore fluid pressure difference for each bead sample (Fig. 5). A line fitted at smaller pressure differences, where Darcy’s law is valid, is also shown. The least-square fitting was conducted below the pore fluid pressure difference of 10, 5, and 1.5 kPa for 214, 425, and 850 μm bead samples, respectively. As mentioned in the previous section, the flow in the 214μm sample shows no transition to the tur-bulent flow up to the pore fluid pressure difference of 39 kPa. Though the least-square fitting was done below 10 kPa, the regression line is valid to larger pressure differ-ences. The slope, which is called coupling coefficient, is calculated to be (−8.9±0.1)×10−2, (−8.8±0.5)×10−2and (−9.4±0.2)×10−2(V/kPa) for 214, 425 and 850μm bead samples, respectively.
The zeta potential is calculated to be−89±1, −93±5, and−92±2 mV for 214, 425 and 850 μm bead samples, respectively. The relative permittivity and the viscosity of the fluid are assumed to be 80 and 1×10⁻³ Pa·s. The zeta potential of high silica glass (Vycor) is−163 mV and that of bolosilicate glass (Pyrex) is−159 mV (Jednaˇcaket al., 1974). These were measured in a 10−4mol/l NaCl solution. The zeta potential tends to increase with decreasing ionic concentration, because the number of cations attracted by the negative surface charge is reduced (Ishido and Mizutani, 1981). Negative larger value (<−160 mV) is thus expected for 5×10⁻⁵ mol/l NaCl solution. The magnitude is quite large compared with our values. Their specimens are com-posed of crushed powder. Our glass bead is comcom-posed of Na-glass, and has a very smooth surface. Measured smaller
(a)
(b)
(c)
Fig. 5. The streaming potential as a function of the pore fluid pressure difference across the samples. (a) The median diameter is 214μm. The streaming potential is proportional to the pressure difference. (b) The median diameter is 425μm. The streaming potential deviates from the linear relation at the pressure difference of 10 kPa. (c) The median diameter is 850μm. The streaming potential deviates from the linear relation at the pressure difference of 5 kPa.
zeta potential may reflect the difference in glass composi-tion and surface roughness. It may also be caused by con-tamination of glass surface (Broˇz and Epstein, 1976). Sim-ilar values obtained for our three experiments confirm the similarity in the surface state of glass beads. The small dif-ference may be due to the difdif-ference in the fluid conductiv-ity (<8%).
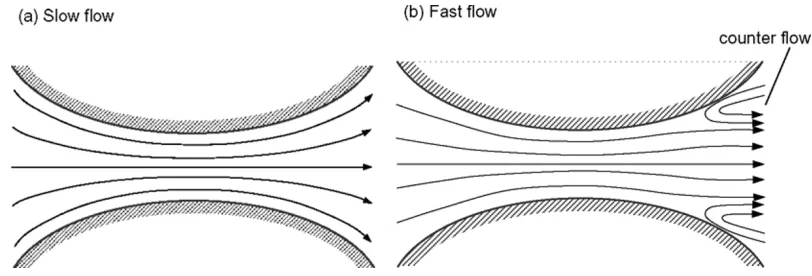
Fig. 6. Schematics showing stream lines of the fluid flow in a conduit with varying aperture. (a) The fluid flows along the solid surface, when the flow is sufficiently slow. (b) When the flow is fast enough, the boundary layer separates from the solid surface and the counter flow is induced.
for 425 and 850μm bead samples, respectively. These val-ues are significantly larger than the pressure differences at which the flux begins to deviate from Darcy’s law. The Reynolds number is 3.8 and 10, respectively. The devia-tion increases with the pore fluid pressure difference. It is 150 mV (16%) at the pore fluid pressure difference of 10 kPa for the 850μm bead sample, and 250 mV (14%) at 20 kPa for the 425μm bead sample. No significant deviation was observed for the 214 μm bead sample. In our mea-surements, the maximum Reynolds number for the 214μm bead sample was 1.4 at a pressure difference of 39 kPa.
4.
Discussion
We will discuss the mechanism of the deviation from the H-S equation. Firstly, the entrance effect is examined as a possible cause of deviation. Secondly, we examine the flow through a porous media like our packing of glass beads, and propose the separation of the boundary layer as a cause of the deviation.
Bocquetet al.(1956) made streaming potential measure-ments using a capillary tube, and concluded that the H-S equation is valid as far as the entrance effect is negligible. Our observation cannot be attributed to the entrance effect. In our measurements, the width of the fluid conduit rapidly changes at the ends of a packing of glass beads. The fluid conduit in a sample is quite tortuous. The inertia of the en-tering fluid must be greatly reduced while passing a single bead. The entrance effect might be significant only within the length of a bead diameter from the entrance. Since it is only 0.5–2% of the sample length, the entrance effect can-not give rise to a significant deviation of the streaming po-tential.
Lorneet al. (1999) suggested that a significant volume of fluid is noncirculating at high fluxes in porous media to deviate the streaming potential. Though it was a very important suggestion, the deviation mechanism was poorly specified. We will propose a deviation mechanism based on their suggestion.
Let us consider the fluid flow through a granular matrix like our glass-bead samples. The fluid conduit is tortuous and its aperture varies along the flow (Fig. 6). The fluid mechanics has studied the nature of the boundary layer in such a conduit (Batchelor, 1972). The fluid pressure within the boundary layer decreases along the flow in the shrinking
part, and the flow is accelerated. On the other hand, the fluid pressure increases in the enlarging part, and the flow is decelerated. For sufficiently slow flow, the fluid flows along the solid surface (Fig. 6(a)). When the flow is fast, the fluid inertia separates the boundary-layer flow from the solid surface in the enlarging part, and induces the counter flow (Fig. 6(b)).
The fluid in the counter flow region is separated from the circulating fluid, and ions there cannot contribute to the convection current. This results in the lower steaming potential than that without counter flows. We think that this is the deviation mechanism of the streaming potential from the H-S equation.
The Reynolds number and the curvature of a conduit are key parameters in the separation of the boundary layer. The separation occurs easily for larger fluid inertia and larger curvature. This explains that the deviation begins at a lower Reynolds number in the 425μm bead sample than in the 850 μm bead sample. The curvature of the conduit in the 425μm bead sample is twice as large as in the 850
μm bead sample. Although the curvature is large in the 214 μm bead sample, the Reynolds number is not large enough to cause the separation of the boundary layer. A larger pressure difference would cause a deviation of the streaming potential in the 214μm bead sample.
5.
Conclusion
We conducted streaming potential measurements on three glass-bead samples. The deviation of the streaming potential from the H-S equation was observed for two sam-ples with larger bead diameters. The deviation was not ob-served for the smallest bead diameter sample.
The separation of boundary layers might be a cause of the deviation of streaming potentials from the H-S equation. The separation depends on the fluid inertia and the curvature of conduits.
Acknowledgments. We are grateful to A. Revil and an anony-mous reviewer for their very helpful reviewing of this paper.
References
Batchelor, G. K.,An Introduction to Fluid Dynamics, Cambridge Univer-sity Press, 1972.
Bernab´e, Y. and A. Revil, Pore-scale heterogeneity, energy dissipation and the transport properties of rocks,Geophys. Res. Lett.,22, 1529–1532, 1995.
Bocquet, P. E., C. M. Sliepcevich, and D. F. Bohr, Effect of turbulence on the streaming potential,Ind. Eng. Chem.,48, 197–200, 1956. Broˇz, Z. and N. Epstein, Electrokinetic flow through porous media
com-posed of fine cylindrical capillaries,J. Colloid Interface Sci.,56, 605– 612, 1976.
Gu´eguen, Y. and V. Palciauskas,Introduction to the Physics of Rocks, Princeton University Press, 1994.
Hashimoto, T. and Y. Tanaka, A large self-potential anomaly on Unzen volcano, Shimabara peninsula, Kyushu island, Japan,Geophys. Res. Lett.,22, 191–194, 1995.
Ishido, T. and H. Mizutani, Experimental and theoretical basis of elec-trokinetic phenomena in rock-water systems and its applications to geo-physics,J. Geophys. Res.,86, 1763–1775, 1981.
Jednaˇcak, J., V. Paravdi´c, and W. Haller, The electrokinetic potential of glasses in aqueous electrolyte solutions,J. Colloid Interface Sci.,49, 16–23, 1974.
Johnson, D. L., J. Koplik, and L. M. Schwartz, New pore-size parameter characterizing transport in porous media,Phys. Rev. Lett.,57, 2564– 2567, 1986.
Jouniaux, L. and J.-P. Pozzi, Permeability dependence of streaming po-tential in rocks for various fluid conductivities,Geophys. Res. Lett.,22, 485–488, 1995.
Kurtz, R. J., E. Findl, Al B. Kurtz, and L. C. Stormo, Turbulent flow streaming potentials in large bore tubing,J. Colloid Interface Sci.,57, 28–39, 1976.
Landau, L. D. and E. M. Lifshitz,Fluid mechanics, 2nd edn., Pergamon Press, 1980.
Lorne, B., F. Perrier, and J.-P. Avouac, Streaming potential measurements, 1. properties of the electrical double layer from crushed rock samples,
J. Geophys. Res.,104, 17857–17877, 1999.
Revil, A., the hydroelectric problem of porous rocks: thermodynamic ap-proach and introduction of a percolation threshold,Geophys. J. Int.,151, 944–949, 2002.
Revil, A. and P. W. J. Glover, Theory of ionic-surface electrical conduction in porous media,Phys. Rev. B.,55, 1757–1773, 1997.
Revil, A. and P. W. J. Glover, Nature of surface electrical conductivity in natural sands, sandstones, and clays,Geophys. Res. Lett.,25, 691–694, 1998.
Revil, A. and P. A. Pezard, Streaming electrical potential anomaly along faults in geothermal areas,Geophys. Res. Lett.,25, 3197–3200, 1998. Revil, A., L. M. Cathles III, S. Losh, and J. A. Nunn, Electrical
conductiv-ity in shaly sands with geophysical applications,J. Geophys. Res.,103, 23925–23936, 1998.
Rutgers, A. J., M. de Smet, and G. de Myer, Influence of turbulence upon electrokinetic phenomena,Trans. Faraday Soc.,53, 393–396, 1957. Scheidegger, A. E.,The Physics of Flow through Porous Media, The
Macmillan Company, 1957.
Shaw, D. J., Introduction to Colloid and Surface Chemistry, 3rd edn., Butterworths, 1980.
Stewart, P. R. and N. Street, Streaming potential and turbulence,J. Colloid. Sci.,16, 192–194, 1961.
Tuman, V. S., Streaming potential at very high differential pressures,J. Appl. Phys.,34, 2014–2019, 1963.
Turcotte, D. L. and G. Schubert,Geodynamics-Applications of Continuum Physics to Geological Problems, John Wiley and Sons, 1982. Wong, P.-Z., Conductivity, permeability, and electrokinetics, inMethods
in the Physics of Porous Media, edited by P.-Z. Wong, Academic Press, 1999.