Abstract—The most important property of the Gene Ontology is the terms. These control vocabularies are defined to provide consistent descriptions of gene products that are shareable and computationally accessible by humans, software agent, or other machine-readable meta-data. Each term is associated with information such as definition, synonyms, database references, amino acid sequences, and relationships to other terms. This information has made the Gene Ontology broadly applied in microarray and proteomic analysis. However, the process of searching the terms is still carried out using traditional approach which is based on keyword matching. The weaknesses of this approach are: ignoring semantic relationships between terms, and highly depending on a specialist to find similar terms. Therefore, this study combines semantic similarity measure and genetic algorithm to perform a better retrieval process for searching semantically similar terms. The semantic similarity measure is used to compute similitude strength between two terms. Then, the genetic algorithm is employed to perform batch retrievals and to handle the situation of the large search space of the Gene Ontology graph. The computational results are presented to show the effectiveness of the proposed algorithm.
Keywords—Gene Ontology, Semantic similarity measure, Genetic algorithm, Ontology search
I. INTRODUCTION
HE Gene Ontology (GO) [1] is a biological ontology maintained by the GO Consortium which is located at www.geneontology.org. The project attempts to provide consistent terms to describe gene and gene products in any organism found in heterogeneous databases. GO plays an important role in searching biological information and
Manuscript received May 6, 2006. This material is based upon work supported by the Malaysian Ministry of Science, Technology, and Innovation (MOSTI) in part under Intensification of Research in Priority Areas (IRPA) grants (Project No. 04-02-06-0057-EA001 and 04-02-06-10050-EAR) and in part under Short Term Research (STR) grant (Project No. 75162).
Razib M. Othman*, 1, Hany T. Alashwal2, and Farhan Mohamed3 are with
the Faculty of Computer Science and Information System, Universiti Teknologi Malaysia, 81310 UTM Skudai, Johor, MALAYSIA (*corresponding author; phone: 607-5532358; fax: 607-5565044; e-mail: 1razib@fsksm.utm.my, 2hany@siswa.utm.my, 3farhan.mohd@gmail.com).
Safaai Deris1 and Rohayanti Hassan2 are with the School of Graduate
Studies, Universiti Teknologi Malaysia, 81310 UTM Skudai, Johor, MALAYSIA (e-mail: 1safaai@fsksm.utm.my, 2rohayanti@gmail.com).
Rosli M. Illias is with the Faculty of Chemical and Natural Resources Enginneering, Universiti Teknologi Malaysia, 81310 UTM Skudai, Johor, MALAYSIA (e-mail: r-rosli@utm.my).
annotating proteins or genomes. Some examples of GO applications include prediction of functional modules [2], microarray analysis [3], prediction of protein-protein interactions [4], and proteomics analysis [5].
The amount of available GO terms has grown enormously and become more demanded in the last few years. A total number of 628 articles are related to the GO since 1998 as shown in Fig. 1. Although tools for searching the GO terms such as AmiGO (www.godatabase.org), GenNav (mor.nlm.nih. gov/perl/gennav.pl), MGI GO Browser (www.informatics.jax. org/searches/GO_form.shtml), and QuickGO (www.ebi.ac.uk/ ego/) are publicly available, these search engines respond to user keyword queries by retrieving relevant GO terms based on word matching or Boolean rules. Thus, browsing the entire GO graph (see Section 2 for formal definition), comprising around 20 thousand terms, to find semantically similar terms is time consuming and difficult to carry out.
In response to this problem, an approach to search the GO terms is proposed that incorporates semantic similarity measure into genetic algorithm. The semantic similarity measure is used to determine the similitude strength of two terms organized in the GO graph. This semantic similarity
Incorporating Semantic Similarity Measure in
Genetic Algorithm: An Approach for Searching
the Gene Ontology Terms
Razib M. Othman, Safaai Deris, Rosli M. Illias, Hany T. Alashwal, Rohayanti Hassan, and Farhan
Mohamed
T
0 20 40 60 80 100
1998 1999 2000 2001 2002 2003 2004 2005 Year
N
o.
of
publ
ic
a
ti
ons
GO tools
use of GO in biological databases use of GO in data or text mining
publications on Open Biomedical Ontologies (OBO) GO annotations
genome annotation
Expressed Sequence Tag (EST) annotation protein annotation
use of GO in gene expression studies use of GO in proteomics studies prediction of GO annotations other applications of GO
measure (see Section 4) is a hybrid of information content and conceptual distance. The information content is computed to get the amount of information the GO terms share in common. On the other hand, the conceptual distance is calculated to know the depth and the local network density of the GO term. Then, the genetic algorithm (see Section 5) is applied to improve the search in large search space of the GO graph. It generates better solution consisting of a set of terms that best match to the given term. In order to find feasible solution that precludes many GO terms with low score, dimension index is added into the fitness function.
The combination of semantic similarity and genetic search would be helpful to the users to retrieve interrelated GO terms. Under this search technique, users’ queries will return a list of semantically similar terms that are extracted automatically, and it avoids the users from spending lots of time browsing the GO graph for those terms. Furthermore, this study will accommodate biologists and alignment tools such as BLAST (www.ncbi.nlm.nih.gov/BLAST/), CLUSTALW (www.ebi.ac. uk/clustalw/), and SIM (www.expasy.ch/tools/sim-prot.html) to reduce the processing time of discovering similar sequences. As a matter of fact, Lord et al. [6] have presented results showing the correlation between semantic similarity and sequence similarity.
The rest of the paper is organized as follows. Section II begins with the problem description of ontology search. Section III gives a review of related work on search of the GO terms, semantic similarity measure, and genetic algorithm. Section IV discusses the technical description of the semantic similarity measure. Section V describes the flow of the genetic algorithm in detail. Section VI presents experimental results and is followed by conclusion in Section VII.
II. PROBLEM DESCRIPTION
Ontology is a description of concepts in a domain and the relationships between the concepts. Ontology can be represented as a directed graph. The ontology graph comprises the concepts including the descriptions as nodes and semantic relationships as edges. Recently, there has been growing development of ontology in the bioinformatics field such as Sequence Ontology [7], Cell Ontology [8], Chemical Ontology [9], Multiple Alignment Ontology [10], Biodynamic Ontology [11], and Protein-Interactions Ontology [12]. However, the “ontology search”, which refers to the activity of retrieving concepts in the ontology graph, is not accurately performed by the traditional search engines that are based on keywords. These search engines neglect the semantic relationships between the search concepts and only consider those concepts as character strings. Thence, a mechanism to measure the similarity between concepts in the ontology graph is required to reduce dependency of specialists of a certain domain to input relevant concepts as search words.
Given a GO graph G = {V, E} that is structured as a Directed Acyclic Graph (DAG), where V is a finite non-empty set of nodes representing GO terms and E is a finite set of
pairs of nodes representing relationships between GO terms. Each pair in E is an arc of G. The GO terms can have more than one parent, as well as multiple children. The GO terms are linked by two relationships, the “is-a” relationships (“intracellular organelle”, GO:0043229 and “membrane-bound organelle”, GO:0043227 are parents of “intracellular membrane-bound organelle”, GO:0043231) and the “part-of” relationships (“chloroplast stroma”, GO:0009570 is part of “chloroplast”, GO:0009507).
Searching the GO graph to retrieve semantically similar terms is an NP-complete problem. This is due to the size of the search space of the DAG g(k). The search space is astronomical and varies between:
( 1) ( 1)
2 2
2 ( ) 3
k k k k
g k
− −
≤ ≤ (1)
where k is the number of nodes in the GO graph. To search the GO graph, the following research problems need to be figured out:
1) What is the most suitable search algorithm for finding feasible solution that offers reasonable amount of processing time to this NP-complete problem?
2) What is the precise criterion to this ontology search problem for quantifying the semantic similarity between GO terms?
In this paper, the first problem is solved by applying genetic algorithm. The genetic algorithm employs dimension index and parallel implementation as catalyst for quality of the search result. On the other hand, semantic similarity measure is added into the genetic algorithm during the creation of population and calculation of fitness value in order to respond to the second problem.
III. REVIEW OF RELATED WORK
Several GO browsers have been developed to provide text searching for the GO terms and the associated information such as definition, synonyms, lineage, cross-references, and gene products annotated to them. These browsers also have graphical view of the hierarchy of the target terms. A comprehensive overview with links to respective addresses can be accessed at www.geneontology.org/GO.tools.browsers. shtml. Among these tools are:
1) AmiGO Browser; a GO browser developed by the GO Consortium. The keyword-based search is executed either by exact or ‘contains’ match over the term accession number, name, or synonyms. This tool also allows a user to use gene product or protein sequence as search input. 2) GenNav Browser; a GO browser that uses string
matching method namely exact or approximate match that responds to a given term or gene product. GenNav is maintained by the United States National Library of Medicine.
comments. This fast web-based GO browser can be found at the website of the European Bioinformatics Institute. 4) MGI GO Browser; a GO browser developed by the
Mouse Genome Informatics that performs string matching by requiring users to enter partial term name or full term accession number.
5) EP GO Browser; a GO browser that carries out the exact or ‘contains’ match for the term accession number or name entered by the user. This browser is built into an expression profiler developed by the European Bioinformatics Institute.
6) TAIR Keyword Browser; a GO browser that uses term accession number or name as an input and then performs either ‘contains’, ‘start with’, ‘end with’, or exact match. This tool is developed by the Arabidopsis Information Resource.
Lately, a number of tools have been constructed based on the semantic similarity measure to search the GO terms. For example DynGO [13] performs the semantic retrieval over the GO terms based on the information content, and FuSSiMeG [14] compares the semantic similarity between GO terms using combination of information content and conceptual distance. However, FuSSiMeG is not capable of performing batch retrievals rather has the ability to search one term among all terms in the GO graph. Whereas DynGO has overlooked the role of conceptual distance in finding the significant GO terms.
Semantic similarity measure has been introduced in many areas related to natural language processing and information retrieval. For example, this measure has been applied in the ontology integration [15], environmental modeling [16], computational linguistics [17], and bioinformatics [18]. Semantic similarity measure has the capability to improve the precision and recall of information retrieval by discovering the correlation between concepts. This is done by computing the relatedness between concepts either by estimating the distance or the amount of information in commonality of the two concepts being compared. Most popular mechanisms used to calculate the semantic similarity between concepts are founded by [19]–[22]. The comparison in [23] shows that Jiang and Conrath’s semantic similarity [21] provides the best results, and it is used as a main reference in this study.
Genetic algorithm is a soft computing technique that has been recognized in the information retrieval field. This is due to its capability of being adaptive, robust, efficient, and a global search method that is suitable for situations where the search space is large. Furthermore, genetic algorithm optimizes its fitness function by manipulating the genetic operators to find an optimal solution. Implementations of genetic algorithm in information retrieval are normally related to web search [24]–[26] and document retrieval [27], [28]. Some review of genetic algorithm and discussion on other soft computing techniques in information retrieval can be found in [29]–[31].
IV. QUANTIFYING SIMILITUDE STRENGTH BETWEEN GENE ONTOLOGY TERMS BY SEMANTIC SIMILARITY MEASURE
A. Information Content
The information content is calculated according to “association”, a source showing information that is shared among the GO terms. The association is a table which stores annotations that basically provide a link between a gene product and a GO term with an evidence code. For example, a gene product “dynein, axonemal, heavy chain 11” (Dnahc11) is associated with several GO terms such as “determination of left/right symmetry” (GO:0007368) with an evidence code of IMP (Inferred from Mutant Phenotype), “axonemal dynein complex” (GO:0005858) with an evidence code of IDA (Inferred from Direct Assay), and “mitochondrial inner membrane” (GO:0005743) with an evidence code of RCA (inferred from Reviewed Computational Analysis). The information content of the GO term IC(v) is given by the following equation:
( ) log( ( ))
IC v = − P v (2)
where P(v) is the probability of occurrence of a GO term v in the association. This probability can be computed using maximum likelihood estimation as given below:
( ) ( ) freq v
P v N
= (3)
where N is the total number of occurrences in the association and freq(v) is the number of times that the GO term v and all its descendants occur in the association. The frequency of the GO term v is given as follows:
( )
( ) ( )
i
i v descendants v
freq v occur v
∈
=
∑
(4)
where descendants(v) is a function that returns the set of GO terms that are the descendants of the GO term v. Note that, if a GO term va is an ancestor of a GO term vb, then freq(va) ≥
freq(vb) since the GO term va subsumes the GO term vb and all
its descendants. Therefore, P(v) is larger when the GO term v
is closer to the root term v0, and IC(va) ≤IC(vb).
B. Conceptual Distance
The conceptual distance of a GO term is measured by the depth and the local network density factors. The depth is related to the distance of the GO term in the hierarchy of the GO graph. The local network density is associated with the number of children that span out from the GO term. The depth of the GO term D(v) is represented as below:
( ) 1 ( )
( )
d v D v
d v
α
⎛ + ⎞
= ⎜ ⎟
⎝ ⎠
where d(v) is the level of the GO term v in the GO graph. The
d(v) of the root term v0 is 1, and it increases as the altitude of the GO term decreases in the hierarchy. The parameter α
controls the degree of how much the depth factor contributes in (5), and α≥ 0.
The local network density of the GO term E(v) is defined as follows:
( ) (1 ) ( )
E E v
e v
β β
⎛ ⎞
=⎜ − ⎟+
⎝ ⎠
(6)
where e(v) is the number of edges that begin from the GO term v and
E
is the number of edges divided by the number of GO terms that exist in the GO graph. The parameter βcontrols the degree of how much the local network density factor contributes to (6), and 0 ≤β≤ 1.
The parameters α and β become less important when α
approaches 0 and β approaches 1, since D(v) and E(v) will approach 1 respectively. Furthermore, (5) and (6) are equivalent when α = 0 and β = 1.
C. The Hybrid Approach
The hybrid approach is derived from the notion of the conceptual distance, and by integrating the information content as a decision factor. Given a sequence of GO terms va,
…, vn representing the path from GO term va to vn with length
n. The hybrid approach calculates the semantic distance between GO terms va and vn by the following formula:
(
)
1
1 0
( , )a n n ( )i ( )i ( i ) ( )i
i
dist v v − D v E v IC v+ IC v
=
=
∑
− (7)
where dist(va, vn) is the summation of edge weights along the
shortest path that links va with vn. Thus, the semantic distance
between GO terms vm and vn is quantified as follows:
( , )m n ( , )a m ( , )a n
dist v v =dist v v +dist v v (8)
where GO term va is the closest shared ancestor of GO terms
vm and vn. Since the semantic distance is based on the
difference between the information content, the normalization of the semantic distance is given by:
( , )
( , ) min{1, }
max{ ( )}
m n
norm m n
dist v v
dist v v
IC v
= (9)
Therefore, the semantic similarity measure between GO terms vm and vn is calculated by converting the semantic
distance as follows:
( , ) 1m n norm( , )m n
SSM v v = −dist v v (10)
Note that, 0 ≤SSM(vm, vn) ≤ 1 because 0 ≤distnorm(vm, vn) ≤ 1.
V. SEARCHING THE GENE ONTOLOGY TERMS BY GENETIC ALGORITHM
The overall method for searching the GO terms is depicted in Fig. 2. In the beginning, the GO RDF/XML is partitioned Fig. 2 The method for searching the GO terms
1 2 3 4 5 6 7 8 9 10 11 12 13 14 15 16
Algorithm SSMGA (G, s);
Input: G = {V, E} (a Gene Ontology Graph) and s (a search)
Output: xt (a chromosome consisting of a set of nodes that are semantically similar to s and xt∈ P(t))
begin preprocess;
t := 0; initialize P(t); evaluate P(t);
while not termination-condition do t := t + 1;
select P(t) from P(t – 1);
alter P(t) by crossover and mutation operator; evaluate P(t);
end-while end
Fig. 3 The SSMGA algorithm
1 2 3 4 5 6 7 8 9 10 11 12 13 14 15 16 17 18
Algorithm SSM (L, s);
Input: L = {L0, L1, …, Lm-1} (a set of page clusters) and s (a search)
Output: C = {C0, C1, …, Cm-1} (a set of clusters containing sorted lists
of nodes) begin
for i := 0 to m-1 do
for j := 0 to n-1 do // where n is the number of nodes in page cluster Li
calculate the information content IC(vi
,j); // where v i∈ L
i calculate the depth D(vi
,j);
calculate the local network density E(vi ,j); calculate the semantic distance dist(s, vi
,j); calculate the semantic similarity measure SSM(s, vi
,j); wi
,j := SSM(s, v i
,j); // where w i∈ C
i end-for
sort (Ci); end-for end
Fig. 4 The preprocessing by semantic similarity measure algorithm Single GO
RDF/XML page
Clustering
Page cluster 0
Page cluster 1
Page cluster n-1
Best set of GO terms
into a set of page clusters [32]. The idea is to cluster this single monolithic web page into several page clusters in order to make it easier to be searched and maintained. The GO RDF/XML format is used rather than the mySQL format since the data can be accessed online and be processed by software agent and other machine-readable meta-data. The next steps are performed by a hybrid of semantic similarity measure and genetic algorithm (SSMGA) as shown in Fig. 3. The SSMGA is discussed in detail in the following sections.
A. Preprocessing
The first step of the SSMGA is the calculation of the semantic similarity measure between each GO term in page clusters and the user request. Detailed function is shown in Fig. 4. The main objective of introducing this preprocessing phase is to improve the quality of the chromosome. This is done by arranging the positions of nodes in the chromosome before the genetic algorithm starts. Thus, first chromosome created will contain the nodes with the highest semantic similarity score in each cluster. Then, the second chromosome will contain the second best and so on. A simple example is shown in Fig. 5. Given 4 clusters with 20 nodes and a search for node “3”. The GO term accession number is mapped to the node number according to identification in the “term” table. At first, the similarity between node “3” and all other nodes is calculated. Then, the nodes in each cluster are sorted
descendingly based on the semantic similarity score.
B. Parameter Encoding
Starting with the results obtained by the semantic similarity algorithm in previous section, the initial population is created according to the following representations:
1) Population size is the number of nodes in a cluster with maximum cardinal of nodes.
2) Chromosome length is the number of nodes in the GO graph.
3) Loci represent the node number.
4) Gene defines whether a node in the pool of nodes is represented by a chromosome or not.
5) Allele is formed by two binary elements either 0 or 1, where 1 shows presence (retrieved) and 0 shows absence (not retrieved) of a node in a chromosome.
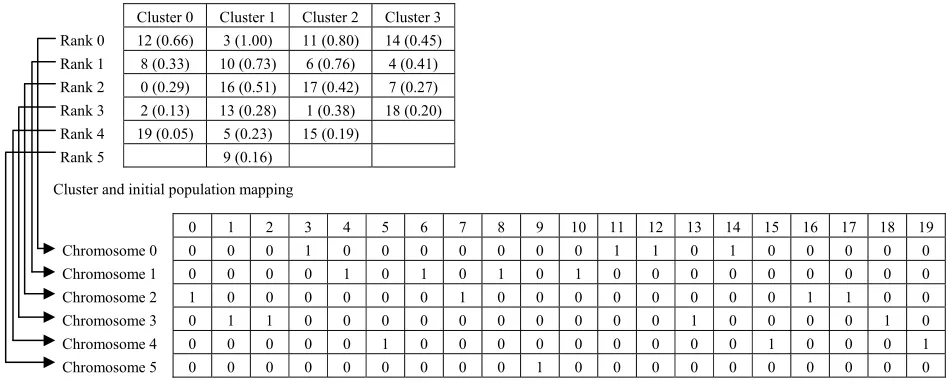
A chromosome is produced by picking a node from each cluster, starting with the ones with higher semantic similarity score. An example is shown in Fig. 6. If the cardinality of a cluster is smaller than the number of chromosomes to be created, then that cluster will not be present in each chromosome. The above representations are important to ensure that:
1) The large GO graph can be presented with a simple and direct representation.
2) The CPU time taken to converge can be reduced since the chromosome is represented using 1D binary string. 3) The genetic evolution is started with a population such
that t1(xi) ≥ t1(xj), where t1(x) is the sum of the semantic
similarity score of the nodes in a chromosome x, ∀i,j∈
{1, 2, …, ps}, ps is the size of population, and i<j.
C. Crossover and Mutation Operators
In order to maintain the algorithm as generic as possible, the genetic algorithm uses normal crossover and mutation operators. These operators are selected since they work effectively with a simple 1D binary string representation and with a fitness function based on semantic similarity measure. At each generation, the genetic algorithm applies the fitness function as criteria to measure the goodness of each chromosome of the current population to create a new set of artificial creatures (a new population). Thence, the fitness value of the best chromosome in each generation can be maximized. An example is shown in Fig. 7, where χ= 1, δ=
50, and ID= 10 (refer to (11) in Section 5.4).
The above objective is achieved by employing the crossover and mutation operators which try to improve the total fitness values of current population by manipulating the old ones. Through the crossover operator, the chromosomes reproduced in the new mating pool are mated randomly and afterward each pair of chromosomes, say xa and xb, undergoes
a cross change. Then, the mutation operator plays a secondary role to prevent an irrecoverable loss of potentially useful information which occasionally crossover can cause. This operator performs a random alteration of the allelic value of a chromosome.
Fig. 5 An example of preprocessing performed by semantic similarity measure algorithm
Step 3: Sort the nodes
Cluster 0 Cluster 1 Cluster 2 Cluster 3 Rank 0 12 (0.66) 3 (1.00) 11 (0.80) 14 (0.45) Rank 1 8 (0.33) 10 (0.73) 6 (0.76) 4 (0.41) Rank 2 0 (0.29) 16 (0.51) 17 (0.42) 7 (0.27) Rank 3 2 (0.13) 13 (0.28) 1 (0.38) 18 (0.20) Rank 4 19 (0.05) 5 (0.23) 15 (0.19)
Rank 5 9 (0.16)
Step 1: Given four clusters
Cluster 0 Cluster 1 Cluster 2 Cluster 3 0 3 1 4 2 5 6 7 8 9 11 14 12 10 15 18 19 13 17
16
Step 2: Calculate the semantic similarity measure Cluster 0 Cluster 1 Cluster 2 Cluster 3
0 (0.29) 3 (1.00) 1 (0.38) 4 (0.41) 2 (0.13) 5 (0.23) 6 (0.76) 7 (0.27) 8 (0.33) 9 (0.16) 11 (0.80) 14 (0.45) 12 (0.66) 10 (0.73) 15 (0.19) 18 (0.20) 19 (0.05) 13 (0.28) 17 (0.42)
16 (0.51)
Find best nodes that have similar function with
D. Fitness Function Computation
The fitness function for searching the GO terms focus on maximizing the preferences for semantic similarity score. The decision is inspired by the need to find a set of GO terms that perfectly match the user request. The fitness function f(x) for chromosome x is given as follows:
1 2
( ) ( ) ( )
f x =χt x +δt x (11)
where χ and δ are control parameters so that the contributions given by factors t1(x) and t2(x) are balanced. The value of the fitness function is expressed as a positive value that is higher for the best chromosome.
The fitness function is composed of two factors. The first is the sum of the semantic similarity score of the nodes in chromosome x, and is given as follows:
1( ) ( )
i
i u x
t x score u
∈
=
∑
(12)
where score(ui) is the original semantic similarity score
between the user request and nodes that are present in chromosome x. This factor considers the positive effect of having as many nodes with high semantic similarity score as possibly present in a chromosome. However, a chromosome with many nodes with low score could produce a fitness value higher than another one with a few good nodes. To avoid this phenomenon, the dimension index t2(x) for chromosome x is
introduced as follows:
2( ) ( ( ) ) 1
k t x
abs cnt x ID =
− + (13)
where k is the number of nodes in the GO graph, cnt(x) is the number of nodes present in chromosome x, and ideal dimension ID is the number of matched GO terms that are preferred to be returned to the user. Note that, 0 < t2(x) ≤ k
because if the number of nodes present in chromosome x is exactly equal to the ideal dimension, then maximum k is reached. Otherwise, it rapidly decreases when the number of nodes present in chromosome x is smaller or greater than the ideal dimension.
Fig. 6 An example of initial population formed by six chromosomes from a set of four clusters
Fig. 7 An example of best chromosome formed by mutation and crossover operators Cluster 0 Cluster 1 Cluster 2 Cluster 3
Rank 0 12 (0.66) 3 (1.00) 11 (0.80) 14 (0.45) Rank 1 8 (0.33) 10 (0.73) 6 (0.76) 4 (0.41) Rank 2 0 (0.29) 16 (0.51) 17 (0.42) 7 (0.27) Rank 3 2 (0.13) 13 (0.28) 1 (0.38) 18 (0.20) Rank 4 19 (0.05) 5 (0.23) 15 (0.19)
Rank 5 9 (0.16)
0 1 2 3 4 5 6 7 8 9 10 11 12 13 14 15 16 17 18 19
Chromosome 0 0 0 0 1 0 0 0 0 0 0 0 1 1 0 1 0 0 0 0 0
Chromosome 1 0 0 0 0 1 0 1 0 1 0 1 0 0 0 0 0 0 0 0 0
Chromosome 2 1 0 0 0 0 0 0 1 0 0 0 0 0 0 0 0 1 1 0 0
Chromosome 3 0 1 1 0 0 0 0 0 0 0 0 0 0 1 0 0 0 0 1 0
Chromosome 4 0 0 0 0 0 1 0 0 0 0 0 0 0 0 0 1 0 0 0 1
Chromosome 5 0 0 0 0 0 0 0 0 0 1 0 0 0 0 0 0 0 0 0 0
Cluster and initial population mapping
f(x) 0 1 2 3 4 5 6 7 8 9 10 11 12 13 14 15 16 17 18 19 value
Generation 0 0 0 0 1 0 0 0 0 0 0 0 1 1 0 1 0 0 0 0 0 145.77
Generation 10 0 0 0 0 1 0 1 0 1 0 1 0 0 1 0 0 0 0 1 0 202.71
Generation 20 0 0 0 0 1 0 1 0 1 0 1 0 0 1 0 0 0 0 1 0 202.71
Generation 30 0 0 0 0 1 0 1 0 1 0 1 0 0 1 0 0 0 0 1 0 202.71
Generation 40 0 0 0 0 1 1 1 1 1 0 1 0 0 1 0 0 0 0 1 0 336.54
Generation 50 0 0 0 0 1 1 1 1 1 0 1 0 0 1 0 0 0 0 1 0 336.54
Generation 60 0 0 0 1 1 1 1 1 1 0 1 0 0 1 0 0 0 0 0 0 337.34
Generation 70 0 0 0 1 1 1 1 1 1 0 1 0 0 1 0 0 0 0 0 0 337.34
Generation 80 0 0 0 1 1 1 1 1 1 0 1 0 0 1 0 0 0 0 0 0 337.34
Generation 90 0 1 0 1 1 1 1 1 0 0 1 0 1 1 0 0 0 0 0 0 504.72
E. Parallel Computation
Computational challenges of searching the GO terms are the size and complexity of the large GO graph as described in (1) at the end of Section 2. To overcome these matters, the SSMGA is executed in parallel as shown in Fig. 8. The core process of parallel SSMGA is to divide the population into equal size subpopulations. Hereafter, each subpopulation is assigned to a processor where it evolves independently. During the process, a group of best chromosomes are transferred to replace a group of worst chromosomes between subpopulations. This migration process is performed periodically at certain cycles of generations. The parameters of the frequency of exchange and the number of chromosomes to be exchanged are adjustable. The rationale for implementing the decomposition approach is as follows: 1) To reduce the execution times by decreasing the
communication overhead involved in the exchange of chromosomes between processors.
2) To improve the quality of the solutions reached by increasing population sizes without minding the time complexity.
VI. EXPERIMENTAL RESULTS
The semantic similarity measure presented in Section 4 (SSMA) has been built according to Jiang and Conrath’s approach [21]. We have tested it using GO data released in February 2006. The results are compared with other semantic similarity measures proposed by Lin (SSMB), Leacock and Chodorow (SSMC), and Resnik (SSMD) in order to investigate its capabilities. Each GO term in Table 1 is paired with “organelle inner membrane” (GO:0019866) and the values are in similarity percentage. The parameter settings for the depth and the local network density factors are: α= 0.5 and β= 0.3. As depicted in Table 1, the SSMA provides the best results. Furthermore, GO terms such as “infected host cell surface knob” (GO:0020030), “host cell nucleus” (GO:0042025), and “membrane-bound organelle” (GO:0043227) are detected by the similarity measure SSMA whereas the similarity measures introduced by Lin, Leacock and Chodorow, and Resnik, are unable to detect these terms.
The parameters of the SSMGA are shown in Table 2. The SSMGA is implemented using a low-cost PC cluster with computing power of 25 processors. The program is compiled using GNU GCC compiler under Fedora Core 5 operating system. The values of the parameters for the fitness function are χ= 1 and δ= 0.05. To test the stability of the SSMGA, the results of 5 separate runs for the best chromosome selected from the 25 subpopulations are compared as shown in Table 3 and Fig. 9. Hence, if the user makes a search for “organelle inner membrane” (GO:0019866), the time taken for the user to wait until the results are received varies from 0.08 to 0.13 seconds. The convergence occurred after 510 generations as the fastest and after 630 generations as the slowest. The range of the maximum value of fitness function is between 1,033.77 and 1,034.14.
The search results generated by the SSMGA are very attractive because it returns GO terms that do not contain keywords associated with the user request. Examples of such GO terms include “plastid” (GO:0009536), “COPII-coated vesicle” (GO:0030138), and “cell projection”(GO:0042995) for a search for “organelle inner membrane” (GO:0019866). The comparison between SSMGA with other GO browsers is shown in Fig. 10 for the top 20 search results.
The effectiveness of the SSMGA is validated using standard information retrieval measures: recall and precision. Recall and precision are given by:
100
( )
a Recall
a b =
+ (14)
100
( )
a Precision
a c =
+ (15)
where a is the number of relevant GO terms retrieved, b is the number of relevant GO terms not retrieved, and c is the number of irrelevant GO terms retrieved. As shown in Fig. 11, the average of recall is 70.35% and the average of precision is Fig. 8 The parallelization structure of the SSMGA
Create initial population
Divide population into subpopulations
Subpopulation 0
Subpopulation 1
Subpopulation n-1
Distribute subpopulations to processors
Processor
0 Processor 1 Processor n-1
Perform parallel computation
1. Create new subpopulation.
2. Alter subpopulation by crossover and mutation operators. 3. Evaluate subpopulation.
83.80%. The high recall indicates that a large number of GO terms are returned by the SSMGA from all of the GO terms in the GO graph that are relevant to the search. The high precision indicates that a large proportion of the GO terms is
relevant to the search among all of the GO terms returned by the SSMGA.
VII. CONCLUSION
In this paper, the problem of searching for semantically similar GO terms has been solved by combining semantic similarity measure with genetic algorithm. This is done by modeling the GO as a graph in order to ensure that the ontology search can be easily performed while considering the semantic relationships. The semantic similarity measure is used to quantify the similitude strength between GO terms by calculating the information content and conceptual distance among them. Then, the genetic algorithm plays its role to determine a set of GO terms from the large GO graph that have significant semantic association with the search term that the user entered. During the search process, the dimension index implemented in the algorithm prevents many GO terms with low semantic similarity score to be returned. The algorithm has also been executed in parallel to handle the astronomical size of the search space of the GO graph and to accelerate the computing time.
As compared to other GO search engines, the proposed algorithm is capable of finding GO terms that do not contain the keyword specified by the user. Furthermore, this algorithm offers the advantages: the user can search for functionally related GO terms; reduced dependency of specialists, and significant time saving. In spite of this, the experimental results show that the algorithm is effective and stable. Future work will cover the extension of the definition and testing of automatic procedures for parameter tuning in the genetic algorithm. Moreover, the search results obtained by the algorithm will be applied to protein prediction or gene expression analysis. This is achievable since GO terms are connected with amino acid sequences, and this correlation has been studied by Lord et al. [6] and Sevilla et al. [18].
ACKNOWLEDGMENT
We thank Francisco Couto for useful discussions about semantic similarity measure.
TABLE I
COMPARISON WITH OTHER SEMANTIC SIMILARITY MEASURES Term
Accession Number
Term Name SSMA SSMB SSMC SSMD
GO:0005652 nuclear lamina 5.7 4.0 3.4 2.3 GO:0005787 signal peptidase complex 5.8 4.1 3.6 2.3 GO:0009528 plastid inner membrane 16.1 7.7 6.5 4.3 GO:0009529 plastid intermembrane space 1.6 1.1 0.9 0.5
GO:0009536 plastid 9.1 5.8 2.7 0.5
GO:0016023 cytoplasmic membrane-bound vesicle 6.5 4.3 2.1 0.5 GO:0017090 meprin A complex 5.8 3.0 2.6 2.3 GO:0019815 B cell receptor complex 6.5 3.3 3.0 2.9 GO:0019866 organelle inner membrane 100.0 100.0 100.0 89.0 GO:0019867 outer membrane 7.8 7.5 6.0 4.9 GO:0020006 parasitophorous vacuolar membrane network 4.0 2.3 1.9 1.7 GO:0020007 apical complex 2.2 2.0 1.7 1.1 GO:0020016 flagellar pocket 2.2 1.9 1.0 0.5 GO:0020030 infected host cell surface knob 2.8 0.0 0.0 0.0
GO:0020031 polar ring of apical complex 1.8 1.4 1.3 1.1 GO:0030138 COPII-coated vesicle 3.9 2.8 1.4 0.5 GO:0030386 ferredoxin:thioredoxin reductase complex 1.6 1.1 0.9 0.5 GO:0031090 organelle membrane 12.4 10.1 8.6 3.0 GO:0031300 intrinsic to organelle membrane 8.8 5.5 4.8 3.0
GO:0031471 ethanolamine degradation polyhedral organelle 1.6 1.2 0.9 0.5 GO:0042025 host cell nucleus 5.1 0.0 0.0 0.0 GO:0042601 forespore (sensu Bacteria) 1.8 1.6 1.5 1.1 GO:0042995 cell projection 6.4 5.0 4.2 1.1 GO:0043227 membrane-bound organelle 12.7 0.0 0.0 0.0
GO:0043231 intracellular membrane-bound organelle 13.8 8.2 4.0 0.5
0.00 200.00 400.00 600.00 800.00 1000.00 1200.00
0 40 80
12
0
16
0
20
0
24
0
28
0
32
0
36
0
40
0
44
0
48
0
52
0
56
0
60
0
64
0
68
0
72
0
76
0
80
0
84
0
88
0
92
0
96
0
10
00
Generations
Ev
a
lu
a
ti
o
n
Run 1 Run 2 Run 3 Run 4 Run 5
Fig. 9 Evolution of 5 runs of SSMGA
TABLE 2 SSMGA PARAMETERS
Item Parameter
Size of population 500
Number of generations 1,000 Crossover probability 0.6 Mutation probability 0.05
Size of genome 20,537
Replacement percentage 0.5
Type of crossover Two-point crossover Type of mutation Swap mutation
Type of genetic algorithm Steady-state genetic algorithm
Scaling Sigma truncation scaling
Fitness function Maximizing preferences
Ideal dimension 20
Number of subpopulations 25 Size of subpopulation 20
Frequency of exchange Every 10 generations Number of chromosomes to be exchanged 4
REFERENCES
[1] M. Ashburner, C.A. Ball, J.A. Blake, D. Botstein, H. Butler, J.M. Cherry, A.P. Davis, K. Dolinski, S.S. Dwight, J.T. Eppig, M.A. Harris, D.P. Hill, L. Issel-Tarver, A. Kasarskis, S. Lewis, J.C. Matese, J.E. Richardson, M. Ringwald, G.M. Rubin, and G.. Sherlock, “Gene ontology: tool for the unification of biology,” Nat. Genet., vol. 25, no. 1, pp. 25-29, May 2000.
[2] H. Wu, Z. Su, F. Mao, V. Olman, and Y. Xu, “Prediction of functional modules based on comparative genome analysis and gene ontology application,” Nucleic Acids Res., vol. 33, no. 9, pp. 2822-2837, May 2005.
[3] J.A. Young, Q.L. Fivelman, P.L. Blair, P. de la Vega, K.G. Le Roch, Y. Zhou, D.J. Carucci, D.A. Baker, and E.A. Winzeler, “The plasmodium falciparum sexual development transcriptome: a microarray analysis using ontology-based pattern identification,” Mol. Biochem. Parasitol., vol. 143, no. 1, pp. 67-79, Sep. 2005.
[4] J. Espadaler, O. Romero-Isart, R.M. Jackson, and B. Oliva, “Prediction of protein-protein interactions using distant conservation of sequence patterns and structure relationships,” Bioinformatics, vol. 21, no. 16, pp. 3360-3368, Aug. 2005.
[5] S.M. Hauck, S. Schoeffmann, C.A. Deeg, C.J. Gloeckner, M.S. Lange, and M. Ueffing, “Proteomic analysis of the porcine interphotoreceptor matrix,” Proteomics, vol. 5, no. 14, pp. 3623-3636, Sep. 2005.
[6] P.W. Lord, R.D. Stevens, A. Brass, and C.A. Goble, “Investigating semantic similarity measures across the gene ontology: the relationship between sequence and annotation,” Bioinformatics, vol. 19, no. 10, pp. 1275-1283, Jul. 2003.
[7] K. Eilbeck, S.E. Lewis, C.J. Mungall, M. Yandell, L. Stein, R. Durbin, and M. Ashburner, “The sequence ontology: a tool for the unification of genome annotations,” Genome Biol., vol. 6, no. 5, rec. R44, Apr. 2005. [8] J. Bard, S.Y. Rhee, and M. Ashburner, “An ontology for cell types,”
Genome Biol., vol. 6, no. 2, rec. R21, Jan. 2005.
[9] H.J. Feldman, M. Dumontier, S. Ling, N. Haider, and C.W. Hogue, “CO: a chemical ontology for identification of functional groups and semantic comparison of small molecules,” FEBS Lett., vol. 579, no. 21, pp. 4685-4691, Aug. 2005.
[10] J.D. Thompson, S.R. Holbrook, K. Katoh, P. Koehl, D. Moras, E. Westhof, and O. Poch, “MAO: a multiple alignment ontology for nucleic acid and protein sequences,” Nucleic Acids Res., vol. 33, no. 13, pp. 4164-4171, Jul. 2005.
[11] P. Grenon, B. Smith, and L. Goldberg, “Biodynamic ontology: applying BFO in the biomedical domain,” Stud. Health Technol. Inform., vol. 102, pp. 20-38, Apr. 2004.
[12] E. Ratsch, J. Schultz, J. Saric, P.C. Lavin, U. Wittig, U. Reyle, and I. Rojas, “Developing a protein-interactions ontology,” Comp. Funct. Genom., vol. 4, no. 1, pp. 85-89, Feb. 2003.
[13] H. Liu, Z. Hu, and C.H. Wu, “DynGO: a tool for browsing and mining gene ontology and its associations,” BMC Bioinformatics, vol. 6, rec. 201, Aug. 2005.
[14] F. Couto, M. Silva, and P. Coutinho, “Semantic similarity over the gene ontology: family correlation and selecting disjunctive ancestors,” presented at the 14th ACM Conf. Information and Knowledge Management, Bremen, Germany, Oct. 31 - Nov. 5, 2005.
[15] M.A. Rodriguez and M.J. Egenhofer, “Determining semantic similarity among entity classes from different ontologies,” IEEE Trans. Knowledge and Data Engineering, vol. 15, no. 2, pp. 442-456, Mar. 2003.
[16] C.-C. Feng and D.M. Flewelling, “Assessment of semantic similarity between land use/land cover classification systems,” Computers, Environment, and Urban Systems, vol. 28, no. 3, pp. 229-246, May
2004.
[17] G. Vigliocco, D.P. Vinson, and S. Siri, “Semantic similarity and grammatical class in naming actions,”Cognition, vol. 94, no. 3, pp. B91-B100, Jan. 2005.
[18] J.L. Sevilla, V. Segura, A. Podhorski, E. Guruceaga, J.M. Mato, L.A. Martínez-Cruz, F.J. Corrales, and A. Rubio, “Correlation between gene expression and GO semantic similarity,” IEEE/ACM Trans. Computational Biology and Bioinformatics, vol. 2, no. 4, pp. 330-338, Oct-Dec 2005.
[19] C. Leacock and M. Chodorow, “Combining local context and WordNet similarity for word sense identification,” in WordNet: An Electronic Lexical Database, C. Fellbaum, Ed. Cambridge: MIT Press, 1998, pp. 265-283.
[20] D. Lin, “An information-theoretic definition of similarity,” in Proc. 15th Int. Conf. Machine Learning, Madison, WI, 1998, pp. 296-304. [21] J.J. Jiang and D.W. Conrath, “Semantic similarity based on corpus
statistics and lexical taxonomy,” in Proc. 1998 Int. Conf. Research in Computational Linguistics, Taipei, Taiwan, 1998, pp. 19-33.
[22] P. Resnik, “Using information content to evaluate semantic similarity in a taxonomy,” in Proc. 14th Int. Joint Conf. Artificial Intelligence, Montreal, Canada, 1995, pp. 448-453.
[23] A. Budanitsky and G. Hirst, “Semantic distance in WordNet: an experimental, application-oriented evaluation of five measures,” presented at the 2nd Meeting North American Chapter of the Association for Computational Linguistics, Pittsburgh, PA, Jun. 2-7, 2001.
[24] L. Chen, C. Luh, and C. Jou, “Generating page clippings from web search results using a dynamically terminated genetic algorithm,” Information Systems, vol. 30, no. 4, pp. 299-316, Jun. 2005.
[25] M. Caramia, G. Felici, and A. Pezzoli, “Improving search results with data mining in a thematic search engine,” Computers & Operations Research, vol. 31, no. 14, pp. 2387-2404, Dec. 2004.
[26] Z.Z. Nick and P. Themis, “Web search using a genetic algorithm,” Internet Computing, vol. 5, no. 2, pp. 18-26, Mar. 2001.
[27] L. Tamine, C. Chrisment, and M. Boughanem, “Multiple query evaluation based on an enhanced genetic algorithm,” Information Processing & Management, vol. 39, no. 2, pp. 215-231, Mar. 2003. [28] J. Horng and C. Yeh, “Applying genetic algorithms to query TABLE 3
RESULTS OF 5RUNS OF SSMGA
Item Run 1 Run 2 Run 3 Run 4 Run 5 Processing time
(seconds) 0.08 0.10 0.10 0.12 0.13
Number of generations to converge
510 560 580 620 630
Maximum value of
fitness function 1,033.94 1,033.77 1,034.14 1,034.06 1,033.98
0 5 10 15 20 25
Exact Match Approximate Match
Semantic Similarity Match
Match Types
N
o
.
o
f
GO
t
e
rm
s
re
tu
rn
e
d
SSMGA
AmiGO
GenNav
QuickGO
MGI GO Browser
EP GO Browser
TAIR Keyword Browser
Fig. 10 Comparison with other GO browsers
0 10 20 30 40 50 60 70 80 90 100
S1 S2 S3 S4 S5 S6 S7 S8 S9
S1
0
S1
1
S1
2
S1
3
S1
4
S1
5
S1
6
S1
7
S1
8
S1
9
S2
0
Search
Recall
Precision
optimization in document retrieval,” Information Processing & Management, vol. 36, no. 5, pp. 737-759, Sep. 2000.
[29] I. Kushchu, “Web-based evolutionary and adaptive information retrieval,” IEEE Trans. Evolutionary Computation, vol. 9, no. 2, pp. 117-125, Apr. 2005.
[30] S.K. Pal, V. Talwar, and P. Mitra, “Web mining in soft computing framework: relevance, state of the art and future directions,” IEEE Trans. Neural Networks, vol. 13, no. 5, pp. 1163-1177, Sep. 2002. [31] H. Chen, “Machine learning for information retrieval: neural networks,
symbolic learning, and genetic algorithms,” J. American Society for Information Science, vol. 46, no. 3, pp. 194-216, Apr. 1995.
[32] R.M. Othman, S. Deris, R.M. Illias, Z. Zakaria, and S.M. Mohamad, “Automatic clustering of gene ontology by genetic algorithm,” Int. J. Information Technology, vol. 3, no. 1, pp. 37-46, Apr. 2006.
Razib M. Othman is a doctoral candidate at the Faculty of Computer Science and Information System, the Universiti Teknologi Malaysia. He received the BSc and MSc degrees in Computer Science both from the Universiti Teknologi Malaysia, in 1999 and 2003 respectively. Currently, he is working for his PhD in Computational Biology. He also has interests in artificial intelligence, software agent, parallel computing, and web semantics. In March 2005, he was awarded the Young Researcher award by the Malaysian Association of Research Scientists (MARS). Two of his inventions, software products named 2D Engineering Drawing Extractor and 2D Design Structure Recognizer, have won 5 awards at the 21st Invention and New Product Exposition held in Pittsburgh, USA including the Best Invention of the Pacific Rim, and a gold medal award at the 34th International Exhibition of Inventions of New Techniques and Products held in Geneva, Switzerland.
Safaai Deris is a Professor of Artificial Intelligence and Software
Engineering at the Faculty of Computer Science and Information Systems, Deputy Dean at the School of Graduate Studies, and Director of Laboratory of Artificial Intelligence and Bioinformatics at the Universiti Teknologi Malaysia. He received the MEng degree in Industrial Engineering, and the DEng degree in Computer and System Sciences, both from the Osaka Prefecture University, Japan, in 1989 and 1997 respectively. His recent academic interests include the application and development of intelligent techniques in planning, scheduling, and bioinformatics.
Rosli M. Illias is an Associate Professor at the Faculty of Chemical and Natural Resources Engineering at the Universiti Teknologi Malaysia. He received the PhD degree in Molecular Biology from the Edinburgh University, UK in 1997, and the BSc degree in Microbiology from the Universiti Kebangsaan Malaysia in 1992. His research interests are in the areas of microbial technology, molecular enzymology, and molecular genetics.
Hany T. Alashwal is a doctoral candidate at the Faculty of Computer Science and Information Systems, the Universiti Teknologi Malaysia. He received the MSc degree in Computer Science from the Universiti Teknologi Malaysia in 2003 and the BSc degree in Mathematics and Computer Science from the Cairo University, Egypt in 1998. His research interests include bioinformatics, prediction of protein-protein interactions based on protein sequence features, and computational methods such as support vector machines, genetic algorithms, and software agent.
Rohayanti Hassan is a researcher at the School of Graduate Studies, the Universiti Teknologi Malaysia. She is also a part time tutor at the Open University Malaysia. She received the MSc and BSc degrees in Computer Science both from the Universiti Teknologi Malaysia in 2006 and 2003 respectively. Her expertise includes statistical analysis, virtual environment, virtual reality, path planning, and computational methods such as A* algorithm, Prim’s algorithm, and Greedy algorithm.
Farhan Mohamed is an MSc candidate at the Faculty of Computer Science and Information Systems, the Universiti Teknologi Malaysia. He received the BSc degree in Computer Science from the Universiti Teknologi Malaysia in 2003. He was awarded the Excellent Student award by the Universiti Teknologi Malaysia in 2003. Currently he is working on Online Performance Optimization for his MSc study. His research interests include system analysis and performance, bio-inspired computing, artificial intelligence, simulation,