IEEE Transactions on Power Systems, Vol. 12, No. 3, August 1997
Application
of
Fuzzy Logic Technology for Spatial
Load
Forecasting
MO-yuen Chow
Hahn Tram
IEEE Senior Member
Dept. of Electrical and Computer Engineering North Carolina State University
Raleigh, NC 27695-791 1
IEEE Senior Member
Systems Control - Distribution Automation ABB Power T&D Company Inc.
Cary, NC 275 11
Abstract
Utilities are required to provide reliable power to customers. In the design stages, utilities need to plan
ahead
for anticipated future load growth under different possible scenarios. Their decisions and designs can affect the gam or loss of millions of dollars for their companies as well as customer satisfaction and future economic growth in their territory. This paper proposes and describe the general methodology to use fuzzy logic to fuse the available information for spatial load forecasting. The proposed scheme can provide distribution planners other alternatives to aggregate their information for spatial load forecasting.Keywords
: Spatial load forecasting, land-usage, urban re development, fuzzy logic, information technology1.
Introduction
Utilities are required to provide reliable power to customers. However, utilities do not want to overbuild their system because they need to bear the unnecessary cost. In ideal situations, utilities will build a reliable power system with just enough capacity (with proper reliability margins) to support their customers. Distribution systems are the retail part of utilities that supply power to their customers. Distribution systems cover large geographic areas with substantial construction and operation costs. Proper infmnation gathering, decision making, planning and design are all important towards a more cost-effective and reliable distribution system. In the design stages, utilities need to plan ahead for anticipated future load growth under different possible scenarios. They need to decide whether to built new lines and substations, or to upgrade the existing systems. Their decisions and designs can affect the gain or loss of millions of dollars for their companies as well as customer satisfaction and future economic growth in their territory. Therefore, utilities are very concerned about distribution planning. They would like to use as many tools as possible to help them achieve the best planning so that money, time, and human resources can be used effectively and efficiently.
This paper was presented at the 1996 IEEE Transmission and Distribution Conference held in Los Angeles, California, September 15-20, 1996.
Different approaches, such as spatial load forecasting based on land usage and end-user load modeling, have been used to improve the performance of distribution load forecasting [l-31. Land usage-based spatial load forecasting is based on objective geographic information and people’s preferences to predict how the land will be used - will it be a residential site, commercial site, or industrial site in the future? Each land usage is assumed to have a certain load growth characteristics [4].
The land usage-based spatial load forecasting computer simulation has been used to aggregate appropriate geographic information to simulate future load growth based on different anticipated scenarios [3]. Spatial load forecasting techtuques have been shown to provide superior results compared to other distribution load forecasting techniques such as regression analysis of historical distribution load data [2]. The increasingly popular, accurate, and affordable Geographic Informahon Systems (GIS) technology provides an excellent data base platform for spatial load forecasting techniques [5].
The use of GIS can help the utilities save thousands of man hours that are spent on collecting relevant geographic data. Thus spatial load forecasting becomes even more attractive than before due to affordable costs and superior load forecasting accuracy.
There
are
a few stages for spatial load forecasting. The process, as shown in Figure 1, involves : (1) gathering appropriate spatial information, ( 2 ) deciding what the land usage will be based on the collected information, and (3) predicting the future load growth. The land usage and load growth are then calibrated based on different Constraints imposed on the areas [5]. The constraints include system load growth, budget available, future economy growth of the area, etc.Fig. 1. Schematic diagram for land usage-based spatial load forecasting.
In the present era of information technology, we can access much more information than a few years ago. Availability of h g h resolution and more variety of GIS data, improved computer speed and reduction in cost are all helpful to provide better accuracy in distribution load forecasting. However, we also face the information explosion problem,
2. How to aggregate the available informatior for
In this paper, two popular fuzzy logic techniques are used to answer the issues posted. Membership functions will be use to convert the linguistic descriptions of the problem into membership values, which are appropriate
for
computer implementation. Centroid rule, which is the popular method to perform defuzzification in the fuzzy control area [7-81, will be used to aggregate input information and fuzzy rules into preference values for each alternative for final decision making. The overall decision process is shown in Figure. 2.decision making? in which we have so much information that humans alone
cannot handle the huge amount of data wlthout help from other appropriate technologies. Different technologies such as fuzzy logic, neural networks, distributed data base have been developed to manage the large amount of data available
and
to best utilizethe
information proviidedin
the data.In
general, the better we utilize relevant information, the better results will be. One of the immediate challenges is what type of technology is suitable for us to appropriately process the information to improve our applications.As shown in Figure 1, land usage decision making is an important part for spatial distribution load forecasting. Conventional linear weighting on feature maps have been used in the spatial load forecasting programs to infer land usage decision [3].
Heuristic, intuition, expert knowledge, experience,
and
linguistic descriptions are often used by engineers in distribution planning. For example, industrial sites prefer to be very close to highways. Land usage-based spatial load forecasting simulation programs are basically a tool to provide information to users to help them make decisions for different scenarios. Most of the linguistic description such asclose and prefer are
fuzzy
in nature. The conventional feature map approach does not capture linguistic and heuristic knowledge in an effective manner.The increasing popular fuzzy logic technology has achieved impressive achievements in engineering applications such as decision and control [6-81. The basic nature of spatial load forecasting fits well into a fuzzy logic application that includes using membership functions, fuzzy
rules, fuzzification and defuzzification processes.
This paper proposes and describe the general methodology to use fuzzy logic to fuse the available information for spatial load forecasting. Since the accuracy of spatial load forecasting depends on many different factors such the inference engine techque used and the quality of human calibration process [3], it will be difficult to demonstrate the quantitative results from the fuzzy information gathering. The approach will be discussed in terms of ease of heuristic implementation and feature resolution. The proposed scheme can provide distribution planners other alternatives to aggregate their information for spatial load forecasting.
2.
Fuzzy Logic Formulation in Spatial
Load Forecasting Land Usage Inference
In order to use fuzzy logic technologies to solve the problem, there are a few major issues that need to be
addressed:
How to implement linguistic descriptions of the land usage selection and load forecasting in a computer program for decision automation?
1.
~~~1
preference value*process inputs membershi information
functions) aggregation
U centroid rule
Fig. 2. Schematic diagram of using fuzzy logic technology in the land usage-based spatial load forecasting problem.
The fuzzy logic technology is a field rich of theories
and
operations [8-91. This section will briefly describe the techniques in fuzzy logic, including membership functions, fuzzy rules, fuzzification, and defuzzification techniques in order to facilitate our future discussions. For more detailed information about fuzzy logic, please see references [8-91.2.1.
F u m Sets/Membership Functions
and
Fuuijication
Linguistic terms used in our daily conversation can be easily captured by fuzzy sets for computer implementations. A fuzzy set is a set containing elements that have varying degrees of membership in the set. Elements of a fuzzy set are mapped to a universe of membership values using a function-theoretic form called a membership function. Fuzzy sets and membership functions are often used interchangeably. There are different ways to derive membership functions. Subjective judgment, intuition
and
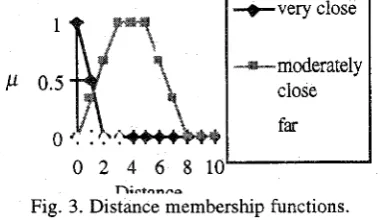
expert knowledge are commonly used in constructing membershp functions.Linguistic terms such as Close and Far are often used to describe distances. The distance from the highway is an important factor for many buyers to determine whether the site is suitable as a residential, commercial, or industrial site. Since the descriptions of many linguistic terms are relative, we need to define the range that the membership functions of the linguistic variable are to cover. The range is termed the
universe of discourse of the membership function. The membership values of each functions are usually normalized between 0 and 1, where 0 indicates non-member and 1 indicates full member of the membership function, respectively. Figure 3 shows the membership functions of three linguistic variables : Very Close, Moderately Close,
1362
example, 0 and 9 miles cannot be considered as moderately close because they both have 0 membership values in the
moderately close membership function. 4 miles is really moderately close because its has full membership value for being moderately close. 2 miles has 0.66 membership value of being moderately close, and it is considered as more or less (more toward more) moderately close.
-+-very close
moderately close
far
0 2 4 6 8 1 0
n;..trrnno
Fig. 3. Distance membership functions.
Linguistic terms such as Strongly Against and Moderate Prefer are commonly used linguistic expressions in decision making processes. Assume that the level of preference is linearly mapped to [0,1], where 0 indicates absolutely against
and 1 indicates absolutely prefer, then the corresponding universe of discourse is [0,1]. Fig. 4 shows five membershp functions that describe the Werent preferences : strongly against, moderately against, neutral, moderately prefer, strongly prefer. Again, the preference membership functions are normalized between [0,1]. A 0.2 preference value cannot be considered as moderately prefer (MP) because the corresponding membership value is 0. However, a 0.2 preference value can be considered moderately against because its has membership value 1 for the moderately against (MA)
membership function.
1 0.8
0.6
’
0.4 0.20
0 0.2 0.4 0.6 0.8 1 Preference
Figure 4. Preference membership functions.
Even though the choices of membership functions are subjective, there are some rules of thumb for membership function selection that can produce good results [91. In general, we would like to choose the membership functions which overlap with other neighboring membership functions by 25-30 %. In addition, we would like to select sensible membership values.
2.2. Fuzqy
Rules
Heuristic and expert knowledge are often expressed linguistically in the form of IF-THEN rules. These rules can be extracted from common sense, intuitive knowledge, survey results, general principles and laws, and other means that reflect real-world situations. For example, the average home buyer generally prefers to buy a house that is close to highways for the convenience of commuting, yet not too close to highways in order to avoid the noises and air pollution generated by the traffic of the highways. The rules for selecting residential sites with respect to distance to highway can then be
described
by the linguistic variablesvery close, moderately close, far, strongly against, moderately against, neutral, moderately prefer, strongly prefer
as :
1. If the distance is very close to the highway, then
strongly against.
2. If the distance is moderately close to the highway, then
strongly prefer.
3. If the distance is far from the highway, then
moderately against.
2.3.
Fuuification, Inference, and Defuuification
Method
After describing the problem in linguistic terms using membership functions and fuzzy rules, we can use fuzzy logic operations to compute and infer decisions. However, the actual measurement, such as 5 miles from the highway, in the physical world are usually in quantitative units rather than in linguistic form. We need to convert the 5 miles into linguistic terms such as very close in order to use the fuzzy inference techniques. The process to convert the actual numerical value (crisp) to its membershp value (fuzzy) through membership functions is usually called the
fuzzification process. For example, based on the membership functions in Figure 3, if the measured distance is 5 miles,
then we will say that the distance has 0 membership value for very close and cannot be considered very close at all. The distance has membership value 1 for moderately close,
therefore, the distance is really moderately close. The distance has 0.5 membership value forfar, therefore we can kind of consider the distance far, but not quire. These membership values will later be used in the fuzzy rule inference process.
After the fuzzy inference process, the results will be in membership units. There may be situations where the output of a fuzzy process needs to be a single scalar quanbty as opposed to a fuzzy set. For example, the fuzzy rule inference based on different fuzzy rules may result in 0.7 strongly prger, 0.5 moderate against, and 0.2 strongly against. We only want to know whether we should accept or reject the decision, which is a crisp decision. Therefore, a
back to the actual crisp output value for the final decision making. Many different defuzzification methods have been proposed and used [8]. The Centroid Rule is one of the most popular defuzzification techniques and will be the one used in this paper.
The centroid rule approach can compromise andor resolve the conflicts or inconsistencies of the different preferences of decision making. Therefore, the decision is not only based on some specific points of the membership curves but on the entire membership functions under consideration. Let the output described by membership function p ( p )
.
The crispvalue p* representing the membership function can be described by the centroid method shown in Eqn.
(4).
a
C
so
9 (4)
P ( P )
'dPP =
where
J'
denotes an algebraic integration.Eqn. (4) has been used to compute the center of gravity of a volume mass in different engineering areas. The center of gravity is then used as a point mass to represent the volume mass in mechanical system calculation for simplicity and is often
a
good approximation. Similarly, p* isused as
the crisp output representing the membership function ~ ( p ) .The centroid method is the most prevalent and physically appealing of all the defuzzification methods.
3.
Fuzzy
Logic
Technology
Incorporation
for
Spatial
Load
Forecasting Land Usage Selection
This section presents a land usagebased spatial load forecasting prototype demonstration of using the fuzzy logic decision making scheme for land usage determination, which predicts the future spatial load growth.
We will consider a lox 10 land grid sites assuming all environmental conditions are the same except for (1) : the distance to the highway, which i s currently under construction, and (2) : distance to the urban pole center [ 111, which is assumed constant. There are three alternatives for land usage : {residential, commercial, industrial).
0.6 if a
<
S -0.6 if a 2 SOifS <c
20 if S 2 c
10 0.5
0.4 if a c S
4 4 if a 2 S O i f S < c 15 if
S
2 c7.5 0.5
{
a 7 5 i f a < S
0.75 if a 2 S O i f S c c 1 0 i f S 2 c
5 0.5
{
I
"
The criteria of the land usage selection are :
The land should be used in oder to produce its maximum land value.
For land conversions to occur, profits from changing the land from one class to another should cover the costs. The inputs for the decision making process are :
The distance of the site to the highway, Oh.
The distance of the site to the urban pole, D ,
.
The distance to highway and distance to urban pole are described by linguistic variables : very close
(0,
moderately close(0,
and far (F). The land preferences are described by linguistic variables : strongly against (SA), moderately against ( M A ) , neutral(NT),
moderately prefer(MP),
and
strongly prefer (SP). The membership functions representing these variables have been shown in Figures 3 and 4 respectively.
Since the grid size under consideration is
lox
10, the universe of discourse of the input variable is [0, 101. The preference values are normalized between [0, 11, in which 1 indicates completely prefer and 0 indicates completely against.Different loads have their own characteristics and end-user patterns. Reasonable approximations and simplifications have been studied on both load growth and end-user patterns [4,10]. These techniques have been used in several power areas such load modeling and characterization, and
demand
side load management.In this paper, each land use has its own end-user load growth pattern and is described by state-space description in the form of :
s
= aS+
b , (5)with the appropriate units. The parameters for different land usage used in this paper are listed in Table 1.
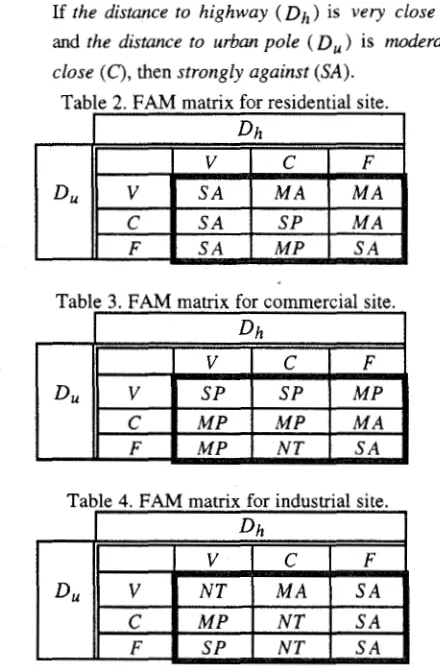
with respect to the linguistic description of the two inputs for residential, commercial, and industrial sites respectively. For example, the first column, second row of the matrix in Table 2 represent the rule :
If the distance to highway ( D h ) is very close (v) and the distance to urban pole (0,) is moderately close (C), then strongly against (SA).
Table 3. FAM matrix for commercial site.
Dh
Table 4. FAM matrix for industrial site.
The set up of the FAM rules are generally subjective to the users’ preferences, or obtained from surveys of relevant people. For example, residential sites do not want to be too close to highways in order to avoid noises and pollution generated from the hlghway, regardless of the closeness of the site from the urban pole. Therefore, the preference of the column under Very Close (V) of The Disrmce to Highway Dh of residential site axe all strongly against (SA).
Residential sites in general prefer to be moderately close
(0
to the highway, which provides convenience for commuting but is not affected heavily by the highway noises and pollution. However, residents may not want to be too close to the urban pole, Therefore, this preference value is moderately against ( M A ) . If the site is moderatety close to highway and also moderately close to the urban pole, which allows access to the urban pole conveniences such as shopping without too much driving, then the preference value is strongly prefer (SP). Similarly, the FAM tables can be filled easilv with the heuristic and Iinguistic insight of the
4.
Results Obtained from Centroi
Approach
Figures 5, 6 , and 7 show the preference values for residential (& ), commercial ( p c ), and industrial site ( P I )
with respect to distance from highway ( D h ) and distance to urban pole ( D , ) , computed from the FAM rules described by Tables 2-4 and based centroid rule described in Eqn.
(4).
8
Du
Dh
Fig. 5. Residential site preference value ( P,. ) with respect to Dist. to Highway ( D h ) and Dist. to Urban Pole ( D,).
Dh
Fig. 6. Commercial site preference value (
4 )
with respect to Dist. to Highway ( D h ) and Dist. to Urban Pole (0,).Dh
Fig. 7. Industrial site preference value ( P i ) with respect to
problem.
-
-
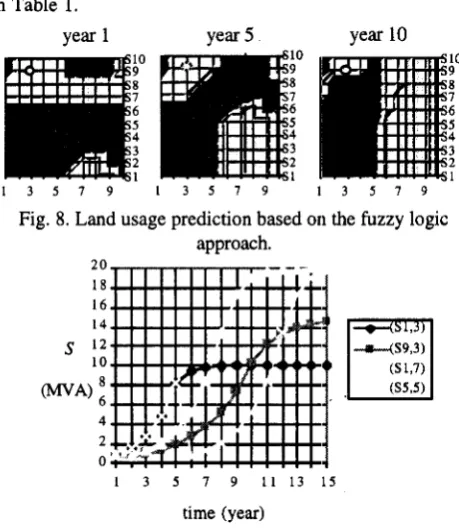
Figure 8 shows the land use for next ten year projection based on the fuzzy logic approach. Figure 9 shows the corresponding load growth for sites ( 1 3 , (9,3), (1,7), and
( 5 3 ) respectively according to Eqn. ( 5 ) and parameters listed in Table 1.
year 1 year 5 year 10
. . . .
_”.
. . .1 3 5 7 9 I 3 5 7 9 1 3 5 7 9
Fig. 8. Land usage prediction based 011 the fuzzy logic approach.
S
W A
20 1 8 16 14 12 10
3
;
4 2 0
1 3 5 7 9 1 1 1 3 1 5
time (year)
Fig. 9. Load growth of different site based on the feature map decision inference
5.
Discussion
The fuzzy rule approach is designed to closely describe to input-output relationship of the actual problem by using linguistic terms. The relationship can have significant interactions and nonlinearities. In the fuzzy logic approach,
distance is described by three membership functions,
and
preference is described by five membership functions. Their relationship is .systematically described by the fuzzy rule (FAM table in our case).
Fuzzy logic membership functions and fuzzy rules are designed to provide a simple technique to directly implement experience and intuition into a computer program. The membership functions and fuzzy rules in the fuzzy logic formulation provides an intuitive and straightforward manner to include heuristics into the spatial load forecasting land selection criteria. Less mistakes can be m<ade.
In the fuzzy logic approach, the preference calculation is based on the entire profile of the membership functions rather than base on point values. This approach is much closer to people’s decision makmg prowss in real life that we consider the preference around the environments before making final decision.
Fuzzy logic information fusion separates the information fusion step into memberslup functions and fuzzy rules. Three linguistic variables have been used to describe distance and five linguistic variables have been used to describe
preference. In order to further increase the performance resolution of the fuzzy logic approach, more linguistic variables can be introduced. Note that the increase in linguistic variables used will also increase the dimension
and
complexity of the problem.
6.
Conclusion
Tlus paper has proposed and described the general methodology to use fuzzy logic to fuse the available information for spzitial distribution load forecasting. The approach has been discussed in terms of ease of heuristic implementation and feature resolution. The proposed scheme can provide distribution planners other alternatives to aggregate their information for spatial load forecasting. Reference
[l] H. Lee Willis, Hahn Tram, “Distribution Load Forecasting,” JEEE Tutorial on Power Distribution
[2] H. Lee Willis, J.E.D. Northcote-Green, “Comparison Tests of Fourteen Distribution Load Forecasting Methods,” IEEE Transactions on Power Apparatus md Systems, Vol. PAS-103, No. 6 , June 1984, pp. 1190-
1197.
[3] H. Lee Willis, Michael V. Engd, Michael J. Buri, “Spatial Load Forecasting,” IEEE Computer Applications in Power, April 1995, pp.40-43.
[4] H.L. Willis, R.W. Powell, H.N. Tram, “Computerized Methods for Analysis of Impact of Demand Side Management on Distribution Systems,” IEEE Transactions on Power Delivery, October 1987, p. 1236. [5] Understanding GIs, ESRI, 1992.
[6] Mo-yuen Chow, Fuzzy Systems, CRC Press Industrial Electronics Handbook, 1996.
[7] Robert N. Sharpe, Mo-yuen Chow, Steve Briggs, and Larry Windingland, “A Methodology Using Fuzzy Logic to Optimize Feedforward Artificial Neural Network Configurations,“ IEEE Transactions on Systems, Man,
and Cybernetics, vol. 24, no.5, pp. 760-768, May, 1994..
[8] Timothy J. Ross, Fuzzv Logic with En- Applications, McGraw Hill, 1995.
[9]
B.
Kosko, Neural Networks and Fuzzy Systems: A Dynamical Systems Approach to Machine Intelligence, Prentice Hall, 1992.w ,
EH0361-6-PWR, 1992.[10]H. Lee Willis, Gary B. Rackliffe, Introduction to Intemated Resource T&D Planning, ABB Power T&D CO, 1994.
[ l l ] H.L. Willis, T.W. Parks, “Fast Algorithms for Small Area Electric Load Forecasting,” IEEE Transactions on PowerApparatus and Systems, Vol. PAS-102, No. 10, October, 1983.
MO-yuen Chow earned his B.S. degree at the University of Wisconsin-Madison (1982); M. Eng. degree (1983) and Ph.D. degrees at Cornel1 University (1987), all in Electrical Engineering. Upon completion of his Ph.D., Dr. Chow joined the faculty of North Carolina State University in Raleigh, NC, where he is presently an Associate Professor in the Department of Electrical and Computer Engineering. Dr. Chow has also worked as a consultant for Taiwan Power Company, J.W. Harley Company, and as a faculty intern at Duke Power Company.
Since 1987, Dr. Chow has been working as a Principal Investigator in several projects in the areas of system monitoring, fault detection and control, applications of artificial neural network and fuzzy logic to power engineering. Dr. Chow served as a guest editor of IEEE Transactions on Industrial Electronics Special Issue on Application of Intelligent Systems to Industrial Electronics. He is currently an Associate Editor of the IEEE Transactions on Industrial Electronics. He is also listed in Who‘s Who in
Asian Americans.