The Effect of Using Visual Graphics via Interactive
Multimedia on Learning of Mathematics (Straight Line) At
Secondary School
Ahmad Rizal Madar¹ & Yahya Buntat²
¹Faculty of Technical Education, Universiti Tun Hussein Onn Malaysia 86400 Batu Pahat, Malaysia ²
Fakulti Pendidikan, Universiti Teknologi Malaysia 81310 Johor, Malaysia
ABSTRACT: The purpose of this study was to investigate the effect of using visual graphics via interactive multimedia on the learning of mathematics (Straight Line) at secondary school level. This study used pre and post test with an experimental and control group research design. The samples were in two groups form 4 students from Sekolah Menengah Vocational Bukit Pelindung, Kuantan, Pahang. The samples consist of 31 students for the experimental group and 31 students from the control group. The research instruments were an achievement test, a questionnaire and an observation schedule. The findings indicated that; visual graphics via interactive multimedia enhance students straight line test; visual graphics via interactive multimedia increased 2 way interaction between teacher and student as well as student and student with respect to visual graphic elements, color was identified by students as the most important element in helping them to learn straight line. It was concluded that interactive multimedia could enhance the effectiveness of teaching and learning in mathematics.
Keywords: Visual Graphics, Interactive Multimedia, Straight Line, Two-Way Interaction, User Friendly, Conventional Method
1.0 INTRODUCTION
indicated four dominant components that lowered students’ Mathematics capability are: students themselves; teachers; schools; and families. An interactive Visual Graphics will effective bring out a positive delivering mode to students (Baharudin, A. 2005). It will increase students’ interest to learn, conscious to continue improving themselves, and pay more attention and concentration in class (Tengku Zawawi, T.Z. 2008). Visual Graphics especially effective for subject Mathematics (Alfinio, F. 2007).
2.0 LITERATURE REVIEW
2.1 Conduit of Multimedia Learning
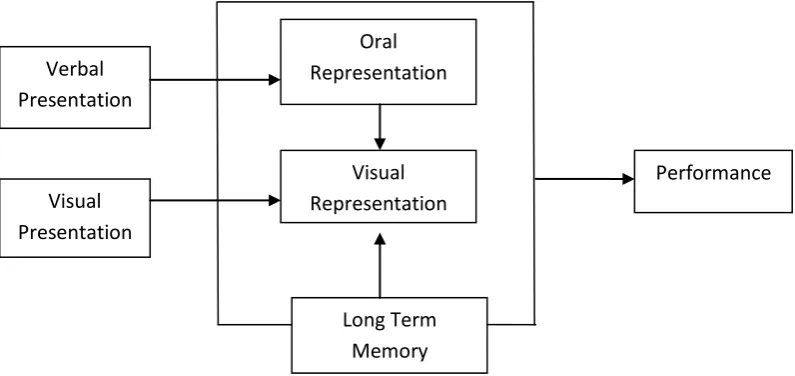
As shown in figure 1 below, there are two different conduits in human cognitive system to control and manipulate knowledge that is: Visualize-Image and Verbalize-Voice Communication. Mayer, R.E. & Sims, V.K. (1994) proposed a combination of images and speeches that will prolong length of knowledge memorization and hence improve a person’s performance. Mayer, R.E. (1994) believed it will especially effective on those student that posed outdated knowledge or low academic performance because multimedia is able to link new academic knowledge with those previously learned. In contrast, it showed less effect on high academic performance students as they have sufficient sources to master new academic knowledge in help with knowledge they learned before.
Figure 1: Dual Channel Multimedia Learning Model (source: Mayers & Sims, 1994)
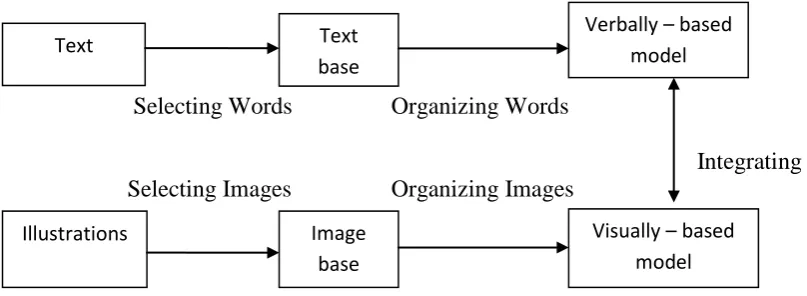
Figure 2 explained Mayer’s Generative Theory of Multimedia Learning that combined both images and speeches to boost up students’ learning process. It is because delivering of information and elaboration has been separated into verbal and visuals that enable students to understand by listen and envisage by images (Macaulay, M. 2000).
Long Term Memory Visual Representation
Oral Representation
Performance Verbal
Presentation
Selecting Words Organizing Words
Integrating Selecting Images Organizing Images
Figure 2: Mayers’ Generative Theory of Multimedia Learning (Mayer, 1997 & 2001)
2.2 Visual Graphics via interactive Multimedia
Using visual graphics via multimedia activities promised a high efficient learning outcome as it implicated a dynamic, realistic, tellingly, and conductive learning environment (Dick, H. 2004). An interactive multimedia with rich visual graphics for subject Science will ease the delivering and receiving process between teachers and students, in addition it increase students’ motivation in learning (Taylor, R. 2005). Furthermore, visual graphics will help teachers ease up elaboration of lessons to students (Dwyer, F.M., 2008).
3.0 Method
3.1 Research Objective
Base on the literature overview above, the purpose of this study was to investigate the effect of using visual graphics via interactive multimedia on the learning of mathematics (Straight Line) at secondary school level. In detailed, the null hypothesis or prediction derived from the literature review done is there is no significant min different in scores for post test among experimental group and control group.
3.2 Teaching Material
Objectives for this software are: software designed is able to fit in the studying environment and school syllabus; software is user-friendly and; elements of the graphics are able to help students learn Straight Line Method. There are three design principle used by researcher that are Strategic Design, Front Page and Interaction.
Researcher has developed a Strategic Designed of smooth flow screen to screen visual presentation. Table of contents were arranged in every screen in quick note format. To get further information, students may click content button and example button on top of the screen. Picture 1 presented a sample question provided to further strengthen students' understanding about the lesson learned.
Text Text
base
Verbally – based model
Visually – based model Image
Picture 1: Sample Question
Picture 2 below is software’s Front Page which included introduction, table of contents, activities and training available and summary. Students can undergo all activities and trainings to strengthen knowledge learned through this software. This software also equipped a summary function that enables students to make notes.
Picture 2: Front Page
Picture 3 below is example of Interaction where there are some Introduction, Table of Contents, Learning Objective and Learning Outcome. Students may understand studies by undergo these visual graphics. Menu button also placed in display top to go to main menu.
Picture 3: Learning Objective & Outcome
3.3 Procedures
The study has been carried out among two classes of 62 Form-4 students teach by a same teacher from Sekolah Menengah Vokasional Bukit Pelindung Classes were selected from a class of best academic result and another class of weak academic result. Students were separated into Experimental Group (12 male and 19 female) and Control Group (10 male and 21 female). A pre-test have given to the target student before show them the software designed to teach them Mathematics (Straight Line). After completed syllabus (Straight Line) learned by multimedia, they were required to answer variety of questions related with syllabus learned.
Introduction
THE GRADIENT OF A STRAIGHT LINE
3.4 Test Instrument
Achievement test, a questionnaire and an observation schedule were employed to identify achievement of students in Mathematics (Basic of Straight Line). Tests are in subjective form prepared by researcher; observation was carried out before and after student used visual graphics in learning Straight Line method to verify any interaction in between teachers and students; and questionnaires went thru by researcher to students to check their mastery to utilize visual graphics.
4.0 Results
Table 1 indicated experimental group earned a Min of 59.77 and standard deviation was 10.899, while control group has a Min of 55.71 and standard deviation of 13.264. Although there was a different in Min between two groups, however, the different was not statically significant enough. Probability Value P =0.214 was more than value pre-set on 0.05. It is clear to say there was no different among two groups from aspects of achievements or variance and they were in a same standard to participate in this research.
Table 1: Students’ Achievement in Mathematic Test before Study
Group N Min Standard
Deviation F Sig t Df Sig
Experimental 31 8.9677 3.8930
9.290 0.003 9.380 60 0.000
Control 31 1.9677 1.44877 P<0.05 P<0.05
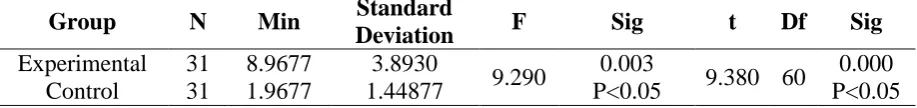
Table 2 below indicated a different of 7 in Min between Experimental and Control group. It clearly showed a statistical significant where p<0.05. Hence, utilization of visual graphics via interactive multimedia will improve students’ academic performance.
Table 2: Students’ Achievement in Mathematic Test before Study
Group N Min Standard
Deviation F Sig t Df Sig
Experimental 31 8.9677 3.893
9.29 0.003 9.380 60 0
Control 31 1.9677 1.44877 P<0.05 P<0.05
to interact with teachers.
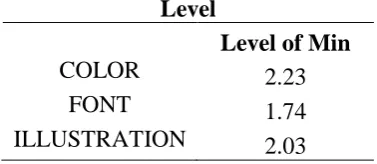
There were 31 students participated by using visual graphics in Mathematics (Straight Line) throughout this whole study. Information summarized from Table 3 for questionnaires about students’ demographic, color, typography and, Illustration filled up by these 31 students has revealed that color was the most effective element for students’ academic performance.
Table 3: Friedman Test for 3 Types of Visual Graphic Elements Level
Level of Min
COLOR 2.23
FONT 1.74
ILLUSTRATION 2.03
Table 4 indicated highest score among criteria for Colour are: Contrasting colour makes studies not routine; and colours on texts makes facts and formula easier to remember.
Table 4: Score for Min in Visual Graphic criteria level (Color)
Min Standard Deviation N
Consistent 4.2258 0.61696 31
Stimulation 4.4839 0.62562 31
Not Routine 4.5806 0.56416 31
Easy to Highlight
Important Points 4.4839 0.62562 31
Help in Memorizing 4.5806 0.56416 31
Attractive 4.5161 0.508 31
Routine 4.2258 0.61696 31
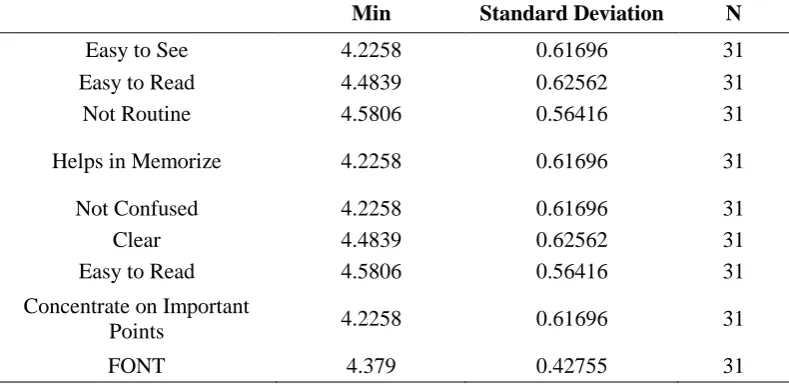
Table 5 indicated highest score among criteria for Font (Typography) is easier to read.
Table 5: Score for Min in Visual Graphic criteria level (Typography)
Table 6 indicated the average score for this min is at 4.4421
Table 6: Score for Min in Visual Graphic criteria level (Illustration)
Min Standard Deviation N
Fun to Learn 4.4839 0.62562 31
More Motivate Sentences 4.5806 0.56416 31
Improve Comprehension 4.2258 0.61696 31
Grab Attention 4.4839 0.62562 31
Create Interest 4.5806 0.56416 31
Increase Motivation 4.4839 0.62562 31
Ease Comprehension 4.5806 0.56416 31
Remain Interest 4.2258 0.61696 31
Delightful 4.2258 0.61696 31
Create Interest 4.4839 0.62562 31
Ease Comprehension 4.5806 0.56416 31
Prevent Routines 4.5806 0.56416 31
Provide Motivation 4.2258 0.61696 31
Take Part 4.4839 0.62562 31
Self Effected 4.5806 0.56416 31
Not Disturbing 4.2258 0.61696 31
Take Part 4.4839 0.62562 31
ILUSTRATION 4.4421 0.40438 31
Min Standard Deviation N
Easy to See 4.2258 0.61696 31
Easy to Read 4.4839 0.62562 31
Not Routine 4.5806 0.56416 31
Helps in Memorize 4.2258 0.61696 31
Not Confused 4.2258 0.61696 31
Clear 4.4839 0.62562 31
Easy to Read 4.5806 0.56416 31
Concentrate on Important
Points 4.2258 0.61696 31
5.0 Discussion
According to research done by Khatijah, M.S. (2005) and further proofed by othere researches follow up after, weakness in Mathematic existed long time ago due to its routines syllabus. All the time Mathematics are delivered by teachers in old manner and elaborated fully from textbooks without any new delivering approaches (Ibrahim, M.N., 2004). Besides, Students lost confidence when they score low marks in Mathematics examination. This situation becoming worse when they fed up or felt scared on Mathematics, and finally turn up to mental block for this subject.
To ensure the effectiveness of visual graphic in educating Mathematics, this study used pre test and post test on both two Experimental and Control groups of students. Control group continue teaching and learning conventionally while experimental group undergo visual graphics to learn Straight Line method. Results retrieve that there were differences between Control Group and Experimental Group in their post-test there was an increase in min score for experimental group compare to mean score for control group.
Conventional delivering method looked less effective as achievement of Control Group students' performance that used this method were low. Mean score for control group only increased by 1.8977 compared experimental group that boosted up to 8.9677. According To Noriah, K (2005), traditional education method such as “chalk and talk” and lecture only allowed limited information conveyed from lecturer to students.
There were two scenarios happened before and after presentation of visual graphics. Environment in classroom was quiet and monotone by conventional teaching method. There was no two-way interaction existed as teachers elaborated and wrote notes and theories on blackboard while students busy copy down what written on blackboard. However, introduction of visual graphics have improved the situation. Students were participated in two-way interaction process as they were free from copying theories and notes. Students threw out more questions and highly involved themselves in teaching and learning process as there was no boredom in their learning process.
Survey result revealed importance of color in helping students to learn Straight Line Method. Researcher highlighted some important point like wording colors and key points must be contract enough with background color to attract students’ attentions. It further supported by Tuft, E. (2006) as:
” Of all design elements,colour most exemplifies the wholeness of design ,the necessity to reason
globally.The first principle for use of colour is:Above all,do no harm.Colour must work to enhance
information resolution” (Tuft,E 2006,p 15-17)
Research also found that effective utilization of typography like wording size and colors, wording fonts, space between words will ease up teachers’ delivering process to students. When typography further attached with animations, it will increase students’ attention, interest and motivation (Grabiger, S.R., 2005).
without restriction could on the other hand disrupt student focus (Rosonke, R.J 2005). Teachers should be careful in using Illustration because of personal view and interpretation will rise up different meaning on illustration shown. This phenomenon has then used for “Rorschad Color Test” by psychologists to test someone's personality (Mohd Omar, D 2006).
6.0 Conclusion
For objective one, analysis above has shown a significant difference in performance between experimental group and control group. Control group has lower min than experimental group has confirmed existences of visual graphics will improve students’ academic performances and achievements. Objective two showed that students were willing to overcome their bashful, timid and distraction in class when visual graphics were introduced among them, hence a two way interactions were developed among students and teachers. Objective three responded an agreement for the software’s suitability to fit in teaching process. By the way, researcher has provided suggestions on this survey. Learning software can be distributed to students before teaching process so that they can go thru themselves earlier. This will result a higher learning outcome as students have prepared themselves to receive knowledge from teachers conventionally in class.
RUJUKAN
AlMikhafi ,K.(2006).The Effectiveness of using Microcomputers in Learning Algebraic Precedence Convensations.Doctoral Dissertation .Florida State University.
Alfino ,F (2007).Learning and Teaching Mathematics with Technology. National Council of Teachers of Mathematics (NCTM).New York.
Bagui, S. (1998). Reasons for increased learning using multimedia. Journal of Educational Multimedia and Hypermedia.7 (1): 3-18.
Baharuddin.A, (2005).Teknologi Pendidikan .Skudai:UTM.
Cressweell ,G.(1987).Challenging The Individual:The Tradition of Hypermedia Database.Academic Computer,4(4),22,23,31,38.
Dick ,H.(2002).The Future of Multimedia:Bridging to Virtual Worlds.Englewood Clifts,N.Jersey.Education Tchnology Publication.
Dwyer,F.M.(2008).Effect of Knowledge of Objectives on Visualised Instruction. Journal of Psychology.77,219-221.
Grabinger,S.R.(2005).Computer Screen Design :Viewer Judgments.Educational Technology,Research and Development,41(2),35-73.
Publication Distributors Sdn. Bhd.
Kementerian Pendidikan Malaysia (2001). Pembangunan Pendidikan 2001-2010. Kuala Lumpur: AG Grafik Sdn .Bhd.
Khatijah,M.S.(2005).”Hubungan Antara Beberapa Faktor Multimedia Dengan Pencapaian Matematik Dan Sains Pelajar Sekolah Menengah.”Jurnal Pendidikan.Jilid (21).Hlm 88-96
Macaulay, M. (2000). Embedding computer based learning with learning aids: A.Preliminary study International Journal of Instructional Media. 29 (3): 305-315.
Mayer, R. E. & Sims, V. K. (1994). For whom is a picture worth a thousand words? Extension of a Dual- Coding theory of multimedia learning. Journal of
Educational Psychology. 86(3): 389-401.
Mohd Omar,D (2006). Skilliterasi visual, pengkayaan instruksi di bilik darjah. Prosiding Konvensional Pendidikan Ke15 (ms.189-230). Kuala-Lumpur: Persatuan Teknologi Pendidikan.
Noriah,K.(2005).”Kaedah Pembelajaran Berkesan.” Kuala Lumpur: Cahaya Pantai (M) Sdn.Bhd.
Ong ,C.T.& Hu ,L.N.(2008) .Pictures,Imagery and Retarded Children’s Proses Learning.Journal of Education Psychology,70(4),m.s 58-88.
Rosonke,R.J.(2005).A study of the Effectiveness of Three Visual Attention Directing Devices On The Recall Of Relevant Information From Line Drawing (Doctoral Dissertation University Of Lowa,2005).Dissertation Abstracts International,35,4316A
Shiung, T.K. & Ling, W. Y.( 2005). Penggunaan ICT dalam Proses Pengajaran dan Pembelajaran di Kalangan Guru Sekolah Menengah Teknik dan Vokasional : Sikap Guru, Peranan ICT dan kekangan atau Cabaran Penggunaan ICT. Kertas
dibentang di Seminar Pendidikan 2005, Johor.Oct 2005.
Solon Community School District.,DRAFT.( 2003). At risk plan of services.
Taylor,R. (2005).The Computer In The School,Tutor Tool,Tutce,London.Teacher College Press.
Tengku Zawawi,T.Z.(2008).Penggunaan Internet Dalam Pendidikan Matemetik. KPM.
Tuff,E.(2006).The User Interface: The Point Of Competittion Bulletin Of The American Society For Information Science,18(5),15-17