Article type:Advanced Review
Anomaly Detection in Dynamic Networks:
A Survey
Stephen Ranshous1,2, Shitian Shen1,2, Danai Koutra3, Christos Faloutsos3, and Nagiza F. Samatova1,2,+
1Department of Computer Science, North Carolina State University
2Computer Science and Mathematics Division, Oak Ridge National Laboratory 3Computer Science Department, Carnegie Mellon University
+Corresponding author: samatova@csc.ncsu.edu
Abstract
Anomaly detection is an important problem with multiple applications, and thus has been studied for decades in various research domains. However, for dynamic networks, no comprehensive survey exists covering the richness of methods proposed and their differences, as well as the variety of problems they solve. In light of this, the current survey focuses on anomaly detection in time-evolving networks. The methods covered are classified into five cate-gories based on their technical approaches, and subsequently broken down by their output, i.e., the type of anomalies they detect—nodes, edges, subgraphs, and events. Some of the methods discussed cannot easily be placed into a single category, leveraging multiple approaches. For such cases, the method has been classified based on the predominant approach utilized. We cover a total of 46 methods: 9 based on communities, 2 on compression, 15 on de-composition, 11 on distance metrics, and 9 probabilistic based. Within these categories we highlight the similarities and differences showing the wealth of different techniques derived from similar conceptual approaches.
Introduction
Anomaly detection, or outlier detection, is the well-known problem [9, 37] of “finding patterns in data that do not conform to expected behavior” [14]. This area has been well-covered for a variety of domains including sequence data [16], discrete sequence data [15], and temporal data [32]; see also a general comprehensive overview [14]. However, anomaly detection in dynamic networks1has been barely touched in existing works [11, 32]. No extensive survey exists, despite the popularity and the growing importance of the topic.
A surge for researching novel methods for real world networks that are constantly evolving has been motivated by a number of applications. Dozens of methods specif-ically deisgned for dynamic environments have emerged over the last five years (see
summary in Table 1 and Table 2). These techniques complement methods for static graphs [59, 27, 26, 6], as the latter cannot be easily adopted for dynamic networks. They find real world applications in numerous domains, including but not limited to:
• Detection of ecological disturbances such as wildfires [21, 20] and cyclones [18] by analyzing the ecological evolution.
• Intrusion detection for individual systems [87] and network systems [85, 29, 23] by observing past normal behaviors and comparing new actions to the expected model.
• Identifying abnormal users and events in communication networks [64, 84], such as days with an abnormally high number of messages.
We present in this survey techniques for performing anomaly detection in dynamic net-works in hopes to bridge the gap between the increasing number of of emerging algo-rithms for this important graph mining task and the lack of their comprehensive anal-ysis. We start by introducing four different types of anomalies that these algorithms detect, namely, anomolous nodes, edges, subgraphs, and events. We then continue with an extensive overview of the existing methods based on the proposed taxonomy that takes into account their underlying design principles, such as those based on graph communities, compression, decomposition, distance metrics, and probabilistic model-ing of graph features. Finally, we subcategorize each taxonomic group further based on the types of anomalies detected.
Types of anomalies
In this section we identify and formalize four types of anomalies that arise in dynamic networks. These categories represent the output of the methods, not the implementation details of how they detect the anomalies, e.g., comparing consecutive time points, using a sliding window technique, etc.
Because graphs are assumed to be dynamic, their vertices and edges can be inserted or removed at every time step; however, for the sake of simplicity, we assume that the node correspondence and the edge correspondence across different time steps is resolved due to unique labeling of nodes and edges, respectively. We define a graph series as an ordered set of graphs with a fixed number of time steps, and a graph stream as an ordered set of graphs where new time steps are continuously added. The major-ity of techniques we discuss assume that the input graphs are simple, undirected, and unweighted. Hence, we assume that all graphs are of this type unless otherwise noted.
Type 1: Anomalous nodes
the other nodes in the graph. Optionally, identify the time point(s) where the nodes are determined to be anomalous.
Applications. Consider a graph seriesGwhere each graphGtis a single day of
net-work IP traffic. Assume that it is known that at timeta virus spreads throughout the system causing network congestion. By comparing the activity of each node on the days surrounding the attack to their activity on the day of the attack, one can detect the nodes from which the virus originated, as, at timet, those nodes should have been more active than usual. Typical applications of this type of anomaly detection are identify-ing nodes that contribute the most to a discovered anomaly, such as in communication networks [5] (also known as attribution), and observing the shifts in community in-volvement [28, 44].
Example. An example of nodes that do not share the same evolution pattern as the community they initially belong to is shown in Figure 1. In the first time step, all of the nodes are found to be in the same community according to some extracted feature values, which is indicated by the blue circle. In time steps two and three, there is a shift in the values of the community as a whole, altering the distribution of the feature val-ues. Some nodes, however, do not follow this trend and end up as outliers (anomalous nodes), indicated by the red crosses.
Type 2: Anomalous edges
Problem 2. Given a fixed graph seriesGor graph streamG, find a subset of the edges such that every edge in the subset has an “irregular” evolution. Optionally, identify the time point(s) where they are determined to be anomalous.
There are two main types of irregular evolution for edges: (i) abnormal edge weight evolution, where the weight of a single edge fluctuates over time and has inconsistent spikes in value, and (ii) appearance of unlikely links in a graph [66, 1], where two nodes that are not typically connected or part of the same community have an edge added between them.
Applications. Consider a dynamic communication network where the nodes are peo-ple, the edges represent communication between two peopeo-ple, and the edge weight cor-responds to the number of messages they exchange. Imagine personsaandbtypically message each other 10 times each day, represented by the weighted edge (a, b,10). Then, suddenly, they have a day where they message each other 25 times. It is nat-ural to assume that something happened between them because of the sharp increase in communication. This is the intuition behind edge detection. Anomaly detection of edges appears in many areas, such as vehicle traffic patterns [52] and finding unlikely social interactions [39].
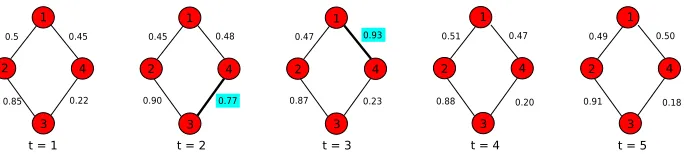
most each time step. However, at timet = 2, edge (3,4)suddenly has a weight of
0.77, radically different from it’ average weight,0.21, in the rest of the time points. Similarly, edge(1,4)att= 3has an edge weight of0.93, which is roughly double its typical value (0.48).
Type 3: Anomalous subgraphs
Problem 3. Given a fixed graph seriesGor graph streamG, find all subgraphs that have “unusual” behavior. Optionally, identify the time point(s) where they are deter-mined to be anomalous.
Applications. Given a dynamic network representing vehicle traffic, where nodes are street intersections, edges are the streets, and the edge weights are the travel times for that particular road, how can traffic accidents be identified? Accidents typically block traffic on the roads surrounding the intersection where they occur, increasing the travel time by a substantial amount for those roads. If we were able to identify regions of the graph that exhibited this type of behavior, we would be able to identify such accidents automatically. This is just one possible application area [57], others include detecting the change in communities in the food web [19], and detecting changes and threats in social networks [39, 56].
Example. Figure 3 shows an example of two types of community based anomalous subgraphs. The shrunken community shown in Figure 3a is when a single community loses a considerable number of its members. Closely related is the idea of a split community shown in Figure 3b, when a single community divides into several distinct communities.
Type 4: Event and change detection
Problem 4(Event detection). Given a fixed graph seriesGor graph streamG, find a time point at which the graph exhibits behavior sufficiently different from the others.
Applications. In the example scenario presented in the node anomaly section, we as-sumed that the time point that marked an event was known. However, in real world applications the event points are seldom known, requiring methods to discover them from the data. Event detection has been used to detect when the collective motions in molecular dynamics simulations suddenly change [65], to find frames in a video that are unlike the others [82, 71], and to detect disturbances in the ecosystem (e.g., wildfires) [20].
Problem 5(Change detection). Given a fixed graph seriesGor graph streamG, find a time point at which a substantial change in the graph persists until the next point of change.
It is important to note the distinction between event and change detection. While events represent isolated incidents, change points mark a point in time where the entire behav-ior of the graph changes and the difference is maintained until the next change point.
Applications.Consider the DBLP network where authors are linked to the venues they publish per year. By profiling the authors, one can spot that most of them publish in specific conferences consistently, while few authors act as “bridges” and switch areas of interest and venues over the course of their career [48]. Change detection has been also applied to mobile communication graphs [5] and traffic networks [43].
Example. Figure 4b illustrates the concept of change detection. Time stepst = 1,2
have approximately the same structure, with sparse connectivity between the nodes. However, at timet= 3there is a large structural change, similar to that in Figure 4a, except the new structure is maintained.
Methods
Community based methods
Community based methods track the evolution of communities and their associated nodes in the graphs over time [77, 78, 79]. Various community-based approaches dif-fer in two main points: (i) in the aspects of the community structure they analyze, e.g., the connectivity within each community vs. how the individual nodes are assigned to the communities at each time step; and (ii) in the definitions of communities they use, e.g.,softcommunities where each node has a probability of belonging to each commu-nity vs.disjointcommunities where each node is placed into at most one community in the graph. Moreover, based on how the community evolution is viewed, it can be applied for the detection of different anomaly types. For example, a rapid expansion or contraction of a community could indicate that the specificsubgraphfor that commu-nity is undergoing drastic changes, whereas a drop in the number of communities by two corresponds to an abnormal event.
Node detection
Based on this logic, using soft community matching and looking at each community individually, the average change in belongingness (the probability the node is part of the community) for each node can be found for consecutive time steps. Nodes whose change in belongingness is different from the average change of the nodes in the com-munity are said to beevolutionary community outliers[35].
The changes in a node’s community belongingness may form a pattern over time, called a soft temporal pattern. In [70], a Non-Negative Matrix Factorization approach in com-bination with the Minimum Description Length principle are used to automatically de-tect node roles and build transition models. The community memberships are found slightly differently in [34], whereXmeansis used. However, in both cases, the patterns common across all of the nodes in the graph are extracted, then each node’s patterns are compared to the extracted ones. If a node’s patterns are not similar to any of the extracted common patterns, then the node is anomalous. Later extended to networks derived from heterogeneous data sources [33], the two step approach in [34] is mod-ified to an alternating iterative approach. Instead of extracting patterns first and then identifying outliers, the patterns and outliers are found in an alternating fashion (pattern extraction→outlier detection→pattern extraction→ · · ·) until the outliers discovered do not change on consecutive iterations. By alternating back and forth between pattern extraction and outlier detection, the algorithm accounts for the affect the outliers have on the communities discovered [35].
If the edge weights are considered as the connection strength between two nodes, then the removal of a node with a high edge weight impacts the node it is connected to more than the removal of a node with a low edge weight [44]. The “closeness” of nodes is defined as a function of the weighted path between them instead of strictly the length of the path (e.g., one-hop paths). A node’s “corenet” is built based on the closeness values of nodes. Neighboring nodes within two hops and with a weighted path higher than a threshold value are part of the corenet. At each time step every node is given an outlier score based on the change in its corenet, and the top outlier scores are declared anomalous.
Subgraph detection
Main Idea. Instead of looking at individual nodes and their community belongingness, entire subgraphs that behave abnormally can be found by observing the behavior of communities themselves over time.
networks, then the community is anomalous [18]; two communities are considered cor-responding communities if they have a certain percentage of their vertices in common.
Unlike [18, 19] which consider only the structure of the network, in social networks there is often more information available. For example, in the Twitter user network, clusters can be found based on the content of tweets (edges), as well as the users (ver-tices) involved. If the fraction of the tweets (edges) added during the recent time win-dow for a cluster is much larger than the fraction of tweets (edges) added anytime before the window, then this influx is declared as an evolution event for that cluster [3]. A cluster that experiences an evolution event is marked as an anomalous subgraph at the time when the evolution event occurs.
Change detection
Main Idea. Changes are detected by partitioning the streaming graphs into coherent segments. The beginning of each segment represents a detected change.
The segments are found online by comparing the node partitioning of the newest graph to the partitioning found for the graphs in the current segment. Node partitioning can be achieved with many methods, but in [25] it is done using the relevance matrix computed by random walks with restarts and modularity maximization. When the partitioning of the new graph is much different than the current segment’s, a new segment begins and the time point for the new graph is output as a detected change. The similarity of two partitions is computed as their Jaccard coefficient.
Compression based methods
The methods discussed in this section are all based on the minimum description length (MDL) principle [68]. The minimum description length principle, and compression techniques based on this principle, exploit patterns and regularity in the data to achieve a compact graph representation [31]. Applying this principle to graphs is done by viewing the adjacency matrix of a graph as a single binary string, flattened in row or column major order. If the rows and columns of the matrix can be rearranged such that the entropy of the binary string representation of the matrix is minimized, then the compression cost (also known as encoding cost [69]) is minimized. Anomalies can then be defined as graphs or edges that inhibit compressibility.
Edge detection
Main Idea. An edge is considered anomalous if the compression of a subgraph has higher encoding cost when the edge is included than when it is omitted.
assigned to them so that the encoding cost is minimized. The second step iteratively splits the partitions with high entropy into two. Any node whose removal from the original partition would result in a decrease in entropy is removed from that partition and placed into the new one. Once the method has converged, meaning steps 1 and 2 are unable to find an improvement, the edges can be given outlierness scores. The score for each edge is computed by comparing the encoding cost of the matrix including the edge to the encoding cost if the edge is removed.
Change detection
Main Idea. The main idea is that consecutive time steps that are very similar can be grouped together leading to low compression cost. Increase in the compression cost means that the new time step differs significantly from the previous ones, and thus signifies a change.
To detect changes in a graph stream, similar consecutive time steps can be grouped into segments. When considering the next graph in the stream, it can either be grouped with the graphs in the current segment, or it can be the beginning of a new one. The decision to start a new segment is made by comparing the encoding cost of the current segment without the next graph to the encoding cost of the segment if the next graph were included. If the node partitioning for the new graph is very similar to the node partitioning of the graphs in the segment then the encoding cost will not change much. However, if the partitions are very different, the encoding cost would increase because of the increase in entropy. Changes in the graph stream are the time points when a new segment begins [73]. This method is also parameter-free.
Decomposition based methods
These techniques represent the set of graphs as a tensor, most easily thought of as a multidimensional array, and perform its factorization or dimensionality reduction. The most straightforward method of modeling a dynamic graph as a tensor is to create a dimension for each graph aspect of interest, e.g., a dimension for time, source nodes, destination nodes, etc. For example, modeling the Enron email dataset can be done using a 4-mode tensor, with dimensions for sender, recipient, keyword, and date. The element(i, j, k, l)is 1 if there exists an email that is sent from senderito recipientj
with keywordkon dayl, otherwise it is 0.
Similar to compression techniques, decomposition techniques search for patterns or regularity in the data to exploit. One of the most popular methods for matrices (2-mode tensors) is singular value decomposition (SVD) [30], and for higher order tensors (≥3
Node detection
Main Idea. Matrix decomposition is used to obtain activity vectors per node. A node is characterized as anomalous if its activity changes significantly between consecutive time steps.
Due to the computational complexity of performing principal component analysis on the entire graph, it is advantageous to apply it locally. One approach is to have each node maintain an edge correlation matrixM, which has one row and column for every neighbor of the node. The value of an entry in the matrix for node i, M(j, k), is the correlation between the weighted frequencies of the edges(i, j)and(i, k). The weighted frequencies are found using a decay function, where edges that occured more recently have a higher weight. The largest eigenvalue and its corresponding vector obtained by performing PCA onM are summaries of the activity of the node and the correlation of its edges, respectively. The time series formed by finding the changes in these values are used to compute a score for each node at each time step. Nodes that have a score above a threshold value are output as anomalies at that time [86].
Event detection
Main Idea. There are two main approaches: (a) Tensor decomposition approximates the original data in a reduced dimensionality, and the reconstruction error is an indi-cator of how well the original data is approximated. Sub-tensors, slices, or individual fibers in the tensor that have high reconstruction error do not exhibit behavior typical of the surrounding data, and reveal anomalous nodes, subgraphs, or events. (b) Singu-lar values and vectors, as well as eigenvalues and eigenvectors are tracked over time in order to detect significant changes that showcase anomalous nodes.
Using the reconstruction error as an indicator for anomalies has been employed for detecting times during molecular dynamics simulations where the collective motions suddenly change [65], finding frames in a video which are unlike the others [82], and identifying data that do not fit any concepts [8].
ParCube [62] can be used in the same fashion and provide a large increase in efficiency. The PARAFAC decomposition has been shown to be effective at spotting anomalies in tensors as well [48].
A probabilistic model that represents the graph expected at a given time step can be created using the Chung-Lu random graph model [22]. Taking the difference between the real graph’s adjacency matrix and the expected graphs forms a residual matrix. Anomalous time windows are found by performing SVD on the residual matrices— on which a linear ramp filter has been applied—and by analyzing the change in the top singular values [54]. The responsible nodes are identified via inspection of the right singular vectors. More accurate graph models that also consider attributes are proposed in [55].
Performing PCA on the data, the calculated eigenvectors can be separated into “nor-mal” and “anomalous” sets by projecting the data onto each eigenvector, and flagging as anomalous the projections that contain data points outside 3 standard deviations of the values. At each time step, the components are found by projecting the data onto its normal and anomalous subspace. Changes are detected when modifications in the anomalous components are above a threshold in traffic flow data [50]. Expanding on this method, joint sparse PCA and graph-guided joint sparse PCA were developed to localize the anomalies [45]. The responsible nodes are more easily identified by using asparseset of components for the anomalous set. Nodes are given an anomaly score based on the values of their corresponding row in the abnormal subspace. As a result of the anomalous components being sparse, the nodes that are not anomalous receive a score of 0. Due to the popularity of PCA in traffic anomaly detection, a study was performed identifying and evaluating the main challenges of using PCA [67].
Change detection
Main Idea. Theactivity vectorof a graph is the principal component, the left singular vector corresponding to the largest singular value obtained by performing SVD on the weighted adjacency matrix. A change point is when an activity vector is substantially different from the “normal activity” vector.
Distance based methods
Using the notion of distance as a metric to measure change is natural. Two objects that have a small difference in a measured metric can be said to be similar. The metrics measured in graphs are typically structural features, such as the number of nodes. Once the summary metrics are found for each graph, the difference or similarity, which are inversely related, can be calculated. The variation in the algorithms lies in the metrics chosen to extract and compare, and the methods they use to determine the anomalous values and corresponding graphs.
Edge detection
Main Idea. If the evolution of some edge attribute (e.g., edge weight) differs from the “normal” evolution, then the corresponding edge is characterized as anomalous.
In [52], a dynamic road traffic network whose edge weights vary over time is studied. The similarity between the edges over time is computed using a decay function that weighs the more recent patterns higher. At each time step, an outlierness score is calculated for each edge based on the sum of the changes in similarity scores.
Viewing the network at a stream of edges, meaning the network does not have a fixed topology as the road traffic network did, the frequency and persistence of an edge can be measured and used as an indicator of its novelty. The persistence of an edge is how long it remains in the graph once it is added. Set system discrepancy [17] is one way to measure the persistence and frequency of the edges. When a new edge arrives, its discrepancy is calculated and compared to the mean discrepancy value of the active edge set. If the weighted discrepancy of the edge is more than a threshold level greater than the mean discrepancy, the edge is declared novel (anomalous) [1]. This method also allows anomalous nodes and subgraphs to be detected.
Subgraph detection
Main Idea. A subgraph with many “anomalous” edges is deemed anomalous.
Event detection
Main Idea. Provided a functionf(Gi, Gj)that measures the distance between two
graphs, a time series of distance values can be constructed by applying the function on consecutive time steps in the series. Anomalous values can then be extracted from this time series using a number of different heuristics, such as selecting the topkor using a moving average threshold.
Extracting features from the graphs is a common technique to create a summary of the graph in a few scalar values, its signature. Localfeatures are specific to a single node and its egonet (the subgraph induced by itself and its one-hop neighbors), such as the node or egonet degree.Globalfeatures are derived from the graph as a whole, such as the graph radius. The local features of every node in the graph can be agglomerated into a single vector, the signature vector, of values that describe the graph using the moments of distribution (such as mean and standard deviation) of the feature values. In [10], the similarity between two graphs is the Canberra distance, a weighted ver-sion of theL1distance, between the two signature vectors. A similar approach is used in [51] to detect abnormal times in traffic dispersion graphs. Instead of an agglomera-tion of local features, it extracts global features from each graph, and any graph with a feature value above a threshold is anomalous.
As an alternative to extracting multiple features from the graph, the pairwise node affinity scores may be used. Pairwise node affinity scores are a measure of how much each node influences another node, and can be found using fast belief propagation [47]. In [49] the scores are calculated for two consecutive time steps, and the similarity be-tween the two graphs is the rooted Euclidean distance (Matusita distance) bebe-tween the score matrices. A moving threshold is set on the time series of similarity scores using quality control with individual moving range. The exponential weighted moving aver-age has also been used as a way to dynamically set the threshold, tested on distribution features extracted from Wikipedia revision logs [7].
Complementary to feature similarity, one can look at the structural differences between graphs to identify the magnitude of change. These methods focus on the function that defines the distance between graphs instead of finding the optimal features to use as summaries. Many metrics have been developed and tested to quantify the differences between graphs. Ten different distance functions (e.g., weight distance, maximum common subgraph (MCS) weight difference, graph edit distance) were evaluated on TCP/IP traffic graphs with known anomalies (ground truth). Box-Jenkins autoregres-sive moving average (ARMA) modeling [12] was used to set the threshold and identify anomalies. Of the ten distance functions tested, the MCS based methods performed the best [63]. In [61], five different distance scoring functions were tested on web graphs with specific types of anomalies: missing subgraph, missing vertices, and connectivity change. The best method was the signature similarity, which is done by extracting a signature vector from each graph and finding the distance between them. The features used were each vertex and its PageRank value, and each edge(u, v)with a weight of
Instead of finding the difference between two consecutive graphs, events can be de-tected using the time series of robustness values for each graph. Robustness is a mea-sure of the connectivity of the graph. A graph with a high robustness will retain the same general structure and connectivity even when some nodes or edges are removed. Finding events is then finding when the robustness value changes significantly [53].
Probabilistic model based methods
With a foundation in probability theory, distributions, and scan statistics, these meth-ods typically construct a model of what is considered “normal” or expected. Devia-tions from this model are flagged as anomalous. The type of model used, how it is constructed, what it is modeling, and the method for determining outliers is what dif-ferentiates these approaches.
Anomalous node detection
Main Idea. There are three main approaches: (a) Modeling some node features using probabilistic approaches, and tracking the nodes that do not fit the models; (b) Building scan statistics time series and detecting points that are several standard deviations away from the mean; (c) Node classication.
One way to model the relationship between nodes is considering the communication between them as a Bayesian discrete time counting process. A model is fit to the ex-pected number of communications (weight) for each edge and is continuously updated as new graphs are considered. At any time point when the actual number of communi-cations is different from the expected number by a statistically significant amount both nodes are added to the set of anomalies [39]. Statistical significance is determined by a predictivep-value dropping below a threshold.
Scan statistics are often called “moving window analysis,” where the local maximum or minimum of a measured statistic is found in specific regions of the data. In a graph a scan statistic can be considered as the maximum of a graph invariant feature, such as the number of edges, found for each node and its neighborhood in the graph. The local statistic for each node is normalized using the mean and standard deviation of its recent values. The scan statistic of a graph is the maximum of all of the local scan statistics. Normalizing the values accounts for the history of each node, meaning the statistic for each node is relative to its own past instead of the values of the other nodes. Building a standardized time series of the scan statistic values, any value that is five standard deviations away from the mean of the series is considered an event. The node most responsible is identified as the one that was chosen for the scan statistic value for the entire graph [64].
accomplices. It incrementally updates the model as new edges are added, taking ad-vantage of the fact that an edge insertion or removal will affect only a local subgraph. Nodes that are assigned the label of fraudster are anomalous.
Anomalous subgraph detection
Main Idea. Fixed subgraphs (e.g., like paths and stars), multigraphs, and cumulative graphs are used to constuct models on the expected behaviors. Deviations from the models signify an anomalous subgraph.
To identify hacker behaviors in a network, scan statistics are combined with a Hidden Markov Model (HMM) for edge behavior. Unlike [39] that used neighborhoods, the local scan statistics are based on two graph shapes, thek-path and star. Comparing the scan statistics of a sliding window to its past values, and using an online thresh-olding system, local anomalies are identified [58]. The local anomaly is the subgraph representing thek-path or star used to derive the statistic.
Another method to model a dynamic network, instead of using a series of graphs, is to have a single multigraph where parallel edges correspond to communication between nodes at two different time steps. The initial multigraph is decomposed into telescoping graphs for each time window [24]. Telescoping graphs that are large in size, but have a low probability of appearing, are output as anomalies.
Likewise, a cumulative graph, which included every edge seen up until the current time step, could be used. Edge weights are calculated using a decay function where more recent edges weigh more. The connected components in the cumulative graph for the entire time series are found and monitored for unusual behavior. Unusual behavior is defined as a deviation from the model constructed using the cumulative graph for expected behavior at a given time step [80].
Event detection
Main Idea. Deviations from the models of the graph likelihood or the distribution of the eigenvalues reveal when an event occurs.
Maintaining a structural summary of the network by keeping multiple partitionings of the graph can be used to detect graph outliers online [4]. The structural summary and partitionings allow an edge likelihood value to be calculated for every edge in the new graph. After calculating the edge likelihoods, the graph likelihood is derived by taking the geometric mean of the edge likelihoods. If the graph likelihood is several standard deviations below the average of all the graphs up until that point, the graph is an outlier.
calculate a potential score for every sender-recipient pair, the probability of all possi-ble source-destination node tuples can be estimated. Tuples represent an email, where there is one sender and multiple recipients, while edges represent a link between two individual nodes. Time windows that are anomalous are found by comparing the av-erage log-likelihood scores for the windows. Individual emails that are abnormal can also be found by looking at the emails with the lowest likelihood.
Based on the assumption that each node has a time series of feature values, a node-to-node correlation matrix can be generated for each time step. The eigen equation of the correlation matrix is compressed by keeping the largest eigenvalues and a set of low dimension matrices (one matrix for each node). By learning the distributions of the eigenvalues and matrices, both events and the nodes responsible can be identified. When the eigenvalues deviate from the expected distribution an event has occured. The nodes whose matrices deviate from the matrix distribution the most are considered responsible [40].
Conclusion
being followed is what separates these methods. Table 1 and Table 2 show a summary of the methods presented in this survey, the type of anomalies they detect, and the year the paper was published. The field of anomaly detection in dynamic graphs is relatively young and is rapidly growing in popularity, as indicated by the number of papers published in the past five years. For fur-ther reading on anomaly detection in graphs and ofur-ther domains we direct the reader to [2, 14, 15, 16, 32, 72].
Acknowledgements
This work was supported in part by the DOE SDAVI Institute and the U.S. National Science Foundation (Expeditions in Computing program).
References
[1] James Abello, Tina Eliassi-Rad, and Nishchal Devanur. Detecting novel dis-crepancies in communication networks. InProceedings of the 10th IEEE Inter-national Conference on Data Mining (ICDM), Sydney, Australia, pages 8–17. IEEE, 2010.
[2] Charu C Aggarwal. Outlier Analysis. Springer, 2013.
[3] Charu C Aggarwal and Karthik Subbian. Event detection in social streams. In Proceedings of the 12th SIAM International Conference on Data Mining (SDM), Anaheim, CA, pages 624–635, 2012.
[4] Charu C Aggarwal, Yuchen Zhao, and Philip S Yu. Outlier detection in graph streams. Proceedings of the 27th International Conference on Data Engineer-ing (ICDE), Hannover, Germany, pages 399–409, 2011.
[5] Leman Akoglu and Christos Faloutsos. Event detection in time series of mobile communication graphs. 27th Army Science Conference, 2(3):18, 2010. [6] Leman Akoglu, Mary McGlohon, and Christos Faloutsos. Oddball: Spotting
anomalies in weighted graphs. InAdvances in Knowledge Discovery and Data Mining, pages 410–421. Springer, 2010.
[9] Vic Barnett and Toby Lewis. Outliers in statistical data, volume 3. Wiley New York, 1994.
[10] Michele Berlingerio, Danai Koutra, Tina Eliassi-Rad, and Christos Faloutsos. Netsimile: a scalable approach to size-independent network similarity. arXiv preprint arXiv:1209.2684, 2012.
[11] Cemal Cagatay Bilgin and B ¨ulent Yener. Dynamic network evolution: Models, clustering, anomaly detection. IEEE Networks, 2006.
[12] George EP Box and Gwilym Jenkins. Time series analysis: Forecasting and control. Holden-D. iv, San Francisco, 1970.
[13] Deepayan Chakrabarti. Autopart: Parameter-free graph partitioning and outlier detection. InProceedings of the 8th European Conference on Principles and Practice of Knowledge Discovery in Databases (PKDD), Pisa, Italy, pages 112– 124. Springer, 2004.
[14] Varun Chandola, Arindam Banerjee, and Vipin Kumar. Anomaly detection: A survey. ACM Computing Surveys (CSUR), 41(3):15, 2009.
[15] Varun Chandola, Arindam Banerjee, and Vipin Kumar. Anomaly detection for discrete sequences: A survey. IEEE Transactions on Knowledge and Data Engineering, 24(5):823–839, 2012.
[16] Varun Chandola, Varun Mithal, and Vipin Kumar. Comparative evaluation of anomaly detection techniques for sequence data. In Proceedings of the 8th IEEE International Conference on Data Mining (ICDM), Pisa, Italy, pages 743– 748. IEEE, 2008.
[17] Bernard Chazelle. The discrepancy method: randomness and complexity. Cambridge University Press, 2002.
[18] Zhengzhang Chen, William Hendrix, Hang Guan, Isaac K Tetteh, Alok Choud-hary, Fredrick Semazzi, and Nagiza F Samatova. Discovery of extreme events-related communities in contrasting groups of physical system networks. Data Mining and Knowledge Discovery, 27(2):225–258, 2013.
[19] Zhengzhang Chen, William Hendrix, and Nagiza F Samatova. Community-based anomaly detection in evolutionary networks. Journal of Intelligent Infor-mation Systems, 39(1):59–85, 2012.
[20] Haibin Cheng, Pang-Ning Tan, Christopher Potter, and Steven Klooster. A robust graph-based algorithm for detection and characterization of anomalies in noisy multivariate time series. In IEEE International Conference on Data Mining Workshops, 2008. ICDMW’08., pages 349–358. IEEE, 2008.
[22] Fan Chung, Linyuan Lu, and Van Vu. Spectra of random graphs with given expected degrees. Proceedings of the National Academy of Sciences, 100(11):6313–6318, 2003.
[23] Qi Ding, Natallia Katenka, Paul Barford, Eric Kolaczyk, and Mark Crovella. In-trusion as (anti) social communication: characterization and detection. In Pro-ceedings of the 18th ACM International Conference on Knowledge Discovery and Data Mining (SIGKDD), Beijing, China, pages 886–894. ACM, 2012. [24] Hristo Djidjev, Gary Sandine, Curtis Storlie, and Scott Vander Wiel. Graph
based statistical analysis of network traffic. InProceedings of the Ninth Work-shop on Mining and Learning with Graphs, 2011.
[25] Dongsheng Duan, Yuhua Li, Yanan Jin, and Zhengding Lu. Community mining on dynamic weighted directed graphs. InProceedings of the 1st ACM interna-tional workshop on Complex networks meet information & knowledge manage-ment, pages 11–18. ACM, 2009.
[26] William Eberle and Lawrence Holder. Detecting anomalies in cargo using graph properties. InIntelligence and Security Informatics, pages 728–730. Springer Berlin Heidelberg, 2006.
[27] William Eberle and Lawrence Holder. Anomaly detection in data represented as graphs. Intelligent Data Analysis, 11(6):663–689, 2007.
[28] Jing Gao, Feng Liang, Wei Fan, Chi Wang, Yizhou Sun, and Jiawei Han. On community outliers and their efficient detection in information networks. In Pro-ceedings of the 16th ACM International Conference on Knowledge Discovery and Data Mining (SIGKDD), Washington, DC, pages 813–822. ACM, 2010. [29] Amol Ghoting, Matthew Eric Otey, and Srinivasan Parthasarathy. Loaded:
Link-based outlier and anomaly detection in evolving data sets. InProceedings of the 4th IEEE International Conference on Data Mining (ICDM), Brighton, UK, pages 387–390. IEEE, 2004.
[30] Gene H Golub and Christian Reinsch. Singular value decomposition and least squares solutions. Numerische Mathematik, 14(5):403–420, 1970.
[31] Peter Gr ¨unwald. A tutorial introduction to the minimum description length prin-ciple. 2005.
[32] Manish Gupta, Jing Gao, Charu C. Aggarwal, and Jiawei Han. Outlier detec-tion for temporal data: A survey. IEEE Transactions in Knowledge and Data Engineering, 25(1):1, 2013.
[34] Manish Gupta, Jing Gao, Yizhou Sun, and Jiawei Han. Community trend out-lier detection using soft temporal pattern mining. In Machine Learning and Knowledge Discovery in Databases, pages 692–708. Springer, 2012.
[35] Manish Gupta, Jing Gao, Yizhou Sun, and Jiawei Han. Integrating community matching and outlier detection for mining evolutionary community outliers. In Proceedings of the 18th ACM International Conference on Knowledge Discov-ery and Data Mining (SIGKDD), Beijing, China, pages 859–867. ACM, 2012. [36] Richard A Harshman. Foundations of the parafac procedure: models and
con-ditions for an “explanatory” multimodal factor analysis. 1970.
[37] Douglas M Hawkins. Identification of outliers, volume 11. Chapman and Hall London, 1980.
[38] Weisong He, Guangmin Hu, and Yingjie Zhou. Large-scale ip network be-havior anomaly detection and identification using substructure-based approach and multivariate time series mining. Telecommunication Systems, 50(1):1–13, 2012.
[39] Nicholas A Heard, David J Weston, Kiriaki Platanioti, and David J Hand. Bayesian anomaly detection methods for social networks. The Annals of Ap-plied Statistics, 4(2):645–662, 2010.
[40] Shunsuke Hirose, Kenji Yamanishi, Takayuki Nakata, and Ryohei Fujimaki. Network anomaly detection based on eigen equation compression. In Pro-ceedings of the 15th ACM International Conference on Knowledge Discovery and Data Mining (SIGKDD), Paris, France, pages 1185–1194. ACM, 2009. [41] Zan Huang and Daniel Dajun Zeng. A link prediction approach to anomalous
email detection. In IEEE International Conference on Systems, Man and Cy-bernetics, 2006. SMC’06., volume 2, pages 1131–1136. IEEE, 2006.
[42] Tsuyoshi Ide and Hisashi Kashima. Eigenspace-based anomaly detection in computer systems. InProceedings of the 10th ACM International Conference on Knowledge Discovery and Data Mining (SIGKDD), Seattle, WA, pages 440– 449. ACM, 2004.
[43] Keisuke Ishibashi, Tsuyoshi Kondoh, Shigeaki Harada, Tatsuya Mori, Ryoichi Kawahara, and Shoichiro Asano. Detecting anomalous traffic using communi-cation graphs. InTelecommunications: The Infrastructure for the 21st Century (WTC), 2010, pages 1–6. VDE, 2010.
[44] Tengfei Ji, Dongqing Yang, and Jun Gao. Incremental local evolutionary outlier detection for dynamic social networks. In Machine Learning and Knowledge Discovery in Databases, pages 1–15. Springer, 2013.
[46] Tamara G Kolda and Jimeng Sun. Scalable tensor decompositions for multi-aspect data mining. InProceedings of the 8th IEEE International Conference on Data Mining (ICDM), Pisa, Italy, pages 363–372. IEEE, 2008.
[47] Danai Koutra, Tai-You Ke, U Kang, Duen Horng Polo Chau, Hsing-Kuo Kenneth Pao, and Christos Faloutsos. Unifying guilt-by-association approaches: The-orems and fast algorithms. InMachine Learning and Knowledge Discovery in Databases, pages 245–260. Springer, 2011.
[48] Danai Koutra, Evangelos E Papalexakis, and Christos Faloutsos. Tensorsplat: Spotting latent anomalies in time. In 2012 16th Panhellenic Conference on Informatics (PCI), pages 144–149. IEEE, 2012.
[49] Danai Koutra, Joshua Vogelstein, and Christos Faloutsos. Deltacon: A princi-pled massive-graph similarity function. InProceedings of the 13th SIAM Inter-national Conference on Data Mining (SDM), Texas-Austin, TX, 2013.
[50] Anukool Lakhina, Mark Crovella, and Christophe Diot. Diagnosing network-wide traffic anomalies. InACM SIGCOMM Computer Communication Review, volume 34, pages 219–230. ACM, 2004.
[51] Do Quoc Le, Taeyoel Jeong, H Eduardo Roman, and James Won-Ki Hong. Traffic dispersion graph based anomaly detection. InProceedings of the Sec-ond Symposium on Information and Communication Technology, pages 36–41. ACM, 2011.
[52] Xiaolei Li, Zhenhui Li, Jiawei Han, and Jae-Gil Lee. Temporal outlier detection in vehicle traffic data. InProceedings of the 25th International Conference on Data Engineering (ICDE), Shanghai, China, pages 1319–1322. IEEE, 2009. [53] Fragkiskos D Malliaros, Vasileios Megalooikonomou, and Christos Faloutsos.
Fast robustness estimation in large social graphs: Communities and anomaly detection. InProceedings of the 12th SIAM International Conference on Data Mining (SDM), Anaheim, CA, pages 942–953, 2012.
[54] Benjamin A Miller, Nicholas Arcolano, Michelle S Beard, Jeremy Kepner, Matthew C Schmidt, Nadya T Bliss, and Patrick J Wolfe. A scalable signal pro-cessing architecture for massive graph analysis. In 2012 IEEE International Conference on Acoustics, Speech and Signal Processing (ICASSP), pages 5329–5332. IEEE, 2012.
[55] Benjamin A Miller, Nicholas Arcolano, and Nadya T Bliss. Efficient anomaly detection in dynamic, attributed graphs: Emerging phenomena and big data. In2013 IEEE International Conference on Intelligence and Security Informatics (ISI), pages 179–184. IEEE, 2013.
[57] Misael Mongiovı, Petko Bogdanov, Razvan Ranca, Evangelos E Papalexakis, Christos Faloutsos, and Ambuj K Singh. Netspot: Spotting significant anoma-lous regions on dynamic networks. In Proceedings of the 13th SIAM Interna-tional Conference on Data Mining (SDM), Texas-Austin, TX, 2013.
[58] Joshua Neil, C Storlie, Curtis Hash, Alexander Brugh, and Mike Fisk. Scan statistics for the online detection of locally anomalous subgraphs. PhD thesis, PhD thesis, U. of New Mexico, 2011.
[59] Caleb C Noble and Diane J Cook. Graph-based anomaly detection. In Pro-ceedings of the 9th ACM International Conference on Knowledge Discovery and Data Mining (SIGKDD), Washington, DC, pages 631–636. ACM, 2003. [60] Shashank Pandit, Duen Horng Chau, Samuel Wang, and Christos Faloutsos.
Netprobe: a fast and scalable system for fraud detection in online auction net-works. In Proceedings of the 16th international conference on World Wide Web, pages 201–210. ACM, 2007.
[61] Panagiotis Papadimitriou, Ali Dasdan, and Hector Garcia-Molina. Web graph similarity for anomaly detection. Journal of Internet Services and Applications, 1(1):19–30, 2010.
[62] Evangelos E Papalexakis, Christos Faloutsos, and Nicholas D Sidiropoulos. Parcube: sparse parallelizable tensor decompositions. In Machine Learning and Knowledge Discovery in Databases, pages 521–536. Springer, 2012. [63] Brandon Pincombe. Anomaly detection in time series of graphs using arma
processes. ASOR BULLETIN, 24(4):2, 2005.
[64] Carey E Priebe, John M Conroy, David J Marchette, and Youngser Park. Scan statistics on enron graphs. Computational & Mathematical Organization The-ory, 11(3):229–247, 2005.
[65] Arvind Ramanathan, Pratul K Agarwal, Maria Kurnikova, and Christopher J Langmead. An online approach for mining collective behaviors from molec-ular dynamics simulations. Journal of Computational Biology, 17(3):309–324, 2010.
[66] Matthew J Rattigan and David Jensen. The case for anomalous link discovery. ACM SIGKDD Explorations Newsletter, 7(2):41–47, 2005.
[67] Haakon Ringberg, Augustin Soule, Jennifer Rexford, and Christophe Diot. Sen-sitivity of pca for traffic anomaly detection. ACM SIGMETRICS Performance Evaluation Review, 35(1):109–120, 2007.
[68] Jorma Rissanen. Modeling by shortest data description. Automatica, 14(5):465–471, 1978.
[70] Ryan A. Rossi, Brian Gallagher, Jennifer Neville, and Keith Henderson. Mod-eling dynamic behavior in large evolving graphs. InProceeding of the 6th ACM International Conference on Web Search and Data Mining (WSDM), pages 667–676, 2013.
[71] Venkatesh Saligrama and Zhu Chen. Video anomaly detection based on lo-cal statistilo-cal aggregates. In2012 IEEE Conference on Computer Vision and Pattern Recognition (CVPR), pages 2112–2119. IEEE, 2012.
[72] Nagiza F Samatova, William Hendrix, John Jenkins, Kanchana Padmanabhan, and Arpan Chakraborty. Practical Graph Mining with R. CRC Press, 2013. [73] Jimeng Sun, Christos Faloutsos, Spiros Papadimitriou, and Philip S Yu.
Graph-scope: parameter-free mining of large time-evolving graphs. In Proceedings of the 13th ACM International Conference on Knowledge Discovery and Data Mining (SIGKDD), San Jose, CA, pages 687–696. ACM, 2007.
[74] Jimeng Sun, Spiros Papadimitriou, and S Yu Philip. Window-based tensor anal-ysis on high-dimensional and multi-aspect streams. InProceedings of the 6th IEEE International Conference on Data Mining (ICDM), Hong Kong, China, vol-ume 6, pages 1076–1080, 2006.
[75] Jimeng Sun, Dacheng Tao, and Christos Faloutsos. Beyond streams and graphs: dynamic tensor analysis. InProceedings of the 12th ACM International Conference on Knowledge Discovery and Data Mining (SIGKDD), Philadelphia, PA, pages 374–383. ACM, 2006.
[76] Jimeng Sun, Yinglian Xie, Hui Zhang, and Christos Faloutsos. Less is more: Compact matrix decomposition for large sparse graphs. InProceedings of the 7th SIAM International Conference on Data Mining (SDM), Minneapolis, MN. SIAM, 2007.
[77] Chayant Tantipathananandh and Tanya Berger-Wolf. Constant-factor approxi-mation algorithms for identifying dynamic communities. InProceedings of the 15th ACM International Conference on Knowledge Discovery and Data Mining (SIGKDD), Paris, France, pages 827–836, New York, NY, USA, 2009. ACM. [78] Chayant Tantipathananandh and Tanya Berger-Wolf. Finding communities in
dynamic social networks. InProceedings of the 11th IEEE International Con-ference on Data Mining (ICDM), Vancouver, Canada, pages 1236–1241. IEEE, 2011.
[80] Brian Thompson and Tina Eliassi-Rad. Dapa-v10: Discovery and analysis of patterns and anomalies in volatile time-evolving networks. InNotes of the 1st Workshop on Information in Networks (WIN), 2009.
[81] Hanghang Tong, Spiros Papadimitriou, Jimeng Sun, Philip S Yu, and Christos Faloutsos. Colibri: fast mining of large static and dynamic graphs. In Proceed-ings of the 14th ACM International Conference on Knowledge Discovery and Data Mining (SIGKDD), Las Vegas, NV, pages 686–694. ACM, 2008.
[82] Lam Tran, Carmeliza Navasca, and Jiebo Luo. Video detection anomaly via low-rank and sparse decompositions. In Image Processing Workshop (WNYIPW), 2012 Western New York, pages 17–20. IEEE, 2012.
[83] Ledyard R Tucker. Some mathematical notes on three-mode factor analysis. Psychometrika, 31(3):279–311, 1966.
[84] Heng Wang, Minh Tang, Youngser Park, and Carey E Priebe. Locality statistics for anomaly detection in time series of graphs. arXiv preprint arXiv:1306.0267, 2013.
[85] Jing Xu and Christian R Shelton. Intrusion detection using continuous time bayesian networks. Journal of Artificial Intelligence Research, 39(1):745–774, 2010.
[86] Weiren Yu, Charu C Aggarwal, Shuai Ma, and Haixun Wang. On anomalous hotspot discovery in graph streams. InProceedings of the 13th IEEE Interna-tional Conference on Data Mining (ICDM), Dallas, Texas, 2013.
Figure 1: Three snapshots of a dynamic graph, where the nodes are plotted in a 2-dimensional space based on features extracted. At time step 1, all of the nodes belong to the same community, indicated by the blue circle, and are hence not anomalies (blue points). At time steps 2 and 3, the distribution of feature values for the community shifts, however, some nodes do not obey this pattern and are marked as anomalous (red crosses).
0.5 0.45
0.85 0.22
0.45 0.48
0.90 0.77
0.47 0.93
0.87 0.23
0.51 0.47
0.88 0.20
1 1 1 1
2
3
4 2 4 2 4 2 4
3 3 3
t = 1 t = 2 t = 3 t = 4
0.49 0.50
0.91 0.18 1
2 4
3 t = 5
Figure 2: An illustration of anomalous edges that occur due to an irregular pattern of their weight over time, with anomalous edges highlighted. At each time step a node’s weight typically shifts by±0.05at most. However, edge(3,4)has a spike in its weight at time step 2, unlike any other time in the graph. Similarly, at time step 3, edge(1,4)
Table 1 Summary of methods and the type of problems they solve.
Paper Node Edge Subgraph Event/Change Year
COMMUNITY
Duan et. al. [25] X 2009
Aggarwal et. al. [3] X 2012
Chen et. al. [19] X 2012
Gupta et. al. [35] X 2012
Gupta et. al. [34] X 2012
Chen et. al. [18] X 2013
Gupta et. al. [33] X 2013
Ji et. al. [44] X 2013
Rossi et. al. [70] X 2013
COMPRESSION
Chakrabarti et. al. [13] X 2004
Sun et. al. [73] X 2007
DECOMPOSITION
Ide et. al. [42] X X 2004
Lakhina et. al. [50] X 2004
Sun et. al. [74] X X X 2006
Sun et. al. [75] X X X 2006
Sun et. al. [76] X X X 2007
Kolda et. al. [46] X X X 2008
Tong et. al. [81] X X X 2008
Akoglu et. al. [5] X X 2010
Ishibashi et. al. [43] X 2010
Jiang et. al. [45] X X 2011
Koutra et. al. [48] X X X 2012
Miller et. al. [54] X X 2012
Papalexakis et. al [62] X X X 2012
Miller et. al. [55] X X 2013
Table 2 Summary of methods and the type of problems they solve (continued).
Paper Node Edge Subgraph Event/Change Year
DISTANCE
Pincombe [63] X 2005
Li et. al. [52] X 2009
Abello et. al. [1] X X X 2010
Papadimitriou et. al. [61] X 2010
Arackaparambil et. al. [7] X 2011
Le et. al. [51] X 2011
Berlingerio et. al. [10] X 2012
He et. al. [38] X 2012
Malliaros et. al. [53] X 2012
Koutra et. al. [49] X 2013
Mongiovi et. al. [57] X 2013
PROBABILISTIC
Priebe et. al. [64] X X 2005
Huang et. al. [41] X X 2006
Pandit et. al. [60] X 2007
Hirose et. al. [40] X X 2009
Thompson et. al. [80] X 2009
Heard et. al. [39] X X X 2010
Neil et. al. [58] X 2011
Djidjev et. al. [24] X 2011
(a) Shrunken community
(b) Split community
Figure 3: Two different types of anomalous subgraphs. A shrunken community is shown in Figure 3a, where a community looses members from one time step to the next. A split community is shown in Figure 3b, where a single community breaks into several distinct smaller communities.
1 2 4 5 6 3 1 2 4 5 6 3
t = 1 t = 2
1 2 4 5 6 3
t = 3
1 2 4 5 6 3
t = 4
1 2 4 5 6 3
t = 5
(a) Event detection 1 2 4 5 6 3 1 2 4 5 6 3
t = 1 t = 2
1 2 4 5 6 3
t = 3
1 2 4 5 6 3
t = 4
1 2 4 5 6 3
t = 5
(b) Change detection
Figure 4: An example of an event, a change, and the difference between them. In both Figure 4a and Figure 4b the graphs initially have only a few edges. At time step