20th International Conference on Structural Mechanics in Reactor Technology (SMiRT 20) Espoo, Finland, August 9-14, 2009 SMiRT 20-Division 4, Paper 3190
Analysis of the strong motion records obtained from the 2007 Niigataken
Chuetsu-oki earthquake and determination of the design basis ground motions
at the Kashiwazaki Kariwa Nuclear Power Plant
(Part2: Difference of site amplification based on the 2D FEM analysis of the
folded structure)
Tetsushi Watanabe
a, Takafumi Moroi
a, Masayuki Nagano
b,
Ryoichi Tokumitsu
c, Masatomo Kikuchi
c, and Isao Nishimura
ca
Kobori Research Complex, Kajima Corporation, Tokyo, Japan, e-mail: w-tetsushi@kajima.com
b
Faculty of Science and Technology, Tokyo University of Science, Chiba, Japan
c
Nuclear Asset Management Department, Tokyo Electric Power Company, Tokyo, Japan
Keywords: The Kashiwazaki Kariwa Nuclear Power Plant, Irregular Ground, 2D FEM Analysis, Folded Structure, Site Amplification, The 2007 Niigataken Chuetsu-oki Earthquake.
1
ABSTRACT
The Niigataken Chuetsu-oki earthquake, with a moment magnitude (Mw) of 6.6, occurred on 16 July 2007 in the western offshore of Niigata Prefecture in Japan. The Kashiwazaki Kariwa Nuclear Power Plant site is located about 16 km south of its epicenter. The site has seven units, with four units (Units 1-4) at south side of the site and the other three units (Units 5-7) only about 1.5km away from Units 1-4. However, the strong motion records at Unit 1 side were significantly larger than those at Unit 5 side. It is important to investigate the difference of site amplification in the local area.
In this paper, the folded structure model is constructed from boring and seismic reflection survey, and the 2D FEM analysis is performed using the folded structure. Simulation results show good agreement with the observed strong motion records at Unit 1. It is suggested that the difference of site amplification in the local area is caused by the folded structure. As results of sensitive analysis, both first and second boundaries amplify the seismic motion at Unit 1. Even if the folded structure is modelled by smooth boundary, site amplification doesn’t change so much.
2
INTRODUCTION
The Niigataken Chuetsu-oki earthquake, with a moment magnitude (Mw) of 6.6, occurred on 16 July 2007 in the western offshore of Niigata Prefecture in Japan. The Kashiwazaki Kariwa Nuclear Power Plant site is located about 16 km south of its epicenter. The site has seven units, with four units (Units 1-4) at south side of the site and the other three units (Units 5-7) only about 1.5km away from Units 1-4. However, the strong motion records at Unit 1 side were significantly larger than those at Unit 5 side.
Three asperities are defined by the waveform source inversion in the 2007 Niigataken Chuetsu-oki earthquake. The third asperity caused a pulse in the latter part of the waveform, and it determined the difference in the strong motion records between Unit 1 and Unit 5 [Tokumitsu et al. (2009)].
3
MODELING OF THE 2D FOLDED STRUCUTURE
Past geological survey indicates that the folded structure exists in and around the site, and the Madonosaka syncline runs along the direction of north 55 degrees east. Soil structure probably has continuity of shape in this direction, and 2D models orthogonal to the syncline are made at Unit 1 side and Unit 5 side respectively.
Figure 1 illustrates location of the site and the fault plane, and Figure 2 shows positions of 2D model sections.
Figure 1. Location of the site and the fault plane Figure 2. Positions of 2D model sections
Boundaries of strata are evaluated based on the latest seismic reflection and boring survey [Kobayashi et al. (1995)], and confirmed by balanced cross section method. The model is about 7.6km wide and 4.8km deep, and consists of seven strata, Nishiyama stratum, Shiiya stratum, Upper Teradomari stratum, Lower Teradomari stratum, Nanatani stratum, Green tuff, and Seismic bed rock.
Figure 3 shows 2D folded structure models at Unit 1 side and Unit 5 side. The models have irregular structure with the fold of upper three boundaries and with the slope of lower three ones. Unit 1 is located above the syncline, while Unit 5 is located above the anticline.
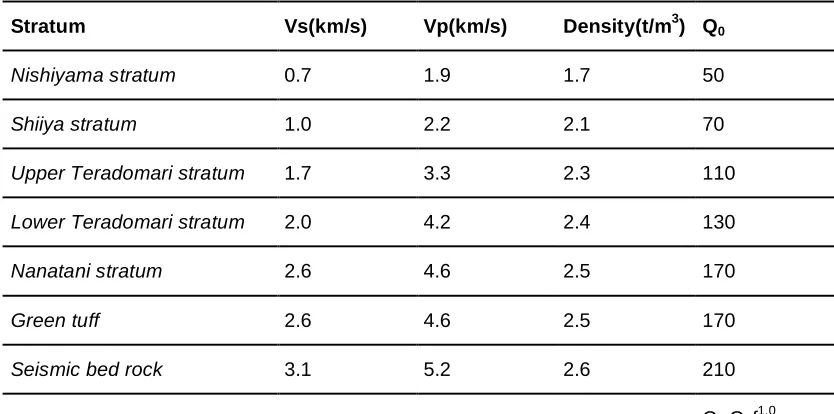
Soil properties are estimated by inversion analysis using PS converted wave, as presented in Table 1. S-wave velocities are 0.7, 1.0, 1.7, 2.0, 2.6, 2.6, and 3.1km/s. These velocities correspond with the model based on microtremor array observation.
Table 1. Soil properties
Stratum Vs(km/s) Vp(km/s) Density(t/m3) Q0
Nishiyama stratum 0.7 1.9 1.7 50
Shiiya stratum 1.0 2.2 2.1 70
Upper Teradomari stratum 1.7 3.3 2.3 110
Lower Teradomari stratum 2.0 4.2 2.4 130
Nanatani stratum 2.6 4.6 2.5 170
Green tuff 2.6 4.6 2.5 170
Seismic bed rock 3.1 5.2 2.6 210
Q=Q0f1.0
4
FUNDAMENTAL CHARACTERISTICS OF SITE AMPLIFICATION
Numerical analysis is performed by finite element method (FEM) in frequency domain. Energy transmitting boundary and viscous boundary are used on side and bottom of the model [Nagano and Motosaka (1995)]. Finite elements are created for the target frequency of 5Hz.
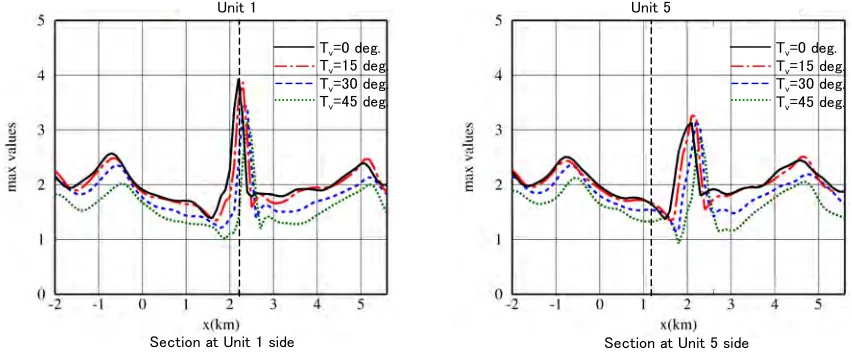
In order to grasp fundamental characteristics of site amplification, parametric studies are conducted on vertical incident angles of oblique S-wave inside the 2D model section. Figure 4 shows comparison of transfer functions between 2D model and 1D model, and Figure 5 shows maximum response value on the surface of the 2D model for Ricker wavelet input with central period of 0.6s. Their results show that site amplification of 2D model at Unit 1 is larger than that of 1D model directly under Unit 1 when the angle is closer to 0 degrees (vertical incidence). However, site amplification of 2D model at Unit 5 generally corresponds to that of 1D model, and isn’t sensitive to incident angles. The irregularity of subsurface structure has a greater impact on Unit 1.
Figure 4. Comparison of transfer functions between 2D model and 1D model (Section parallel response for SV wave
Figure 5. Maximum response value on the surface of the 2D model for Ricker wavelet input with central period of 0.6s
(Section parallel response for SV wave with Th=90deg. )
5
SIMULATION ANALYSIS
The positions of asperities are located outside the 2D model section as shown in Figure 1, and simulation analysis is performed considering horizontal incident angles in addition to vertical incident angles. Oblique incident waves with horizontal angles generate 3D response of the 2D model. Concerning the vertical incident angle projected on the 2D model section, the third asperity has the smallest angle in the three asperities.
Figure 6 shows contours of transfer functions on the surface of the 2D model. The location of Unit 5 is away from the peak of amplification for all asperities. For the first and second asperities, the location of Unit 1 is slightly away from the peak of amplification. For the third asperity, Unit 1 overlaps with the peak of amplification. Site amplification at Unit 1 is larger than that at Unit 5. This feature is similar to fundamental characteristics mentioned above.
Waveform simulation is carried out using these three transfer functions and the Unit 5 records as control motions. Responses of each unit and input motions of the control point (see Figure 3) are related through transfer functions as below.
! " # $ % & ' ( ) * + , = ! " # $ % & 0 0 H V EHi EVi NHi NVi Ei Ni U U S S S S U U (1) where Ni
U : response of Unit i in Plant North direction.
Ei
U : response of Unit i in Plant East direction.
NVi
S : transfer function of Unit i in Plant North direction for SV wave.
EVi
S : transfer function of Unit i in Plant East direction for SV wave.
NHi
S : transfer function of Unit i in Plant North direction for SH wave.
EHi
S : transfer function of Unit i in Plant East direction for SH wave.
0 V
U : SV wave input motion.
0 H
Input motions are calculated from transfer functions of Unit 5 and responses of Unit 5 as control motions. Then responses of Unit 1 are evaluated from transfer functions of Unit 1 and input motions.
Figure 7 shows velocity waveforms of simulation analysis filtered from 0 to 5Hz. The results show good agreement with the Unit 1 records, including the pulse from the third asperity. It is estimated that folded structure caused difference in strong motion records in the local area.
Figure 6. Contours of transfer functions on the surface of the 2D model
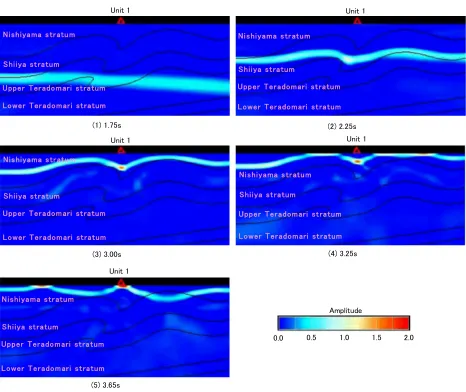
Figure 8 shows snapshots at Unit 1 side for Ricker wavelet input with central period of 0.6s. The results are described below.
(1) The shape of plane waves does not change up to Upper Teradomari stratum.
(2) Upgoing waves concentrate on the syncline through Upper Teradomari stratum.
(3) The concentration increases through Shiiya stratum.
(4) It moves toward Unit 1.
(5) Site amplification becomes significant at Unit 1.
Figure 8. Snapshots at Unit 1 side for Ricker wavelet input with central period of 0.6s (Section normal response for SV wave from the third asperity with Tv=45deg. and Th=15deg.)
6
SENSITIVITY ANALYSIS OF THE FOLDED STRUCUTRE
It is estimated which part of the folded structure affects site amplification in this capter.
A soil property of a certain stratum is replaced with other one, and the effect of an arbitrary boundary is extracted. Figure 9 and Figure 10 show models and comparison of transfer functions. Transfer functions of model B and model C are smaller than those of model A, but model D and model A show similar transfer functions. Therefore, both first and second boundaries amplify the seismic motion at Unit 1.
Figure 9. Models for sensitivity analysis about boundaries of the folded structure at Unit 1 side
Figure 11. Models for sensitivity analysis about smoothness of the folded structure at Unit 1 side
Figure 12. Comparison of transfer functions in sensitivity analysis about smoothness of the folded structure (Section normal response for SV wave from the third asperity with Tv=45deg. and Th=15deg.)
7
CONCLUSION
The 2D FEM analysis is performed using the folded structure, and simulation results show good agreement with the observed strong motion records at Unit 1. It is suggested that the difference of site amplification in the local area is caused by the folded structure. As results of sensitive analysis, both first and second boundaries amplify the seismic motion at Unit 1. Even if the folded structure is modelled by smooth boundary, site amplification doesn’t change so much.
REFERENCES
Iwao Kobayashi, Masaaki Tateishi, Naohisa Yoshimura, Tetsuro Ueda, and Hirokazu Kato, Geology of the Kashiwazaki region, Geological Survey of Japan, 1995
Masayuki Nagano and Masato Nagano, Response analysis of 2D structure subjected to obliquely incident waves with arbitrary horizontal angles, Transactions of AIJ, Journal of structural and construction engineering, No.474, pp.67-76, 1995