Procedia - Social and Behavioral Sciences 116 ( 2014 ) 4338 – 4343
1877-0428 © 2013 The Authors. Published by Elsevier Ltd. Open access under CC BY-NC-ND license.
Selection and/or peer-review under responsibility of Academic World Education and Research Center. doi: 10.1016/j.sbspro.2014.01.943
ScienceDirect
5
thWorld Conference on Educational Sciences - WCES 2013
Developing Statistical Reasoning Assessment Instrument for High
School Students in Descriptive Statistics
Shiau Wei Chan
a*, Zaleha Ismail
baPh.D, University of Technology Malaysia, 81310 Skudai, Johor, Malaysia bAssociate Professor, University of Technology Malaysia, 81310 Skudai, Johor, Malaysia
Abstract
In recent years, there has been a growing focus on central statistical ideas or ‘big ideas’ in statistical reasoning such as centre, distribution, and variability in research studies. To date, however, there is a paucity of assessments that integrate three statistical reasoning using information technology, i.e. reasoning about centre, spread, and distribution for high school students. Thus, a statistical reasoning assessment instrument concerning these domains is developed in order to enhance tenth-grade students’ statistical reasoning abilities during the instruction. Its content was validated by three experts in related fields. There are five statistical reasoning tasks in the assessment instrument which have been created based on the initial statistical reasoning framework. Each item is associated with the sub-processes of four key constructs, i.e. describing data, organizing and reducing data, representing data, and analyzing and interpreting data. The dynamic spreadsheet of GeoGebra software is used as a technological tool in solving tasks. This statistical reasoning assessment instrument can be utilized by instructors and researchers for further investigation in future studies.
1. Introduction
In 1990s, statistics assessment moved from ‘testing’ to focus on ‘assessment’ and this included statistical thinking, statistical reasoning and statistical literacy. In other words, the focus has shifted to understand statistical concepts and learn to reason statistically rather than merely using the required computations and formula (Slauson, 2008; Hulsizer & Woolf, 2009; Makar & Rubin, 2009; Garfield & Franklin, 2011; Qian, 2011). This reformation occurred because some traditional forms of assessments such as true or false and multiple choice examinations are too restrictive in assessing students’ learning outcomes. Also, these assessments cannot provide a clear picture of the students’ understanding and extent of knowledge in statistics. In addition, such assessment in the 1990s were not designed to align with curriculum and instructional goals (Ben-Zvi, 1999; Garfield & Gal, 1999; Garfield, 2003). Assessment is a vital part of the learning process (Dikli, 2003; Usun, 2003) and it is also a mean to make students’ reasoning ability observable (Garfield & Ben-Zvi, 2008b). Thus, new types of assessment or instrument have to be developed to assess the efficiency of didactic methods and syllabus as well as to investigate the growth of statistical
* Corresponding author name. Shiau Wei ChanTel.: +6-012-7811269 E-mail address: [email protected]
Keywords: statistical reasoning, assessment instrument, descriptive statistics
© 2013 The Authors. Published by Elsevier Ltd. Open access under CC BY-NC-ND license.
reasoning ability among students (Garfield, 2003; Garfield & Ben-Zvi, 2008b). In addition to that, nowadays, the utilization of information technology in related assessment has becoming increasingly important as well in promoting pedagogical innovation and curriculum reform (Csapo et al., 2010). Chan and Ismail (2012) also stated that information technology can augment students’ statistical reasoning.
There are already some types of statistical reasoning assessments available in the market, for instance the statistical reasoning assessment (SRA), Assessment Resource Tools for Improving Statistical Thinking (ARTIST), Comprehensive of Assessment of Outcomes in a First Statistics Course (CAOS) and so forth. Garfield (2003) customized a SRA to evaluate the statistical reasoning ability in statistics and probability for high school students. Nevertheless, it is not appropriate for Malaysian high school students because they do not study some of the topics enlisted in the assessment, such as correlation and causation. In addition, this customized SRA is a paper-and-pencil assessment that does not employ any technological tools.
Recent researchers and instructors have started to focus on central statistical ideas or ‘big ideas’ in teaching and learning statistics (Garfield & Ben-Zvi, 2007; Garfield & Ben-Zvi, 2008a). However, the inclusion of these central statistical ideas into assessment is still scarce and many cannot see how the ideas are interconnected (Garfield & Ben-Zvi, 2009). Thus, in this study, three statistical reasoning have been integrated into an assessment instrument, i.e. reasoning about centre, spread, and distribution. In addition, elements of dynamic spreadsheets have also been incorporated into the assessment to create a technology-based statistical reasoning assessment instrument.
2. Statistical Reasoning
Statistical reasoning is defined as “the way people reason with statistical ideas and make sense of statistical information. It involves making interpretations based on sets of data or statistical summaries of data where students need to combine ideas about data and chance to make inferences and interpret statistical results” (Garfield & Chance, 2000, p.101) . Lovett (2001) claimed that statistical reasoning entails the usage of statistical ideas and tools to summarize the situation, draw assumptions and make conclusions from the data. Besides that, Martin (2009) described statistical reasoning as ‘forming conclusions and judgments according to the data from observational studies, experiments or sample surveys’.
There are three types of reasoning commonly incorporated into the statistical reasoning assessment instrument, namely reasoning about centre, spread, and distribution. Reasoning about centre concerns data analysis that involves mean, mode, and median. Meanwhile, reasoning about spread involves range, inter quartile range, variance, and standard deviation. Reasoning about distribution entails interpreting a compound structure that is comprised of reasoning about features such as centre, spread, skewness, density and outliers as well as other concepts such as causality, chance, and sampling (Pfannkuch & Reading, 2006).
3. Statistical Reasoning Assessment Instrument
system, reducing the data using the measure of centre either by calculation or aided by technology, and reducing the data using the measure of spread either by calculation or aided by technology.
Furthermore, representing data consists of presenting data in a graphical form and involves the basic conventions related to the representations (Jones, et al., 2000). There are three sub-processes in this study, i.e. demonstrating the data sets graphically using the computer, identifying the different representations for the same data set, and judging the effectiveness of two different representations for the same data. Moreover, analyzing and interpreting data entails recognizing trends and patterns as well as formulating deduction or presumption from the data (Jones et al., 2000). It also consists of reading between and beyond the data.In this study, there are three sub-processes for analysing and interpreting data, notably making comparisons within the same data set, making comparisons between two different data sets, and making prediction, inference or conclusion from the data or graphs.
In this instrument, Geo Gebra dynamic spreadsheet was used as the technological tool. GeoGebra is one of the dynamic mathematics software which can be downloaded free-of-charge from the internet as it is categorized as open source software. Geo Gebra runs on Java application and is designed to integrate certain elements of computer algebra systems, dynamic geometry software and spreadsheet. It allows the user to visualize the multiple representations of data in the algebra window, graphics window and spreadsheet view, thereby promotes their conceptual understanding in statistics (Preiner, 2008). Dynamic spreadsheet of Geo Gebra enables user to create dynamic worksheets in the form of interactive web page that can utilized online (Hohenwarter & Preiner, 2007). The dynamic worksheets are accessible on the internet even when the Geo Gebra software is not installed in the computer (Velichova, 2011).
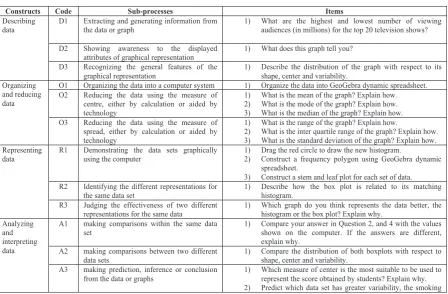
Table 1. Examples of Items in the sub-processes for four constructs
Constructs Code Sub-processes Items
Describing
data D1 Extracting and generating information from the data or graph 1) What are the highest and lowest number of viewing audiences (in millions) for the top 20 television shows?
D2 Showing awareness to the displayed
attributes of graphical representation 1) What does this graph tell you? D3 Recognizing the general features of the
graphical representation
1) Describe the distribution of the graph with respect to its shape, center and variability.
Organizing and reducing data
O1 Organizing the data into a computer system 1) Organize the data into GeoGebra dynamic spreadsheet. O2 Reducing the data using the measure of
centre, either by calculation or aided by technology
1) What is the mean of the graph? Explain how. 2) What is the mode of the graph? Explain how. 3) What is the median of the graph? Explain how. O3 Reducing the data using the measure of
spread, either by calculation or aided by technology
1) What is the range of the graph? Explain how.
2) What is the inter quartile range of the graph? Explain how. 3) What is the standard deviation of the graph? Explain how. Representing
data
R1 Demonstrating the data sets graphically using the computer
1) Drag the red circle to draw the new histogram.
2) Construct a frequency polygon using GeoGebra dynamic spreadsheet.
3) Construct a stem and leaf plot for each set of data. R2 Identifying the different representations for
the same data set 1) Describe how the box plot is related to its matching histogram. R3 Judging the effectiveness of two different
representations for the same data 1) Which graph do you think represents the data better, the histogram or the box plot? Explain why. Analyzing
and interpreting data
A1 making comparisons within the same data
set 1) Compare your answer in Question 2, and 4 with the values shown on the computer. If the answers are different, explain why.
A2 making comparisons between two different
data sets 1) Compare the distribution of both boxplots with respect to shape, center and variability. A3 making prediction, inference or conclusion
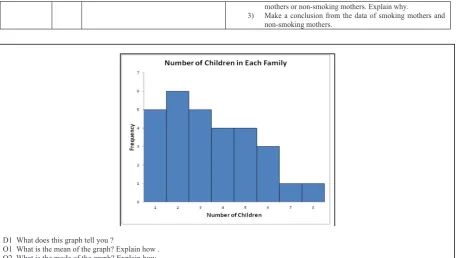
D1 What does this graph tell you ?
O1 What is the mean of the graph? Explain how . O2 What is the mode of the graph? Explain how. O3 What is the median of the graph? Explain how.
R1 Draw the graph using GeoGebra dynamic worksheet by dragging the red circle. Tick the check box of Show histogram, Show mean and Show median.
A1 Compare your answer in Question O1 and O3 with the values shown on the computer. If the answers are different, explain why. O4 What is the range of the graph? Explain how.
O5 What is the inter quartile range of the graph? Explain how. O6 What is the standard deviation of the graph? Explain how. R2 Tick the check box of Show IQR and Show Std Dev.
A2 Compare your answer in Question O5 and O6 with the values shown on the computer. If the answers are different, explain why. A3 Describe the distribution of the graph with respect to its shape, centre and variability.
One family with 11 children is added.
O7 Record the values of the mean, median, inter quartile range, and standard deviation from the computer. A4 What do you observe? Is there any change? Explain why.
A5 Which measure of centre is the most suitable to be used to represent the number of children in each family? Explain why. A6 Which measure of spread is the most suitable to be used to represent the number of children in each family? Explain why.
Figure 1. Task 1
In task 1, students are required to obtain the information from histogram in Question D1. Besides that, they have to understand and use the concepts of mean, mode, and median of ungrouped data in Question O1, O2, O3, R1, and A1. Furthermore, in Question O4, O5, O6, R2, and A2, students need to understand and use the concepts of range, inter quartile range and standard deviation of ungrouped data. Moreover, Question A3 necessitates students to understand how the concepts of centre , spread and distribution are related. Meanwhile, Question O7 and A4 ask students to determine an outlier in the data set. Lastly, students have to identify the most suitable measures of centre and spread for the given data in Question A5 and A6.
mothers or non-smoking mothers. Explain why.
4. Conclusion
In this study, a technology-based statistical reasoning assessment instrument was developed for high school students in descriptive statistics. Instructors and researchers can use this instrument in future studies to improve students’ statistical reasoning ability according to their gender, culture, educational background and so forth.
Acknowledgements
We gratefully acknowledge the guidance and assistance given by Associate Professor Robert C. delMas, Associate Professor Edward Mooney and Dr Chris Reading for their help to review and validate the content of statistical reasoning assessment instrument. This research was supported by the Research University Grant of University of Technology Malaysia and the Ministry of Higher Education of Malaysia (Vote No: Q.J130000.7131.01H66).
References
Ben-Zvi, D. (1999). Alternative assessment in statistics education. Proceedings of the 52nd Session of the International Statistical Institute, III,
175–176. Helsinki, Finland: Edita Ltd.
Chan, S.W., & Zaleha Ismail (2012). The Role of Information Technology in Developing Students’ Statistical Reasoning. Procedia-Social and Behavioral Sciences, 46, 3660-3664.
Csapó, B., Ainley, J., Bennett, R., Latour, T., & Law, N. (2010). Draft White Paper 3: Technological Issues for Computer-Based Assessment. Assessment and Teaching of 21st Century Skills, The University of Melbourne, Australia. Retrieved on 14 July 2012, fromhttp://atc21s.org/wp-content/uploads/2011/11/3-Technological-Issues.pdf
Curcio, F.R. (1981). The Effect of Prior Knowledge, Reading and Mathematics Achievement, and Sex on Comprehending Mathematical Relationships expressed in Graphs. Brooklyn, NY: St. Francis College.
Curcio, F.R. (1987). Comprehension of Mathematical Relationships expressed in Graph. Journal for Research in Mathematics Education, 18(5), 382-393.
Curcio, F.R., & Artz, A.F. (1997). Assessing Students’ Statistical Problem Solving BehavioursS in Small-group Setting. In Gal, I., & Garfield, J.B. (Eds.) The Assessment Challenge in Statistics Education (pp. 123-138). Amsterdam: IOS Press.
Dikli, S. (2003). Assessment at a Distance: Traditional vs. Alternative Assessments. The Turkish Online Journal of Educational Technology, 2(3), 13-19.
Garfield, J. (2003). Assessing Statistical Reasoning. Statistics Education Research Journal, 2(1), 22-38.
Garfield, J., & Ben-Zvi, D. (2007). How Students Learn Statistics Revisited: A Current Review of Research on Teaching and Learning Statistics. International Statistical Review, 75(3), 372-396.
Garfield, J., & Ben-Zvi, D. (2009). Helping Students Develop Statistical Reasoning: Implementing a Statistical Reasoning Learning Environment. Teaching Statistics, 31(3), 72-77.
Garfield, J., and Chance, B. (2000). Assessment in Statistics Education: Issues and Challenges. Mathematical Thinking and Learning, 2(1&2), 99-125.
Garfield, J., & Franklin, C. (2011). Assessment of Learning, for Learning, and as Learning in Statistics Education. In Batanero, C., Burrill, G., & Reading, C. (Eds.). Teaching Statistics in School Mathematics-Challenges for Teaching and Teacher Education: A Joint ICMI/IASE Study (pp. 133-145). Springer.
Garfield, J.B., & Ben-Zvi, D. (2008a). Research on Teaching and Learning Statistics. In Garfield, J.B., & Ben-Zvi, D. (Eds.) Developing Students’ Statistical Reasoning: Connecting Research and Teaching Practice (pp. 21-43). Springer.
Garfield, J.B., & Ben-Zvi, D. (2008b). Assessment in Statistics Education. In Garfield, J.B., & Ben-Zvi, D. (Eds.) Developing Students’ Statistical Reasoning: Connecting Research and Teaching Practice (pp. 65-89). Springer.
Garfield, J.B., & Gal, I. (1999). Assessment and Statistics Education: Current Challenges and Directions. International Statistical Review, 67(1), 1-12.
Hohenwarter, M., and Preiner, J. (2007). Creating Mathlets with Open Source Tools. The Journal of Online Mathematics and its Applications, 7. Retrieved on 1 May, 2012, from http://www.maa.org/joma/volume7/hohenwarter2/2007_joma_mathlets.pdf
Hulsizer, M.R., & Woolf, L.M. (2009). A Guide to Teaching Statistics: Innovations and Best Practices. Malden, MA: Wiley-Blackwell. Jones, G.A., Thornton, C.A., Langrall, C.W., Mooney, E.S., Perry, B., & Putt, I.A. (2000). A Framework for Characterizing Children’s
Statistical Thinking. Mathematical Thinking and Learning, 2, 269-307.
Makar, K.,& Rubin, A. (2009). A Framework for Thinking about Informal Statistical Inference. Statistics Education Research Journal, 8(1), 82-105.
Martin, G. (2009). Focus in School Mathematics: Reasoning and Sense Making. National Council of Teachers of Mathematics. Moore, D.S. (1997). Statistics: Concepts and Controversies (4th Ed.). New York: Freeman.
Pfannkuch, M., & Reading, C. (2006). Reasoning about Distribution: A Complex Process. Statistics Education Research Journal, 5(2), 4-9. Preiner, J. (2008). Introducing Dynamic Mathematics Software to mathematics Teachers: The Case of GeoGebra. Doctor Philosophy, University
of Salzburg, Austria.
Qian, G. (2011). Teaching, Learning and Retention of Statistical Ideas in Introductory Statistics Education. European Journal of Pure and Applied Mathematics, 4(2), 103-116.
Slauson, L.V. (2008). Students’ Conceptual Understanding of Variability. Doctor Philosophy, The Ohio State University.
Usun, S. (2003). Advantages of Computer Based Educational Technologies for Adult Learners. The Turkish Online Journal of Educational Technology, 2(4), 3-9.