An Investigation on the Relationship between Land Use Composition and PM10
Pollution in Iskandar Malaysia
Muhammad Azahar Zikri Zahari1*, Mohammad Rafee Majid2, and Ho Chin Siong3 1
Graduate Student, UTM-Low Carbon Asia Research Centre, Faculty of Built Environment, Universiti Teknologi Malaysia, Johor, Malaysia. Email: zikloose@gmail.com
2
Associate Professor, UTM-Low Carbon Asia Research Centre, Faculty of Built Environment, Universiti Teknologi Malaysia, Johor, Malaysia. Email: rafee@utm.my
3
Professor, UTM-Low Carbon Asia Research Centre, Faculty of Built Environment, Universiti Teknologi Malaysia, Johor, Malaysia. Email: ho@utm.my
*
Corresponding author.
ABSTRACT
This paper discusses the relationship between land use composition and the degree of air pollution, specifically PM10, in Iskandar Malaysia. Aspires to be a low carbon region and a smart city, Iskandar Malaysia has to meet the social and economic needs of its growing population while taking care of all the environmental challenges that come with rapid urbanization. The occurrence of regional haze episodes in the past has shrouded this region with particulate matters including PM10, but the major cause of the haze was extensive agricultural open burning rather than land use change. Since there is no doubt land use change itself can be a significant contributor to local PM10 concentration, separating PM10 caused by the local (land use change) source from that of the regional source would enable us to investigate the trend in local PM10 pollution level. Therefore, a study on the Iskandar Malaysia’s PM10 readings for the years 2002, 2006 and 2008 was carried out with the aim to identify the relationship between land use composition and PM10 concentration. The background concentration of the readings was extracted by using the base flow separation process commonly used in the hydrograph study. The extracted background concentration was then interpolated with the Terra MODIS level 2 product to identified the PM10 concentration for the whole Iskandar Malaysia region, spatially. Since data for land use changes are compositional data in nature, where the percentages of different land use coverages always add up to unity, the barycentric or ternary plot had been used to investigate the relationship between PM10 concentrations with the land use composition (urban:agriculture:forest) in Iskandar Malaysia. The results show that air quality as represented by PM10 concentrations are inevitably linked to the land use changes at the local level notwithstanding the more noticeable but intermittent influence of the regional haze episodes. The degree of air pollution is noticeably controlled by the percentage of urban land use with PM10 clearly affected by the size of commercial area.
KEYWORDS
PM10, land use composition, remote sensing, Iskandar Malaysia
1.0 Introduction
indicated using PM1, PM2.5, PM4 and PM10 concentrations. Focusing on PM10, Aerosol Optical Depth product of Moderate Resolution Imaging Spectroradiometer (MODIS AOD) were used in this study to verified the local particulate matter pattern, while land use changes were detected using satellite images, Landsat Thematic Mapper (1984 to 2008). Thus, this study denoted the relationship between those variables as the impact of land use changes towards air quality (PM10) in Iskandar Malaysia.
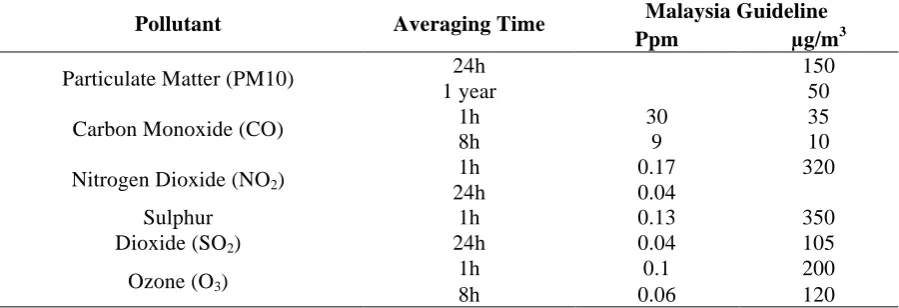
Based on the monitoring data and ambient air-quality studies, several large cities in Malaysia are faced with increasing level of air pollutants that are not always at acceptable levels (DOE, 2002). Due to this, the Department of Environment (DOE) Malaysia adopted the Air Pollutant Index (API) in order to revise their index system in 1996. The basis for the interpretation of the API had been explained in the Malaysian Ambient Air Quality Guidelines (Table 1: The “safe levels” for the listed concentration pollutant). Highlighted in this study, the average threshold limit concentrations for PM10 are 150µg/m3 and 50µg/m3 for 24-hour and 1-year averaging time respectively.
Table 1: Malaysian ambient air quality guidelines
Pollutant Averaging Time Malaysia Guideline
Ppm µg/m3
Particulate Matter (PM10) 24h 150
1 year 50
Carbon Monoxide (CO) 1h 30 35
8h 9 10
Nitrogen Dioxide (NO2) 1h 0.17 320
24h 0.04
Sulphur Dioxide (SO2)
1h 0.13 350
24h 0.04 105
Ozone (O3) 1h 0.1 200
8h 0.06 120
Source: Department of Environment, Malaysia (2002)
2.0 Method
Two main variables that had been used in this study are air pollution; denoted by PM10 readings, and land use changes; denoted by changes of land use accretion. As shown in Figure 1, those variables had been through several processes in order to clarify the relationship between air pollution and land use composition in Iskandar Malaysia. The air pollution involves two types of data which are in situ data; retrieved from Department of Environment, Malaysia (DOE), and spatial data; MODIS Aerosol Optical Depth data. Due to the limited number of monitoring stations, DOE’s in situ readings were used to interpolate with MODIS Aerosol Optical Depth value. This process is important to comprehensively speculate the whole Iskandar Malaysia region readings, spatially.
Figure 1: Method adopted in this study
3.0 Processed Data
As explained in previous section, there are several data that had been processed include the in situ data; DOE’s monitoring stations data (PM10), satellite images; LANDSAT Thematic Mapper (1984-2008), and aerosol spatial data; MODIS Aerosol Optical Depth (2002-2008). Those data were required to show the significance of the relationship between particulate matter and land use changes.
3.1 MODIS Aerosol Optical Depth (2002-2008)
The air quality monitoring stations had monitored particulate matter, but lacked information spatially, since there were only three stations. Due to this limitation, MODIS Aerosol Optical Depth data were used to interpolate and comprehensively speculated the missing values, spatially. Iskandar Malaysia, the grid of the aerosol optical depth only consisted ten out of sixteen grids that covered Iskandar Malaysia (grid dimension: 0.2 degrees by 0.2 degrees). As shown in Figure 2, Terra Atmosphere Level 2 product data were used for this process.
Figure 2: MODIS AOD grid of Iskandar Malaysia
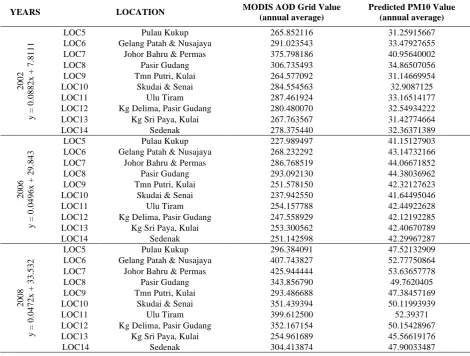
Table 2: Calculated PM10 value, predicted using MODIS AOD grid values
YEARS LOCATION MODIS AOD Grid Value
(annual average)
Predicted PM10 Value (annual average) 2002 y = 0. 0882x + 7. 8111
LOC5 Pulau Kukup 265.852116 31.25915667
LOC6 Gelang Patah & Nusajaya 291.023543 33.47927655
LOC7 Johor Bahru & Permas 375.798186 40.95640002
LOC8 Pasir Gudang 306.735493 34.86507056
LOC9 Tmn Putri, Kulai 264.577092 31.14669954
LOC10 Skudai & Senai 284.554563 32.9087125
LOC11 Ulu Tiram 287.461924 33.16514177
LOC12 Kg Delima, Pasir Gudang 280.480070 32.54934222
LOC13 Kg Sri Paya, Kulai 267.763567 31.42774664
LOC14 Sedenak 278.375440 32.36371389
2006 y = 0. 0496x + 29. 843
LOC5 Pulau Kukup 227.989497 41.15127903
LOC6 Gelang Patah & Nusajaya 268.232292 43.14732166
LOC7 Johor Bahru & Permas 286.768519 44.06671852
LOC8 Pasir Gudang 293.092130 44.38036962
LOC9 Tmn Putri, Kulai 251.578150 42.32127623
LOC10 Skudai & Senai 237.942550 41.64495046
LOC11 Ulu Tiram 254.157788 42.44922628
LOC12 Kg Delima, Pasir Gudang 247.558929 42.12192285
LOC13 Kg Sri Paya, Kulai 253.300562 42.40670789
LOC14 Sedenak 251.142598 42.29967287
2008 y = 0. 0472x + 33. 532
LOC5 Pulau Kukup 296.384091 47.52132909
LOC6 Gelang Patah & Nusajaya 407.743827 52.77750864
LOC7 Johor Bahru & Permas 425.944444 53.63657778
LOC8 Pasir Gudang 343.856790 49.7620405
LOC9 Tmn Putri, Kulai 293.486688 47.38457169
LOC10 Skudai & Senai 351.439394 50.11993939
LOC11 Ulu Tiram 399.612500 52.39371
LOC12 Kg Delima, Pasir Gudang 352.167154 50.15428967
LOC13 Kg Sri Paya, Kulai 254.961689 45.56619176
3.2 LANDSAT Thematic Mapper (1984-2008)
In order to measure the urbanisation process in Iskandar Malaysia, LANDSAT TM satellite images were used to differentiate the built-up area and non-built-up area. This classification derived the increased built-up area as weightage for the urbanisation process. Figure 3 showed the urbanisation process of Iskandar Malaysia (1984 to 2008), which was processed from LANDSAT TM satellite images using supervised classification in ENVI software. As shown in figure, the built-up area of Iskandar Malaysia had rapidly increased from 1990 to 1997, which evidently proved that Malaysia started rapid urbanisation during the 90’s, when the government focused on the industrial sector; increase 5712.13 acres per year. The areas of built-up areas in Iskandar Malaysia started at 29,486.33 acres during 1984, and continuously increased to include a total area of 110,050.86 acres during 2008. The process itself provided many great opportunities in the economic sector, but was still a major contributor towards air pollution.
Figure 3: Urbanisation process of Iskandar Malaysia, 1984-2008
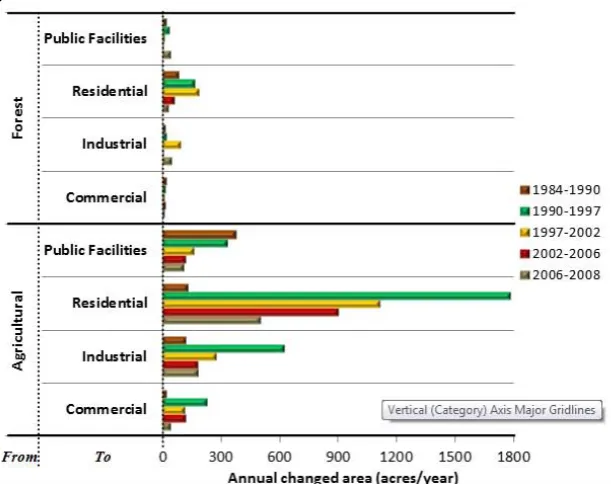
According to the extracted urbanisation process of Iskandar Malaysia, the increasing acreage of built-up area had been of significance towards particulate matter emissions. Therefore, a more detailed analysis of the built-up area was performed to analyse the effect of built-up area towards particulate matter emission. A cross-tabulation between built up area and the land use database was done to measure the land use changes periodically. Figure 4 shows land use change map of Iskandar Malaysia from 1984 to 2008. According to the measured rates of land use change, the highest rate of change was observed between 1990 and 1997; built-up area increase 5,712.13 acres per year. As a concern in this research, the land use changes were not an indicator to prove that Malaysia was growing economically, but as an indicator of land use influence towards the degradation of air quality in Iskandar Malaysia.
addition, the figure showed that there were very low practices of brown field and infill development in Iskandar Malaysia, since the major change happened from agricultural and forest, undeveloped land use types.
Figure 4: Map of land use changes in Iskandar Malaysia, 1984-2008
4.0 Analysis and Findings
As the final process in this study, the analysis of the processed data will be discussed in this section. The first analysis that had been discussed is about the correlation of the urbanisation process and the background concentration of particulate matter, which led to another analysis process. According to the research framework, the variables that were identified were the particulate matter and the composition of land use activities in Iskandar Malaysia, based on the selected years. Therefore, in order to define the relationship between those variables, the ternary plot was adapted.
4.1 Impact of Urban:Agriculture:Forest Land Use Composition on PM10
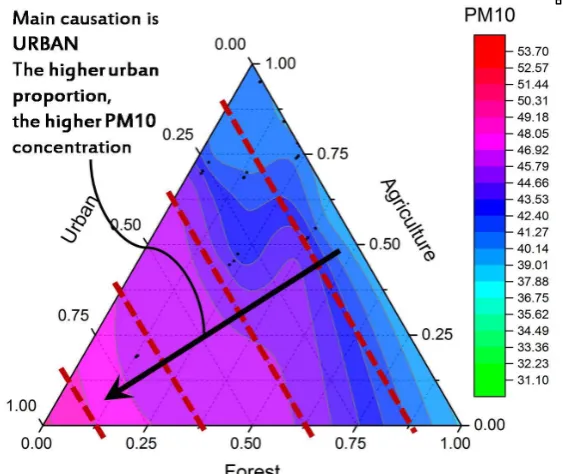
Every land use composition involved in this research was plotted against the air pollutants. As the axes are limited to only three composition, several mix composition had been considered to indicate the scenario. Figure 6 showed the pattern of PM10 for the composition of urban:agriculture:forest. The urban proportion made up the majority of urban land use in Iskandar Malaysia; consist of industrial, residential, commercial and public facilities. It was found that these air pollutants had a different pattern. According to the figure, the main causation for increasing PM10 pollution was ‘urban’. As the urban proportion increased, the annual average of PM10 concentration tended to increase. In general, this fact proved that urban activities were the main factor of PM10 local emissions in Iskandar Malaysia.
Figure 6: PM10 pattern for urban:agriculture:forest land use composition in Iskandar Malaysia
4.2 Impact of Industry:Commercial:(Residential+Public Facility) Land Use Composition on PM10
Commercial areas in Iskandar Malaysia were smaller in accretion, but higher in transportation activities. This was due to unpractised low carbon lifestyle by the community in Iskandar Malaysia. The community in Iskandar Malaysia preferred to use private vehicles rather than walking or other green modes of transportation. This was supported by the fact that commercial areas usually attracted a large number of people, in addition to transportation activities that were not environment-friendly.
Figure 7: PM10 pattern for industry:commercial:(residential+public facilities) land use composition in Iskandar Malaysia
Figure 9: PM10 pattern for (urban land use):agriculture:forest land use composition in Iskandar Malaysia.
5.0 Conclusion
As a result of data processing and analysis, several results and findings were discussed. Part of the data processing had produced the local emission index of PM10, which was very useful to spatially identify the emission of particulate matter in Iskandar Malaysia (Figure 10). From this process, the map shows higher emissions of PM10 that had been identified in urban areas, especially emissions from industrial areas such as Pasir Gudang, Johor Bahru city centre, Skudai, Senai and Kulai. Therefore, several green and low-carbon approaches should be promoted by local authorities, so that the emission index will not increase rapidly in the future.
Figure 10: Map of local PM10 emission index in Iskandar Malaysia
level, notwithstanding the more noticeable but intermittent influence of the regional haze episodes. The degree of air pollution was noticeably controlled by the percentage of urban land use, with NO2 and PM10 clearly affected by the size of commercial area, followed by industrial activities. Therefore, from those findings, several alternatives were listed in order to control air pollutant emissions.
This study had generated important findings towards the relationship between land use changes and the local emission scenario in Iskandar Malaysia. The result showed that air quality, as represented by PM10 and NO2 concentrations, was inevitably linked to land use changes at the local level, notwithstanding the more noticeable but intermittent influence of regional haze episodes. The degree of air pollution is noticeably controlled by the percentage of urban land use with PM10 clearly affected by the size of commercial area. Iskandar Malaysia, therefore, needs to be aware of the air pollution at its doorstep, while keeping an eye out for haze from neighbouring countries.
Acknowledgments
The authors gratefully acknowledge the funding support for this work provided by Ministry of Education, Malaysia and Universiti Teknologi Malaysia (UTM) under Others Grant of Vot number R.J1300000.7301.4B145 and Japan International Cooperation Agency (JICA) under the scheme of SATREPS Program (Science and Technology Research Partnership for Sustainable Development) for the project Development of Low Carbon Scenario for Asian Region.
References
Abas, M. R., Oros, D. R., & Simoneit, B. R. T. (2004). “Biomass burning as the main source of organic aerosol particulate matter in Malaysia during haze episodes”, Chemosphere, 55, 1089–1095.
Afroz, R., Hassan, M. N., & Ibrahim, N. A. (2003). “Review air pollution and health impacts in Malaysia”, Environmental Research, 92(2), 71–77.
Department of Environment (DOE), Malaysia (2008). “Malaysia environmental quality report 2008”. Kuala Lumpur: Department of Environment, Ministry of Sciences, Technology and the Environment, Malaysia.
Palatino, M. (2013). "Southeast Asia: The Great Haze of 2013", Global Voices, South-east Asia.
Radojevic, M. and Hassan, H., (1999). “Air quality in Brunei Darussalam during the 1998 haze episode”, Atmospheric Environment, 33, 3651 – 3658.
Ramanathan, V. and Carmichael G. (2008). “What Is Black Carbon”, Center for Climate and Energy Solution, Nature Geoscience, 1:221-227.
Haapala, U., (2002). “Urbanization and Water: The Stages of Development in Latin America”, South-East Asia and West Africa, Master’s Thesis, p.106.
Iskandar Region Development Authority (IRDA), (2006), “South Johor Urbanisation”, Comprehensive Development Plan, (10-1)-(10-15).
Öztürk, A., (2011), “PM10 air quality variations in urbanized areas and industrialized creek valley in Istanbul”, Geophysical Research, Vol. 13, EGU2011-12562.
Sansuddin, N., Ramli, N. A., Yahaya, A. S., MD Yusof, N. F. F., Ghazali, N. A., Al Madhoun, W. A., (2010). “Statistical analysis of PM10 concentrations at different locations in Malaysia”, Springer Science+Business Media B.V.