Int. J. Advance Soft Comput. Appl., Vol. 6, No. 2, July 2014 ISSN 2074-8523; Copyright © SCRG Publication, 2014
Feature Vector of Binary Image using
Freeman Chain Code (FCC) Representation
based on Structural Classifier
Aini Najwa Azmi and Dewi Nasien
Soft Computing Research Group, Department of Computer Science, Faculty of Computing, Universiti Teknologi Malaysia, 81110 UTM Skudai, Johor Bahru,
Johor, Malaysia
e-mail: [email protected], [email protected]
Abstract
This paper presents a recognition system for English Handwritten that utilized Freeman Chain Code (FCC) as data representation. There are 544 features were extracted from character images that used six techniques to extract the features. Before extracting the features, thinning algorithm was applied to the original image to produce a Thinned Binary Image (TBI). A feed forward back propagation neural network was used as classification. National Institute of Standards and Technology (NIST) database are used in the experiment. The accuracy yielded from the system is 87.34%.
Keywords: Handwritten Character Recognition (HCR), Thinning Algorithm, Freeman Chain Code (FCC), Feature Extraction, Artificial Neural Network (ANN)
1 Introduction
An automated character recognition system is a solution that can interpret characters automatically. The automatic recognition of characters can be extremely useful where it is necessary to process large volume of handwritten characters. HCR can be classified into three stages, which are pre-processing, feature extraction and classification. Pre-processing is involving operation to produce a clean character image and can be used directly and efficiently by the feature extraction. In feature extraction, effective and efficient features are to be selected for use in classification stage. The last stage is the classification that is the end of HCR where image character is being recognized. The success rate of the system is depending on the entire stages.
This paper is divided to six sections. Section 2 describes literature review and previous works. Section 3 describes research methodology in HCR which are pre-processing, feature extraction and classification. Section 4 describes proposed framework, Section 5 describes result and discussion and Section 6 describes conclusions, limitations and future research.
2 Literature Review
The goal of offline HCR system is to recognize and interpret input which usually optically captured from a scanner and it will available as an image. A lot of practical applications in HCR are used nowadays such as cheques processing without human involvement, reading aid for blind, automatic text entry into computer for desktop publication, library cataloguing, health care, ledgering, automatic reading of city names and addresses for postal mail, document data compression, natural language and processing investigation forms or the automatic reading of postal addresses [2, 3].
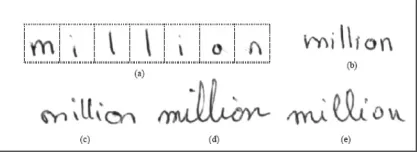
In addition, different style of writing will produce different data even though based on the same character. There are many databases used by researchers in HCR, for example English databases such as CENPARMI [4], CEDAR [5] IRONOFF [6] for French database; Indian database ISI [7]; Japanese database [8]; Kanji database [9]; Chinese database [10, 11]; Persian/Arabic database [12]; Bengali database [13] and Tibetan database [14] Figure 1 shows the different styles of handwriting.
3 Feature Vector of Binary Image
As we mentioned above, a HCR system usually has pre-processing, feature extraction and classification stages. The purpose of pre-processing is removing or minimizing the noise of the image before move to the next stage. Besides, the point of pre-processing is for data standardization to make it feasible to the recognition algorithms and to reduce data complexity. Feature extraction plays the most important rule of a HCR system which that the accuracy of the system is depending on this. The selected features will act as feature vector and will be the input for the classifier. Classifier is functioning to rate the accuracy of HCR system.
2.1 Pre-processing and FCC Extraction as Data Representation
Thinning algorithm is a process used on binary images to eliminate specific foreground pixels. Thinning structure consists of two elements namely ‘1’ as the foreground pixels and ‘0’ representing the background pixels.
Chain code representation gives the code of the boundary of character image, the codes that is representing the direction of where is the location of the next pixel and correspond to the neighbourhood in the image. Two types of boundary description algorithm are repeatedly applied for binary image: chain code based and run-length based algorithms [15]. Usually used in image compression, the run- length algorithm works by listing the successive ‘runs’ of similar objects and background pixels [15]. On the other hand, chain code based algorithm of a character image first through a binary image as input. Binary image is a representation with only two possible gray values for each pixel, such as “0” and “1”. Frequently, binary images attended in two types categories are the foreground is represented by 1 and the background is represented by 0. An 8-direction FCC is used for descriptions of object borders in image field because of simple and compact form of data representation and its suitability for fast processing. This paper utilizes 8-neighbourhood in extraction of characters as shown in Figure 2.
Figure 2: 8-Neighbourhood FCC Direction.
probability of correct computed results [16]. Randomized-based algorithm is one of Heuristic technique. A heuristic is defined in [17] as a technique which attempts to seek or find good solutions to a difficult model. Heuristic is an optimization problem that is concentrated on space complexity and time. Time complexity is referred to the running time of the program whereas space complexity is referring to the amount of computer memory required during the program execution. The amount of time and space are needed to solve the computation of complexity theory.
In this paper, features vectors were created from six methods to increase the accuracy. There were source image properties, pixel density calculation and transition, vector distance count, cross corner feature extraction and standard deviation and zone centroid average distance.
2.2 Classification
After features that represent the raw input data are extracted, classification stage would use the data to recognize the feature class based on the properties in the features. There are two kinds of classifier, one that needs to be trained to be familiarized with the input data pattern, and which that try to conclude the grouping independently. The former is termed as supervised learning while the latter is unsupervised learning. The learning process included in classification consists of supervised and unsupervised learning. Supervised learning is where the definitions of classes are done by the researcher and learning process is based on training data, formed by pairs of input object and desired outputs. On the other hand, unsupervised learning, which the input pattern is assigned to an unknown class so the determinations of the classes are based on the similarities of the features. After a pattern is mapped (represented), the next stage is classification.
ANN has been developed as generalizations of mathematical models of human cognition or neural biology, based on the following assumptions [18]:
i. Information processing occurs at many simple elements called neurons. ii. Signals are passed between neurons over connection links.
iii.Each connection link has an associated weight, which, in a typical neural net, multiplies the signal transmitted.
iv.Each neuron applies an activation function (usually nonlinear) to its net input (sum of weighted input signals) to determine its output signal.
5 Feature Vector of Binary Image
examples of feed forward networks while for recurrent networks are competitive networks, kohonen’s SOM, Hopfield network and Adaptive Resonance Theory (ART) model. This paper only concentrates on feed forward network with multi-layer architecture.
2.3 Previous Works
There are a lot of previous works on HCR discussed in Table 1. These works were using Roman scripts in their system. Various pre-processing and feature extraction techniques had been presented. The result was discussed in detail for all works. Majority of the works are done with all three stages. Binarization, noise reduction, normalization and thinning are often used as pre-processing in their work prior goes to feature extraction. Variety of feature extraction methods are applied in their work and all showed excellent result which is 90% and above. In this section, neural network is used as classifier to recognize the handwritten character.
Similar to our work, skeletonization or thinning had been done in [20] in their pre-processing stage. In addition, this work was done on NIST numeral database. A combined classifier was used and yielded excellent result. As discussed above, this work also used a lower quantity of training and testing samples. There was another work done by [21] that used lower quantity of testing and training samples. They used profile projection technique to extract the features. The accuracy achieved was high that reached 95.33%. Table 1 shows the previous works done by several researchers.
Table 1: Literature Review and Previous Works
Authors
Pre-processing
Feature
Extraction Classification Accuracy
[19] Segmentation, binarization, noise removal
Diagonal Feature Extraction Method Produced 54 features of each character
ANN 98.54%
[20] Binarization and
skeletonization
Complex Wavelet Features produced 772 features
ANN 99.25%
[21] Noise removal and resizing
Vertical,
Horizontal, Left Diagonal and
Right Diagonal directions produced 94 features [22] Binarization,
resizing, thinning Cross-corner feature extraction method produced 88 features
ANN 97%
[23] Normalization Zoning based features, upper and lower character profile projections features, left and right character profile projections features, distance based features produced 325 features
ANN 99.03%
[24] Noise reduction
Structural features and the statistical features
ANN 100%
[25] Binarization and segmentation produced 88 features Transition Feature, Sliding Window Amplitude Feature, Contour Feature
ANN 92.32%.
[26] Binarization and
segmentation
Transition features
ANN 92%.
[27] Not specify Speeded Up Robust Features (SURF)-
Upgraded SIFT
ANN 93.8%
7 Feature Vector of Binary Image
3 Research Methodology
There are three major issues related to the problems that are HCR and its problem; pre- processing particularly thinning algorithm in image processing; and FCC as data representation. In feature extraction and selection, proposed randomized-based algorithms to generate the FCC and followed by feature selection is to be distinguished. Continuing on the process is the problem and description of ANN as classifier to classify image characters. The process of problem identification is done by referring to the previous literatures in published papers and journals. After the problem identification and specification is completed, the next step is data definition and collection.
3.1 Data Definition and Collection
Data definition is a process of defining the type of data used, deciding the sources of dataset, checking the validity of the dataset, and categorizing the dataset for testing and validation. In the other hand, data collection means having the input data extracted or built from the original source and gathered into a compilation of huge numbers of input. Therefore, data collection is gathering relevant information in order to develop, testing, validating and analyzing the algorithms. For NIST dataset, the data is collected from the publisher [29]. In data collection for the purpose of validating and analyzing the algorithm, a function is created in the Matrix Laboratory (MATLAB) program so that the data such as route length and time are tabulated as output from the program.
Figure 3: The proposed research framework
3.2 Pre-processing and Randomized-based Algorithm in FCC
Extraction
9 Feature Vector of Binary Image
visited and taboo neighbours. These types will be used to check the neighbourhoods during the route tracing process. Finally, the algorithm will sort and list of shortest route can be formed using existing routes between nodes. The pseudo-code of FCC extraction by randomized-based is shown in Figure 4. The randomized-based algorithm is influenced by its parameter values. The parameters are the maximum string displayed and maximum route. Maximum string displayed is the number of line of generated FCC string that would be displayed in each session. Maximum route is to limit the maximum number of node count passed for each route. In addition, the input binary image is processed to generate more efficient data structure to be used in the iterations. The selection of the shortest route length from the list of FCC is by choosing the chain code string with the minimum route length. If there are many minimums of route length found, the string is selected by the first time it found in the list.
1. Initialize data
2. Locating Starting Node (select first node randomly which are "node method" or "end node method")
3. Visiting node and generating list of FCC
while (number of visited node < number of node)
if there are not visited neighbours select one node randomly
elseif there are visited neighbours select one node randomly elseif there are taboo neighbours
select one node randomly
endif
endwhile
4. Selecting shortest route length from the list of FCC until stopping criterion is achieved
Figure 4:Pseudo-Code of applied randomized-based algorithm [29]
3.3 Feature Identification and Development of Classification
Algorithms
4 Proposed Framework
As mentioned in previous section, the proposed framework of the system consist pre-processing, feature extraction and classification stages. In pre-processing, thinning algorithm is used. There are two parts involved in feature extraction stage. The first part is FCC extraction and second part is generating feature vector by using six methods which are aspect ratio, pixel density calculation, translation, vector distance count, cross corner feature extraction and standard deviation and zero centroid average distance. Finally, ANN is used as classifier to measure the accuracy and computation time.
4.1 Pre-processing: Thinning Algorithm
In converting raw binary image to TBI, thinning function in Image Processing Toolbox of MATLAB software is used respectively. The thinning algorithm for NIST dataset is parallel thinning algorithm using neural network approach. Original image dimension of 128x128 pixels is transformed into 32x32 to avoid the resulting chain code to represent the image becomes too long. Finally, the raw binary images of single character are obtained. For NIST dataset, manipulation from the raw binary image to TBI is using ‘bwmorph’ function in the Image Processing Toolbox in MATLAB. The result of TBI will be copied automatically in a directory that is determined earlier into two types of extension: text format (.txt file) and image format (.png file) for easier use and viewing. Figure 5 is the flowchart of the pre-processing stage.
11 Feature Vector of Binary Image
4.2 Feature Extraction
As discussed before, randomized algorithm is chosen to generate feature vector created from extracted FCC to be the input to the classification stage later. A thinning process is needed to shape the numeral image toward a skeleton form before the tracing of the whole numeral skeleton is carried out to extract the heuristic features step by step. Figure 6 shows a sample feature for the first part of feature extraction which were FCC and the five features from source image properties.Generated string of FCC is divided into four divisions to enable feature count normalization for this data type and to represent the directional properties of the character sample. For every chain code division, appearance frequency for every FCC directional code is calculated. Thus, number of occurrence of a specific FCC directional code in a single division is divided with total chain code length, producing 4 division x 8 directional code frequency per division = 32 features from this data type.
Figure 6: Sample Features of Character 'J' in Part 1 Feature Extraction
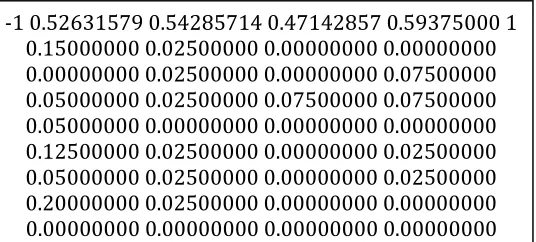
In the second part of feature extraction, the first method which is Method 1 is aspect ratio calculation. There were five features extracted from source image in the first part of feature extraction. First data type which is based on image is further expanded to five features, with all calculations for feature values using cropped image to its foreground marker defining the character for image height and width unless original image specification is stated otherwise. In other words, dimension between actual character image and its original source are differentiated [29]. In general, the five aspect ratios were calculated as formulas below.
a. Height-Width Ratio = Character Height / Character Width b. Upper Ratio = Upper Region Marker / Total Foreground c. Right Ratio = Right Region Marker / Total Foreground
d. Height Ratio = Actual Height / Original Image Height
e. The fifth feature is the total count of character segment in a single image. -1 0.52631579 0.54285714 0.47142857 0.59375000 1
Next, pixel densities are calculated for four different zones of the image and the number of pixels counted is used as the features of the character [24]. In this Method 2, the image will be divided to four frames that produced four features of each character. “frameres1” is declared as refers to window/frame count [frameX,frameY] which pixel inside the frame is to be counted. Frame count is the feature count since it was a feature per frame, feature count will be frameX*frameY, which is total frame for x-axis multiplied with frame count for y-axis.
Transition feature which is Method 3 as in [31] described that as the image is a binary image both return one of the three values 0, 1 or -1. 0 indicate no transition 1 means white to black transition and -1 indicate transition from black to white. Total 30 features extracted from this method. “gridQt2” is declared as refers to grid line count in which a feature will be generated per line. As such, total feature for this method will be line count for x-axis + line count for y-axis. In this very simple but effective, feature extraction technique the use of four different profiles, horizontal, vertical, and two diagonals, is suggested [32]. Feature extraction Method 4 is counting foreground pixel count per pattern line intersection. Below is the formula of the feature count. As we know the size of the image is 32 x 32 pixels, therefore, the feature count equals to:
Feature count = 3 * (img.dimH+img.dimW) - 2 = 3 * (32+32) – 2
= 190 features
Method 5 which is cross corner feature extraction is the same with Method 2 except the foreground pixels is counted diagonally. As usual, the image will be divided to 16 equal frames. Since the pixel is counted two times which is right diagonal and left diagonal, so the number of features is 2 x 16 equals to 32 features. Number of left diagonal line is one feature and number of right diagonal line is another feature in each zone [22].
13 Feature Vector of Binary Image
Figure 7: Sample Features of Character 'J' in Part 2 of Feature Extraction Phase
4.3
Artificial Neural Network (ANN) as Classifier
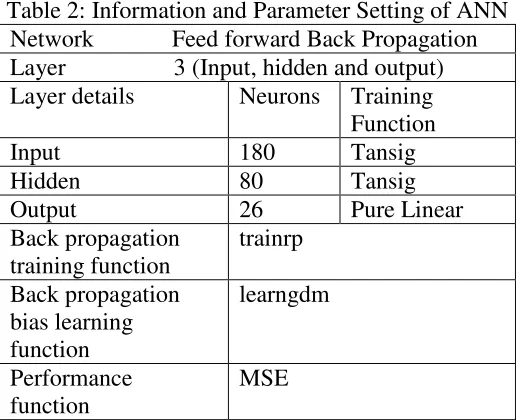
From the experiment, some of the characters are not tested due to low quality of the image or broken character. In the experiment, several adjustment of parameter setting is used. Table 2 and Figure 8 describe the parameter setting and the pseudo-code of generating features values for ANN. Assembly of a feature vector is the target of feature identification as input for the classification stage. 544 features contained in a single vector is a combination of two feature parts. Feature vectors formed from character images in NIST database are then compiled into input dataset for character classification stage.
Table 2: Information and Parameter Setting of ANN Network Feed forward Back Propagation Layer 3 (Input, hidden and output) Layer details Neurons Training
Function
Input 180 Tansig
Hidden 80 Tansig
Output 26 Pure Linear
Back propagation training function
trainrp
Back propagation bias learning function
learngdm
Performance function
MSE
0.000 0.000 0.000 0.000 00 0.000 0.000 00 0.375 0.469 02 0.344 0.406 00 0.500 0.469 00 0.656 0.250 02 0.438 0.312 01 0.406 0.562 00 0.281 0.688 00 00 00 00 00 00 00 00 00 00 00 00 08 07 02 01 01 04 02 02 05 03 00 00 00 00 00 00 00 00 00 00 00 00 00 00 00 00 00 01 02 02 02 02 02 02 02 02 03 04 04 01 01 01 01 01 01 01 00 00 00 00 00 00 00 00 00 00 00 00 00 00 00 00 00 00 00 00 00 00 00 00 00 00 00 00 00 01 01 03 03 01 02 01 04 02 02 03 02 04 03 03 00 00 00 00 00 00 00 00 00 00 00 00 00 00 00 00 00 00 00 00 00 00 00 00 00 00 00 00 00 00 00 00 00 00 00 00 00 00 00 00 00 00 00 00 00 00 04 03 02 01 00 01 01 03 00 02 02 03 03 01 01 00 01 01 01 01 01 01 01 01 00 00 00 00 00 00 00 00 00 00 00 00 00 00 00 00 00 00 05 05 09 11 09 05 04 05 0.000 0.000 +0.000 0.000 0.000 0.000 0.000 +0.000 0.000 0.000 0.000 0.000 +0.000 0.000 0.000 10.357 12.701 +2.880 1.007 -0.426 13.351 14.013 -0.402
Figure 8: The Pseudo-code of Generating Features Values for ANN
5 Experimental Results and Discussions
In this experiment, we chose uppercase characters from NIST database to run in the system. The number of tested characters from NIST dataset is 208,568 characters out of 220,304 characters.
Table 3: Dataset of NIST for ANN Character
Class
Original Data NIST
Dataset After Features Generation
Training Set
Testing Set
Upper-case 220,304 208,568 208,568 208,568
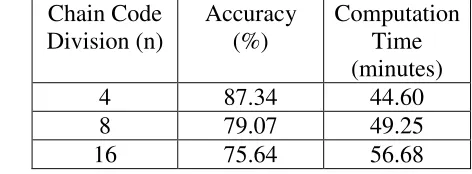
As discussed in previous section, we were choosing three divisions of FCC which were 4, 8 and 16 to compare the performance of ANN. Table 4 and Figure 9 showed the trend of the result according to the increasing of chain code division. As we can see below as the chain code division increasing, the accuracy dropped while the computation time increased. The highest accuracy obtained is 87.34% with lowest chain code division and shortest computation time.
Diagonal feature extraction was one of the techniques that had been reported in [19]. This off-line handwritten alphabetical character recognition system using multilayer feed forward neural network. Based on the training and testing databases used, there was a big difference in term of quantity compare to NIST
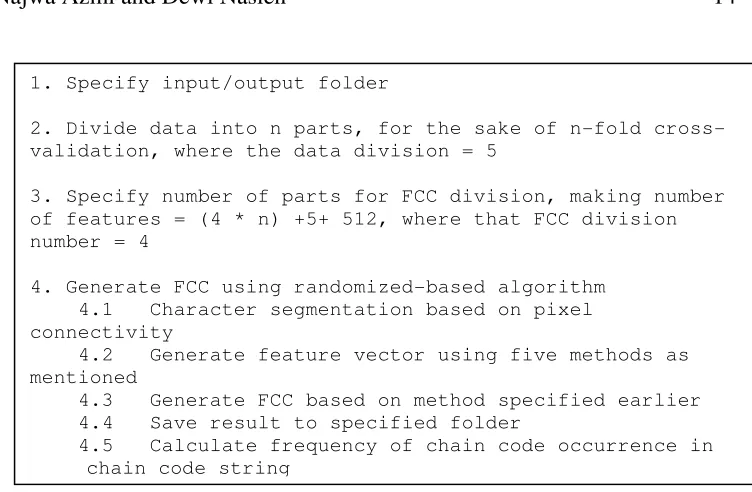
1. Specify input/output folder
2. Divide data into n parts, for the sake of n-fold cross-validation, where the data division = 5
3. Specify number of parts for FCC division, making number of features = (4 * n) +5+ 512, where that FCC division number = 4
4. Generate FCC using randomized-based algorithm 4.1 Character segmentation based on pixel connectivity
4.2 Generate feature vector using five methods as mentioned
4.3 Generate FCC based on method specified earlier 4.4 Save result to specified folder
15 Feature Vector of Binary Image
database we had used. Lower quantity of character testing may caused high accuracy.
Similar to our work, skeletonization or thinning had been done in [20] in their pre-processing stage. In addition, this work was done on NIST numeral database. A combined classifier was used and yielded excellent result. As discussed above, this work also used a lower quantity of training and testing samples. There was another work done by [21] that used lower quantity of testing and training samples. They used profile projection technique to extract the features. The accuracy achieved was high that reached 95.33%.
A lot of previous works used a self collection database. In [22], only 650 samples are used in their experiment. There were 70,000 sample handwritten digits from NIST database were used in [23]. They divided to 60,000 for training and 10,000 for testing. The result yielded was very high with an accuracy of 99.03%. However, the sample quantity was still lower than ours. This also happened in [24, 25, 26, 27, 28] which their sample quantity used in the experiment was lower than our sample. The highest sample quantity was 20,000 and the lower was 200.
As mentioned before, the quantity of samples we used were 220,304 which was a larger amount compare to previous work discussed in Section 2.3. The accuracy may affect due to high sample quantity. All the previous works had used lower sample quantity that made their accuracy became higher.
Table 4: Accuracy and Computation Time based on Chain Code Division Chain Code
Division (n)
Accuracy (%)
Computation Time (minutes)
4 87.34 44.60
8 79.07 49.25
Figure 9: Accuracy and Computation Time versus Chain Code Division
5
Conclusions, Limitations and Future Research
This paper presents a recognition system for English Handwritten that used Freeman Chain Code (FCC) as data representation. There are 544 features were extracted from the original image. Thinning algorithm was used. A feed forward back propagation neural network was used as classification. The accuracy yielded from the system is 87.34% with shortest computation time which is 44.6 minutes.
From the experiment, not all NIST uppercase character database can be used due to broken and low quality images. There were 11,736 cannot be analyzed in the experiment.
In the future works, this experiment will be done to all character classes. Besides, the experiment can be done to other biometric databases such as signature to test the recognition performance. Lastly, the selection of features vector as input for classification stage is important to reach higher accuracy with application of other classifier such as SVM and hybrid classifier.
ACKNOWLEDGEMENTS
17 Feature Vector of Binary Image
References
[1] Nasien, D., Haron, H., & Yuhaniz, S. S., “Support Vector Machine (SVM) for English Handwritten Character Recognition”, IEEE Second International Conference on Computer Engineering and Applications (ICCEA), vol. 1, (2010), pp. 249-252.
[2] Nemouchi, Soulef, Meslati, LabibaSouici, & Farah, Nadir, “Classifiers Combination for Arabic Words Recognition: Application to Handwritten Algerian City Names”, In A. Elmoataz, D. Mammass, O. Lezoray, F. Nouboud & D. Aboutajdine (Eds.), Image and Signal Processing ,vol. 7340, (2012), pp. 562-570, Springer Berlin Heidelberg.
[3] Bag, Soumen, & Harit, Gaurav,” A survey on optical character recognition for Bangla and Devanagari scripts”, Sadhana, vol. 38, o. 1, (2013), pp. 133-168.
[4] Suen, C. Y., Nadal, C., Legault, R., Mai, T. A., & Lam, L.,” Computer recognition of unconstrained handwritten numerals”, Proceedings of the IEEE, vol. 80, no.7, (1992), pp. 1162-1180.
[5] Hull, J. J., “A Database for Handwritten Text Recognition Research”, IEEE Transactions on Pattern Analysis and Machine Intelligence, vol. 16, No. 5, (1994), pp: 550-554.
[6] Viard-Gaudin, C., Lallican, P. M., Knerr, S., and Binter, P.,”The IRESTE On/Off (IRONOFF) Dual Handwriting Database”, Proceedings o of the 1999 IEEE 5th International Conference on Document Analysis and Recognition, 20-22 September, (1999), pp: 455-458.
[7] Bhattacharya, U., and Chaudhuri, B. B., “Databases for Research on Recognition of Handwritten Characters of Indian Scripts”, Proceedings of the IEEE 8th International Conference on Document Analysis and Recognition (ICDAR), (2005), pp: 789-793 .
[8] Matsumoto, K., Fukushima, T., and Nakagawa, M., “Collection and Analysis of On-line Handwritten Japanese Character Patterns for Research on Recognition of Handwritten Characters of Indian Scripts”, IEEE Proceedings of the 6th International Conference on Document Analysis and Recognition, (2001), pp: 496-500.
[8] Mori, S., Yamamoto, K., Yamada, H., and Saito, T., “On A Handprinted KYOIKU-KANJI Characters Database”, Bull. Electrotech. Lab, vol. 43, no. 11-12, (1979), pp.752-733
[9] Li, Y. Y., Jin, L. W., Zhu, X. H., and Long, T., “ SCUT COUCH2008: A Comprehensive Online Unconstrained Chinese Handwriting Dataset, IEEE Proceedings of the 11th International Conference on Frontier in Handwriting Recognition, (2008), pp: 165-170.
the IEEE 10th International Conference on Document Analysis and Recognition, (2009), pp: 1206-1210.
[11] Alaei, A., Nagabhushan, P., & Pal, U., ”A new two-stage scheme for the recognition of Persian handwritten characters”, In International Conference on Frontiers in Handwriting Recognition (ICFHR), (2010), pp. 130-135.
[12] Mahmud, J. U., Raihan, M. F., and Rahman, C. M., “A Complete OCR System for Continuous Bengali Characters”, IEEE Proceedings of the International Conference on Convergent Technologies for Asia Pacific Region, (2003), pp: 1372-1376.
[13] Drup, N., Dongcai, Z., Ren, P., Sanglangjie, D., Fang, L., and Bawangdui, B.,”Study on Printed Tibetan Character Recognition”, IEEE Proceedings of the International Conference on Artificial Intelligence and Computational Intelligence. 23-24 October, (2010), pp: 280-285.
[14] Ren, L., and Garcez, A. d. A., “Symbolic Knowledge Extraction from Support Vector Machines: A Geometric Approach. Advances in Neuro-Information Processing, vol. 5507, (2009), pp. 335-343.
[15] Wegener, I.,”Towards a Theory of the Randomized-Based Search Heuristics”, Lecture Notes in Computer Science, vol. 2747, (2003), pp.125-141.
[16] Reeves, C. R., “Modern Heuristic Techniques for Combinatorial Problems”, (1995), New York: McGraw-Hill.
[17] Fausett, L. V., “Fundamentals of Neural network: Architecture, Algorithms and Applications”,(1994), Prentice Hall.
[18] Pradeep, J., Srinivasan, E., & Himavathi, S.,”Diagonal based feature extraction for handwritten character recognition system using neural network”, 3rd IEEE International Conference on Electronics Computer Technology (ICECT), (2011),Vol. 4, pp. 364-368.
[19] Zhang, P., Bui, T. D., & Suen, C. Y.,”Hybrid feature extraction and feature selection for improving recognition accuracy of handwritten numerals”, Proceedings of Eighth International Conference on Document Analysis and Recognition, (August 2005), pp. 136-140.
[20] Choudhary, Amit, Rishi, Rahul, & Ahlawat, Savita, “Unconstrained Handwritten Digit OCR Using Projection Profile and Neural Network Approach, In S. Satapathy, P. S. Avadhani & A. Abraham (Eds.), Proceedings of the International Conference on Information Systems Design and Intelligent Applications, vol. 132, (2012), pp. 119-126.
[21] Rani, Manju, & Meena, Yogesh Kumar, “An Efficient Feature Extraction Method for Handwritten Character Recognition, Swarm, Evolutionary, and Memetic Computing, vol. 7077, (2011), pp. 302-309): Springer Berlin Heidelberg.
19 Feature Vector of Binary Image
[23] Yang, Yang, Lijia, Xu, & Chen, Cheng, “English Character Recognition Based on Feature Combination”, Procedia Engineering, vol. 24, (2011), pp. 159-164.
[24] Chel, Haradhan, Majumder, Aurpan, & Nandi, Debashis, “Scaled Conjugate Gradient Algorithm in Neural Network Based Approach for Handwritten Text Recognition”,Trends in Computer Science, Engineering and Information Technology, vol. 204, (2011), pp. 196-210, Springer Berlin Heidelberg.
[25] Rohini, S. G., Devi, R. U., & Mohanavel, S.,”Character Segmentation for Cursive Handwritten Text Using Ligature Classification and Transition Feature”, In Proceedings of the Fourth International Conference on Signal and Image Processing (ICSIP 2012), pp. 269-280. Springer India.
[26] Uchida, S., & Liwicki, M. ,”Analysis of Local Features for Handwritten Character Recognition”, IEEE Proceeding on International Conference on Pattern Recognition (ICPR), (2010), pp: 1945-1948.
[27] Bayoudh, S., Mouchère, H., Miclet, L., & Anquetil, E., “Learning a classifier with very few examples: analogy based and knowledge based generation of new examples for character recognition”, In Machine Learning: ECML (2007),pp. 527-534, Springer Berlin Heidelberg.
[28] Nasien, D.,”Feature Extraction and Selection Algorithm for Chain Code Representation of Handwritten Character”, Ph.D. Thesis,(2010), Universiti Teknologi Malaysia (UTM), Malaysia.
[29] Shanthi, N., & Duraiswamy, K., “A novel SVM-based handwritten Tamil character recognition system”, Pattern Analysis and Applications, 13(2), (2010), pp. 173-180.
[30] Habibollah Haron, Siti Mariyam Shamsuddin, Dzulkifli Mohamed, “A New Corner Detection Algorithm for Chain Code Representation”, International Journal of Computer Mathematics, Vol. 82, No. 8, (August 2005), pp: 941–950, Taylor and Francis.
[31] Desai, Apurva A, “Gujarati Handwritten Numeral Optical Character Reorganization through Neural Network”, Pattern Recognition, Vol, 43, No.7, (2010),pp. 2582-2589.
![Figure 4: Pseudo-Code of applied randomized-based algorithm [29]](https://thumb-us.123doks.com/thumbv2/123dok_us/1283776.1160875/9.595.94.489.307.468/figure-pseudo-code-applied-randomized-based-algorithm.webp)