FINDING KERNEL FUNCTION FOR STOCK MARKET PREDICTION WITH SUPPORT VECTOR REGRESSION
CHAI CHON LUNG
PREDICTION WITH SUPPORT VECTOR REGRESSION
CHAI CHON LUNG
A project report submitted in partial fulfillment of the requirements for the award of the degree of
Master of Science (Computer Science)
Faculty of Computer Science and Information System University Technology Malaysia
iii
ACKNOWLEDGEMENT
First of all, I would like to draw my highest appreciation to my supervisor Associate Professor Dr. Mohd. Noor Md. Sap for his critics, advices and encouragement. Without his continued support and guidance, this project would not have been the same as presented here.
Moreover, the knowledge sharing as well as support from my course mates, staff, lecturers and all members in Faculty of Computer Science and Information System, University Technology Malaysia are very valuable in this research.
Special thanks and gratitude are also to Professor Dr. Safaai Bin Deris and Associate Professor Dr. Siti Mariyam Shamsuddin for their helps and guidance. Not forgetting to Associate Professor Dr. Chih Jen Lin from National Taiwan University for his help and assistance.
v
ABSTRACT
ABSTRAK
vii
TABLE OF CONTENTS
CHAPTER TITLE PAGE
TITLE i
DECLARATION ii
ACKNOWLEDGEMENT iv
ABSTRACT v
ABSTRAK vi
TABLE OF CONTENTS vii
LIST OF TABLES xii
LIST OF FIGURES xv
LIST OF SYMBOLS xviii
LIST OF ABBREVIATIONS xix
LIST OF TERMINOLOGY xx
LIST OF APPENDICES xxii
1 INTRODUCTION 1
1.1 Preface 1
1.2 Problem Background 2
1.3 Problem Statement 13
1.4 Project Objectives 14
1.5 Project Scopes 15
1.6 Importance of the Study 16
1.7 Theoretical Framework 17
2 LITERATURE REVIEW 19
2.1 Introduction 19
2.2 Stock Exchange Mechanism 20
2.3 Stock Market Returns 21
2.4 Stock Market Prediction Techniques 23
2.4.1 Traditional Approaches 24
2.5 Data Mining 26
2.5.1 Data Mining Operation 27
2.5.1.1 Classification 29
2.5.1.2 Clustering 30
2.5.1.3 Prediction 30
2.6 Time Series Forecasting 33
2.7 Stock Market Prediction 38
2.8 Support Vector Machine
2.8.1 Support Vector Machine for Classification Problem
2.8.1.1 Calculation for SVM Classification
2.8.2 Support Vector Machine for Regression Problem
2.8.2.1 Calculation for Support Vector Regression
2.8.3 Kernel Function
2.8.3.1 RBF kernel function 2.8.3.2 Polynomial kernel function 2.9 Validation Techniques
2.9.1 Holdout Method
2.9.2 Leave One Out Method
2.9.3 K-fold Cross Validation Method 2.9.4 Bootstrapping
2.9.5 Validation in SVM 2.10 Artificial Neural Network
2.10.1 Back Propagation Algorithm
ix
2.11 Measuring Errors in Forecasting 2.12 Summary
64 65
3 RESEARCH METHODOLOGY 3.1 Introduction
3.2 Project Structure
3.3 Operational Framework
3.3.1 KLSE Stock Data Collection 3.3.2 Analysis on Stock Domain 3.3.3 Time Series Data Modeling
3.3.4 Design of Support Vector Machine Structure
3.3.4.1 Data Preprocessing 3.3.4.2 Selection of Parameters 3.3.5 Design of Back Propagation NN Model
3.3.5.1 Determine the number of NN nodes
3.3.6 Experiments on the Prepared Datasets 3.3.7 Analysis and Comparison of
Experimental Results
3.3.8 Data Source And Instrumentals 3.3.9 Summary 66 66 66 67 67 71 72 76 77 78 80 81 81 82 83 83
4 IMPLEMENTATION OF SUPPORT VECTOR MACHINE MODEL
4.1 Introduction
4.2 Data Preprocessing 4.2.1 Feature Selection 4.2.2 Data Segmentation 4.2.3 Data Representation
4.3 Support Vector Machine Model Construction 4.3.1 Support vector Regression
4.3.2 Parameters Selection
4.3.2.1 The Cost of Error C 4.3.2.2 The Width of The ε -
insensitive Tube 4.3.2.3 The Polynomial Kernel
Parameter
4.3.2.4 The RBF Kernel Parameter 4.3.3 Building SVM Model Steps
4.4 Summary
93 93 94 94 94 95 96 98 101
5 EXPERIMENTAL RESULTS 5.1 Introduction
5.2 Initial Setting for Experiments
5.3 Experiments on the prepared datasets. 5.3.1 Experiment 1: Determining the best
SVM model for future prediction. 5.3.2 Experiments 2: Evaluating the
performance of SVM model and BP NN model on different data segments for future prediction.
5.4 Prediction Result Based On The Four Segments. 5.4.1 Result based on RBF and Polynomial
kernels.
5.4.2 Results based on SVM and BP models for future stock data prediction.
5.5 Prediction Result Based On Different Counters 5.5.1 Result based on SVM and BP models. 5.6 Results Dicussion
xi
6 CONCLUSION
6.1Introduction 6.2Findings
6.3Advantages of the Study 6.4Contributions of the Study
6.5Recommendations for Future Works 6.6Conclusion
REFERENCES APPENDIX
138
138 138 140 140 141 142
LIST OF TABLES
TABLE NO. TITLE PAGE
1.1 Stock market risk types 3
1.2 Limitations of traditional statistical models 5 1.3 Previous research on stock fundamental data 6
1.4 Kernels used by previous researchers 11
2.1 Stock market analysis 25
2.2 Datamining operations, features and benefits 28 2.3 Techniques applied in time-series prediction 31 2.4 Global and local model in time series forecasting 35
2.5 Forecasting methods 36
2.6 Forecasting techniques 40
2.7 Advantages of SVM 46
2.8 Common kernel functions 56
2.9 Advantages of ANN 63
3.1 Example of KLSE EOD data for MESDAQ technology sector
69
3.2 Maybank EOD data from 1st of January until 31st of January year 2002
70
3.3 Four stocks and their corresponding time periods 73
3.4 Calculations for five indicators 74
3.5 SVM parameters used by past researchers in time series prediction
79
3.6 Number of Nodes in NN model 81
4.1 Correlation coefficients for the independent variables
90
xiii
4.3 Parameters selection by SVMdark. 97
4.4 Range of parameters 98
5.1 Sample stocks and amount of data 103
5.2 Data segments associated in the project 103
5.3 Initial setting for experiments 104
5.4 The best SVM model used in TENAGA and MAYBANK prediction
107
5.5 The best SVM model used in KLCI and IOICORP stock prediction
108
5.6 Comparison of prediction results produced by SVMPOLY and SVMRBF with actual closing price for TENAGA.
111
5.7 Comparison of prediction results produced by SVMPOLY and SVMRBF actual closing price for MAYBANK.
112
5.8 Comparison of prediction results produced by
SVMPOLY and SVMRBF with actual index for KLCI.
113
5.9 Comparison of prediction results produced by SVMPOLY and SVMRBF with actual closing price for IOICORP.
114
5.10 The maximum differences for four data sets 119 5.11 The minimum differences for four data sets 120
5.12 Total differences of forecasting model. 120
5.13 Comparison of differences between values forecast by SVMPOLY and BPSIG with actual TENAGA closing price.
121
5.14 Comparison of differences between values forecast by SVMPOLY and BPSIG with actual MAYBANK closing price.
122
5.15 Comparison of differences between values forecast by SVMPOLY and BPSIG with actual KLSE Indexes.
123 5.16 Comparison of differences between values forecast
by SVMPOLY and BPSIG with actual IOICORP closing prices.
5.17 The best SVM model used in MALAKOF and PBBANK stock prediction
127
5.18 The best SVM model used in SSEB and MVEST stock prediction
127
5.19 Comparison of differences between values forecast by SVMPOLY, SVMRBF and BPSIG with actual MALAKOF closing prices.
131
5.20 Comparison of differences between values forecast by SVMPOLY, SVMRBF and BPSIG with actual PBBANK closing prices.
132
5.21 Comparison of differences between values forecast by SVMPOLY, SVMRBF and BPSIG with actual SSEB Index.
133
5.22 Comparison of differences between values forecast by SVMPOLY, SVMRBF and BPSIG with actual MVEST closing prices.
133
5.23 Total differences of forecasting model for four different counters.
xv
LIST OF FIGURES
FIGURE NO. TITLE PAGE
1.1 Theoretical framework 17
2.1 Typical trading processes 20
2.2 Stock market prediction techniques 23
2.3 Data mining process 26
2.4 Support vector machine 44
2.5 Hyperplane = { x | <w,x> + b = 0 } 47
2.6 Separating hyperplanes 48
2.7 Support vector with maximum margin boundary 48
2.8 SVM input and feature space 51
2.9 SVR to fit a tube with radius ε to the data and positive slack variables
ς
measuring the points lying outside of the tube52
2.10 εεεε-insensitive regressor 53
2.11 Complex in low dimensions versus simple in higher dimensions
55
2.12 The radius basis function kernel 57
2.13 The polynomial kernel 59
2.14 Dataset splits into two groups 60
2.15 K-fold Cross validation 61
3.1 Operational framework 68
4.1 Standard slicing windows method 88
4.2 Walk-forward testing routine divide data sets into 5 overlapping training-validation-test sets
89
4.3 Example sample data representation in sparse format 92
4.5 ε-insensitive loss function 94 4.6 An overall flowchart of SVM implementation 100 5.1 Comparison of output produced by SVMPOLY and
SVMRBF versus actual closing price (TENAGA) for November and December 2004.
109
5.2 Comparison of output produced by SVMPOLY and SVMRBF versus actual closing price (MAYBANK) for November and December 1998
109
5.3 Comparison of output produced by SVM using RBF and polynomialkernels versus actual KLSE indexes (KLCI) for January and February 2006.
110
5.4 Comparison of output produced by SVM using RBF and polynomial kernels versus actual closing price (IOICORP) for November and December 1995.
110
5.5 MSE for SVM models with different kernel types 116 5.6 Plots of actual TENAGA closing price versus
forecast using SVMPOLY and BPSIG models for November and December 2004
117
5.7 Plots of actual MAYBANK closing price versus forecast using SVMPOLY and BPSIG models for November and December 1998
117
5.8 Plots of actual KLSE Indexes versus forecast using SVMPOLY and BPSIG models for January and February 2006
118
5.9 Plots of actual IOICORP closing price versus forecast using SVMPOLY and BPSIG models for November and December 1995.
118
5.10 MSE for the SVMPOLY and BPSIG models. 125 5.11 Plots of actual MALAKOF closing price versus
forecast using SVMPOLY, SVMRBF and BPSIG models.
xvii
5.11 Plots of actual MALAKOF closing price versus forecast using SVMPOLY, SVMRBF and BPSIG models.
128
5.12 Plots of actual PBBANK closing price versus forecast using SVMPOLY, SVMRBF and BPSIG models.
128
5.13 Plots of actual SSEB Shanghai Index versus forecast using SVMPOLY, SVMRBF and BPSIG models.
129
5.14 Plots of actual MVEST closing price versus forecast using SVMPOLY, SVMRBF and BPSIG models.
129
LIST OF SYMBOLS
ς - slack variables
Φ - mapping function
ε-insensitive - loss function insensitive to errors less than ε
γ - gamma value for RBF kernel
n - dimension of input space
ℜ - feature space
α - dual variables
b - Bias
w - weight vector
W - dual Lagrangian
K(x,y) - kernel 〈Φ(x) . (y)〉
ln - natural logarithm
η
- learning rateα
- momentum rateµ
- constant meanxix
LIST OF ABBREVIATIONS
ACF Auto Correlation Function
ANN Artificial Neural Network
ARMA Auto Regressive Moving Average
BP Back Propagation
ERM Empirical Risk Minimization
GA Genetic Algorithm
KLCI Kuala Lumpur Composite Index
KLSE Kuala Lumpur Stock Exchange
K-NN K - Nearest Neighbor
MAD Mean Absolute Deviation
MLP Multi Layer Perceptron
MPE Mean Percentage Error
MSE Mean Square Error
NN Neural Network
PACF Partial Auto Correlation Function
RBF Radial Basis Function
RBFN Radial Basis Function Network
RMSE Root Mean Square Error
SMA Simple Moving Average
SRM Structural Risk Minimization
SRMP Structural Risk Minimization Principle
SVM Support Vector Machine
LIST OF TERMINOLOGY
Terminology Meaning
1 Time series A sequential set of measurement over time and defined as a sequence of vectors x (t), t ≤ 0,1,.., where t represents elapsed time.(Raicharoen , 2003)
2 Prediction Finds pattern for the purpose of
predicting future behaviors of some entities (Fayyad et.al, 1996).
3 Time Series Prediction The use of a model to predict future events based on known past events to predict future data points before they are measured.
4 Regression Learning a function that maps a data item to a real valued prediction variable (Fayyad et.al.,1996).
5 Support Vector Machine A system for efficiently training linear learning machines in kernel induced feature spaces, while respecting the insights of generalization theory and exploiting optimization theory.
6 Support Vectors The data points that lies closest to the decision surface.
7 Kernel Function A kernel is a function K, such that for all x, z ∈ X, K (x, z) = ((x),z), where
is a mapping from X to a (inner
xxi
product) feature space F.
8 Radial Basis Function kernel A high dimensional kernel function that employ some method of determining a subset of centre
9 Polynomial Kernel A non linear kernel function with p(degree) as the tunable parameter. 10 Autoregressive Moving
Average(ARMA)
A linear model which consist of two parts, an autoregressive (AR) and a moving average (MA) which can be used to understand and predict future values given a time series of data Xt 11 Multivariate Adaptive
Regression Spline (MARS)
LIST OF APPENDICES
APPENDIX TITLE PAGE
A Metastock Data 159
B Sample Data 161
C Data Segments 169
D SVM Parameters Selections 173
E Prediction Using Original data 177
CHAPTER ONE
INTRODUCTION
1.1 Preface
The prediction of the future has always fascinated mankind due to the possible benefits of this knowledge (Thierry, 1996). This is especially true in the financial world. New tools and techniques for prediction are growing away from their original environment like the mathematical and computing world and find their way into all kinds of professional applications such as finance or engineering (B.K. Wong, 1995).
Modeling the markets using advanced financial engineering techniques has lately attracted a great deal of attention. Active managers have grown in number and many of them make the arguably reasonable assumptions that all people do not react similarly to publicly available data and that everybody does not react at the same speed (Ganesh et al., 1995). These assumptions open up the possibility that one can beat the consensus by performing better or more efficient analysis, using advanced computer and mathematical tools as well as time-series modeling techniques (Farmer and Sidorowich, 1998; Weigend and Gershenfeld, 1994). Human information processing has limits; the new machine-aided approaches help expand those limits.
stock price forecasting using Haier closing prices data (Bao et al.,2004) and the study of rainfall forecasting using meteorological variables like potential temperature, vertical component of the wind, specific humidity, air temperature, precipitable water, relative vorticity and moisture divergence flux (Valverde et al., 2005).
The success of SVM in prediction technique is evidence from several researches in electricity load forecasting (Chen et al., 2004), stock price forecasting (Bao et al., 2004), traffic speed prediction (Vanajakshi and Rilett, 2004), travel time series prediction (Wu et al., 2004) and rainfall runoff modeling (Dibike et al., 2001). Although SVM has been widely implemented in time series prediction, there is yet another area of interest which has not been explored by SVM which is in the KLSE stock price prediction.
Currently artificial neural network that utilize a back propagation algorithm has proved its superiority in predicting Wall Street Journal’s Dow Jones Industrial Index (Darmadi, 1994) and modeling NASDAQ-GEM stock price relationship (NG et al., 2000). Thus, the effectiveness of BPNN needs to be investigated in predicting KLSE stock prices.
Therefore, this project examines the feasibility of Support Vector Machine technique with selection of two different kernel functions that are RBF and polynomial in predicting future KLSE stock price in Malaysia. In addition to that, it is aimed at comparing and contrasting the performance of SVM with ANN in predicting KLSE stock price.
1.2 Problem Background
3
markets do not behave randomly, but rather perform in a chaotic manner (Malliaris et al., 1994).
Is stock price really predicable? In the earlier stage, under the assumption of efficient market investors believed that the movement of stock price presents a state of random walk. That means it is impossible to predict the change of stock price by its historical data. Nevertheless, some researchers who did empirical studies applying investment portfolio found historical information is actually useful in prediction (Osborne, 1964).
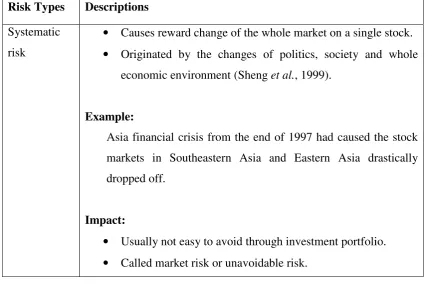
As the description above about the uncertainty of price movement, therefore, it is understandable that investment risk of stock is not low. In the traditional theory of investment portfolio, risk of stock can be divided into systematic risk and unsystematic risk (Sheng et al., 1999).
Table 1.1: Stock market risk types
Risk Types Descriptions
Systematic risk
• Causes reward change of the whole market on a single stock.
• Originated by the changes of politics, society and whole economic environment (Sheng et al., 1999).
Example:
Asia financial crisis from the end of 1997 had caused the stock markets in Southeastern Asia and Eastern Asia drastically dropped off.
Impact:
• Usually not easy to avoid through investment portfolio.
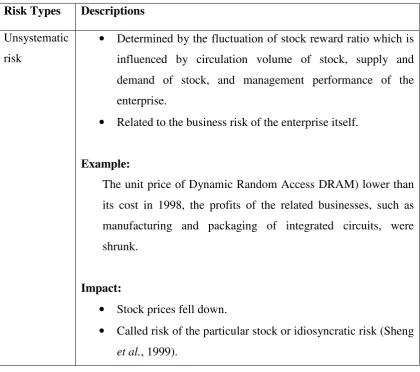
Table 1.1: Stock market risk types (Cont’.).
Risk Types Descriptions
Unsystematic risk
• Determined by the fluctuation of stock reward ratio which is influenced by circulation volume of stock, supply and demand of stock, and management performance of the enterprise.
• Related to the business risk of the enterprise itself.
Example:
The unit price of Dynamic Random Access DRAM) lower than its cost in 1998, the profits of the related businesses, such as manufacturing and packaging of integrated circuits, were shrunk.
Impact:
• Stock prices fell down.
• Called risk of the particular stock or idiosyncratic risk (Sheng et al., 1999).
Typically, there are six traditional statistical models (Bao et al., 2002):
1. Simple exponential, 2. Holt-Winters smoothing, 3. Regression method, 4. Causal regression, 5. Time series method, and 6. Box-Jenkins (Box et al., 1994)
5
(Diebold, 1998), e.g. the seasonal or cyclical time series. An intelligent method, e.g. neural network (Castillo et al., 2001), is also introduced to improve modeling capacity in recent years. This is because modeling a neural network is nothing to do with the problem of linear or nonlinear system, the appropriate order of the function, and the fitness test of model. Unfortunately, it faces the issue about generalization capability that decides the network performance (Castillo et al., 2001).
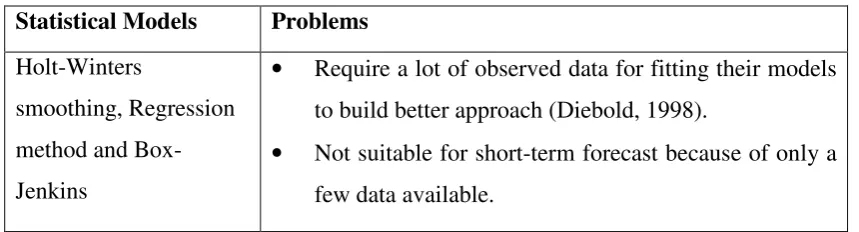
Table 1.2: Limitations of traditional statistical models.
Statistical Models Problems
Holt-Winters
smoothing, Regression method and Box-Jenkins
• Require a lot of observed data for fitting their models to build better approach (Diebold, 1998).
• Not suitable for short-term forecast because of only a few data available.
Modeling a forecasting system is widely discussed and studied for years, especially the topic about the trend analysis on time series or index series in which both of series definitely can be represented as a single in-order sequence (Bao et al., 2002). However, the most of traditional statistics model cannot result in the satisfactory predicted results in many forecasting applications. This is because the traditionally mathematical model has to consider whether the system is the linear or nonlinear model, what the appropriate order of function for prediction is, and how to test the fitness of forecasting model (Box et al., 1994). Therefore, alternative is to seek a kind of intelligent method as the prediction tool, i.e. SVM in which it can avoid the crucial problem mentioned in the traditional statistics model.
The domain of financial time series prediction is a highly complicated task due to following reasons:
controversial issue and has been questioned in scope of the efficient market hypothesis (EMH).
2. Financial time series are subject to regime shifting, i.e. statistical properties of the time series are different at different points in time (the process is time-varying).
3. Financial time series are usually very noisy, i.e. there is a large amount of random (unpredictable) day-to-day variations.
4. In the long run, a new prediction technique becomes a part of the process to be predicted, i.e. it influences the process to be predicted (Asim et al., 2005).
In the past 30 years, financial world has embraced a decidedly quantitative orientation from many parts of the decision making processes with the widely adopted theories based on linear models (John, 1965). This culture can be attributed to a common belief about financial markets that linear models are both efficient and simple. But many reasoned researchers in the area have revealed that the dynamical systems comprising the financial markets require more complex models than have been tried previously (William, 1964). However, many relationships in finance are nonlinear and that no simple transformation can be made to make them linear over a large enough range to be interesting (Darmadi et al., 1994).
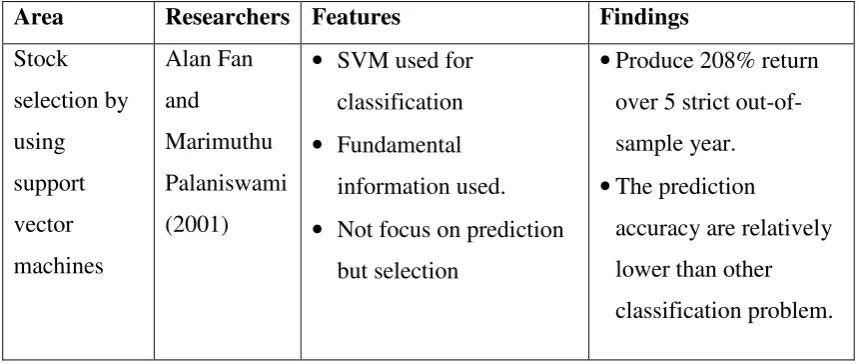
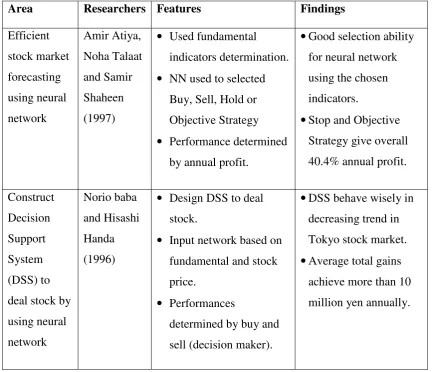
Table 1.3: Previous research on stock fundamental data
Area Researchers Features Findings Stock selection by using support vector machines Alan Fan and Marimuthu Palaniswami (2001)
• SVM used for classification
• Fundamental information used.
• Not focus on prediction but selection
•Produce 208% return over 5 strict out-of-sample year.
•The prediction
7
Table 1.3: Previous research on stock fundamental data (Cont’.).
Area Researchers Features Findings
Efficient stock market forecasting using neural network Amir Atiya, Noha Talaat and Samir Shaheen (1997)
• Used fundamental indicators determination.
• NN used to selected Buy, Sell, Hold or Objective Strategy
• Performance determined by annual profit.
•Good selection ability for neural network using the chosen indicators.
•Stop and Objective Strategy give overall 40.4% annual profit.
Construct Decision Support System (DSS) to deal stock by using neural network Norio baba and Hisashi Handa (1996)
• Design DSS to deal stock.
• Input network based on fundamental and stock price.
• Performances
determined by buy and sell (decision maker).
•DSS behave wisely in decreasing trend in Tokyo stock market.
•Average total gains achieve more than 10 million yen annually.
Stock market prediction has been a research topic for many years (Peters et al, 1991). Due to the fact that stock markets are affected by many highly interrelated economic, political and even psychological factors, it is very difficult to forecast the movement of stock market (Jing et al, 1997). Kuala Lumpur Stock Exchange (KLSE) has been chosen because KLSE is one of the largest markets in the emerging economies in terms of capitalization. So, the use of SVM as a time-series analysis in the KLSE stock market prediction is still a miss compare with the conventional neural network. Therefore, a detail comparison between neural network and SVM is a need especially in stock market prediction.
prices based on past prices alone. The problem of finding fundamental data that matched the price data in the correct time sequence was another reason for not considering it. Reliable stable fundamental data are also difficult to obtain as government bodies that issue the statistical economic figures frequently revised them thus making the data practically unreliable in forecasting future stock prices that may rely on the data (Clarence, 1993).
This study is also motivated by a growing popularity of support vector machines (SVM) for regression problems (Kwok, 2001). SVM generalization performance does not depend on the dimensionality of the input space, but many SVM regression application studies are performed by ‘expert’ users having good understanding of SVM methodology.
Each of these SVM regression problems have being solved for their specific domain. Hence, the regression problem in KLSE stock prediction has not been done by other researchers. Due to the nature of SVM is based on statistical learning theory (Theodore et al., 2000), SVM can be used to predict the KLSE market as well.
Recently, a support vector method for density support estimation was introduced by (Scholkopf et al, 2001), and has been successfully applied to a number of problems, including stock market predictions and selections. This method permits the control of the number of outliers in the training set and the solution of the optimization problem leads to a decision function which classifies new points as inliers and outliers. From the researches that have been done by other researchers on stock market predictions, most of them did not focus on the outliers. So, the effects of the outliers in determining the accurateness of KLSE stock prediction will be considered and some comparisons will be done for these.
9
(Cao and Francis, 2003). In this investigation, the Gaussian Radial Basis function and the Polynomial function are used as the kernel function of SVM, because these kernels tend to give good performance under general smoothness assumptions. Consequently, they are especially useful if no additional knowledge of the data is available (Hall, 1998).
Support Vector Regression (SVR) is a recently introduced approach to regression problem (Smola et al., 1998). It is a variation of Support Vector Machine (SVM), which was developed by Vapnik and his co-workers (Vapnik, 1998). Nowadays, SVR has been successfully applied to time series prediction (Mukherjee et al., 1997) and financial forecasting (Tay and Cao, 2001).
In general, SVR uses the ε-sensitive loss function to measure the empirical risk and minimizes the regression error based on the Structural Risk Minimization (SRM) principle (Vapnik, 1995). Therefore, SVR need to be tested its efficiency in predicting the KLSE stock price due to financial data embedded noise.
Support Vector Machine as an emerging type of machine learning based on statistical learning theory, has proved its success in regression and time series forecast. This is clearly shown in a research done by Lu that using air pollutant data for prediction and as a result, Support Vector Machine has performed better as compared to RBF network (Lu et al., 2002).
In their research, the result showed that SVM with Radial Basis Function kernel function produces smaller MAE values either for 24 hour or for one-week prediction in advance than that of RBF network. As we know, the weaknesses of RBF network are derived from its belongings to the family of neural network, which possessed typical problems of over fitting training and local minima and high influences of parameter selection on the model.
need more data to estimate the parameters, or we are less certain in our estimates (and thus in the overall usefulness of the model). Therefore, SVM is needed to test the relationships between model complexity and reliability by comparing different parameters.
Initially, SVM is a novel type of learning machine, based on statistical learning theory, which contains polynomial classifiers, neural networks and radial basis function (RBF) networks as special cases (Scholkopf, 1997). Thus, parameter selections become a challenging task especially in stock market forecasting in order to produce better prediction results.
Meanwhile, Vanajakshi and Rilett (2004) have compared two machine learning techniques performance that are ANN and SVM. They used these two machine learning techniques to predict traffic speed for intelligent transportation system (ITS). Based on the result, it is clearly shown that the proposed Support Vector Machine model using Support Vector Regression (SVR) with selection of RBF kernel is a viable alternative to ANN in short term prediction. It is because ANN performance depends largely on the amount of data available for training the network.
Therefore, if there is a situation where the available data are less and training data is not a good representation of the whole data, Vanajakshi and Rilett (2004) suggested SVR as another option for prediction problem. This is essentially same situation as the stock market where short term and long term prediction is important for those investors to gain more profit.
11
difficulties in parameters selection that resulted in inconsistent MAPE. So, the efficiency of Support Vector Machine in stock market forecasting needed to be examined comparing with other machine learning techniques.
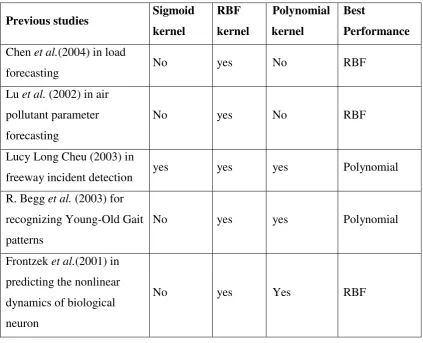
Table 1.4 : Kernels used by previous researchers
Previous studies Sigmoid kernel RBF kernel Polynomial kernel Best Performance Chen et al.(2004) in load
forecasting
No yes No RBF
Lu et al. (2002) in air pollutant parameter forecasting
No yes No RBF
Lucy Long Cheu (2003) in freeway incident detection
yes yes yes Polynomial
R. Begg et al. (2003) for recognizing Young-Old Gait patterns
No yes yes Polynomial
Frontzek et al.(2001) in predicting the nonlinear dynamics of biological neuron
No yes Yes RBF
As mentioned earlier, kernel functions are main issue in SVM. Thus, a variety of kernel functions have been tested with SVM and amongst them, radial basis function (RBF) have shown remarkable results (Lu et al., 2002; Chen et al., 2004; Zhu et al., 2002).
prediction are not highlighted and justified in above literatures. Moreover, the performance of kernel functions is varying between different problems, parameters and scaling methods.
In the research done by Lin and Lin (2003), they used different data sets (heart, diabetes and others), and the sigmoid kernel function have produced an at par performance with RBF kernel with a proper selection of parameters. While, Frontzek et al. (2001) concluded that RBF and polynomial were able to learn the nonlinear dynamics of biological data but sigmoid failed in learning the problem. Therefore, the accuracy of SVM with RBF and polynomial kernel functions need to be tested in order to produce promising results in KLSE stock prediction.
Meanwhile, Ali and Smith (2003) and Parrado-Hernandez et al. (2003) also claimed that no specific kernel functions has the best generalization performance for all kind of problem domains and a priori information on which kernel function is the most appropriate to be used is ambiguous such that combining different type of kernels are suggested to solve a given problem in SVM. Moreover, there is no literature that compared the performance of different kernels functions in predicting KLSE stock price. Thus, the comparison on the performance of RBF and polynomial kernel functions as well as neural network in KLSE stock prediction need to be justified.
Besides, Rahayu (2004) in her research also have compared three different kernel functions, which are RBF, linear and polynomial in bioactivity prediction and compound classification. Based on result obtained, RBF kernel outperform other kernels due to its ability to handle non-linear relation between class labels and attributes and has hyper parameters that influence the complexity of model (Hsu et al., 2003). Although RBF kernel function is popular among researchers, another high dimensional kernel function like polynomial has the potential of producing promising results (Frontzek et al., 2001).
13
Vector Machine, of which only one can result in better stock price prediction in Kuala Lumpur Stock Exchange domain. Besides that, ANN is used to compare and evaluate the prediction performance of SVM and a detail comparison between ANN and SVM will be discussed on their strengths and weaknesses. Last but not least, this study is also concerned in evaluating the effectiveness of various data segments in stock data prediction against SVM and ANN models.
1.3 Problem Statement
In order to cater the problems stated in section 1.2, this project is carried out in order to answer the following questions:
1. How is the stock prices prediction performance while applying Support Vector Regression in stock market forecasting?
2. Which kernel functions (Polynomial or Radial Basis Function) give better results on stock data prediction?
3. Is SVM specifically tailored for one single stock or is that model general enough to predict more than one stock or even for KLSE index?
4. How accurate is the SVM prediction if comparing with ANN?
1.4 Project Objectives
Various prediction techniques were studied in stock market prediction field and still nowadays researchers are focusing on implementing the latest technique in order to improve the stock market prediction model. Therefore, this project is carried out in order to fulfill the following objectives:
1. To predict the future stock prices value that can help trigger warning on potential buy or sell.
2. To determine which kernel functions namely Radial Basis Function (RBF) and Polynomial give better performance in predicting future Kuala Lumpur Stock Exchange stock prices value.
3. To make comparisons between two techniques which are Support Vector Machine and Neural Network that can improve the accuracy of KLSE stock market prediction.
4. To find out whether data segmentation and data transformation can improve stock prices prediction performance.
Realization of the fact that "Time is Money" in business activities, decision making plays an important role especially in stock exchange market. Therefore, it is a must for this study to investigate the accuracy of different learning techniques (SVM and NN) in predicting stock price. Then, the managers can make their valuable decision where time and money are directly related.
15
1.5 Project Scopes
The objectives of this study have been stated at the previous page. In order to achieve these objectives, it is important to identify the research areas, which cover the following aspects:
1. This project is focused on KLSE stock market domain by using End Of Day (EOD) data obtained from Kuala Lumpur Stock Exchange (KLSE) from year 1992 until 2006.
2. Support Vector Machine technique was implemented in predicting the stock prices. Radial basis function and polynomial kernel functions were applied and result from both were compared to find the suitable kernel function to be used in SVM for KLSE stock data prediction.
3. Only two machine learning techniques which are Support Vector Machine and Back Propagation Neural Network will be taken into consideration for stock prices prediction.
4. The predicted output obtained using Support Vector Machine was compared with the actual output and the performance was compared using Mean Square Error (MSE)
5. Performance benchmark on prediction was compared with Back Propagation Neural Network.
1.6. Importance of The Study
This study is carried out with the main objective of evaluating the performance of Support Vector Machine in predicting KLSE stock prices by using different kernels. Therefore, some importance of this study is stated and based on the results obtained, it is hoped that this study is able to:
1. To encourage more works in exploring the advantages of Support vector Machine in term of different kernel selections for financial data prediction (not only stock market but also included currency rates, bonds, credits and others) in different domain, different segment of data and different time periods.
2. To give exposure on another promising technique of stock market prediction (Support Vector Machine) that could offer superior or at least same performance as the existing techniques (ANN or statistical approaches). 3. To provide basis for researchers who are interested in applying Support
Vector Machine algorithm in fundamental data such as accounting information and company development or historical data (closing price, open prices, high prices, low prices and volume).
4. To encourage more studies on Support Vector Machine in term of different kernel selections (sigmoid kernel, linear kernel, RBF kernel or polynomial kernel) for stock prediction or stock selection.
17
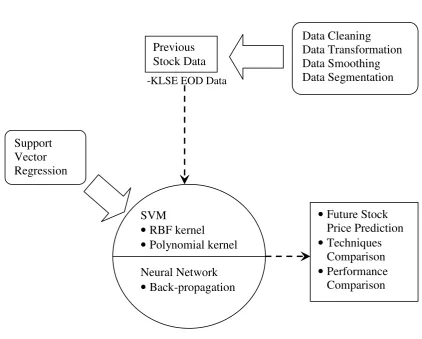
1.7 Theoretical Framework
Figure 1.1 Theoretical framework
From the theoretical framework, it is clear that the input data consisted of a series of past End Of Day stock market data obtained from Kuala Lumpur Stock Exchange. These data will go through some pre-processing process such as data transformation and smoothing before evaluated by the chosen techniques. Then, SVM and Back-propagation network will be used to predict the future stock price by using different data segments and different time frame. Finally, the predicted output will compare with the actual stock prices for performance evaluation. In additions, some techniques comparison will be stated and the performance between SVM (Radial Basis Function and Polynomial kernel) and BP network will be discussed.
•Future Stock Price Prediction
•Techniques Comparison
•Performance Comparison -KLSE EOD Data
Previous Stock Data
Data Cleaning Data Transformation Data Smoothing Data Segmentation
SVM
• RBF kernel
• Polynomial kernel Neural Network
• Back-propagation Support
1.8 Report Organization
The organization of report comprised of five chapters. Chapter One explains an overall introduction on project’s problem background, problem statement, objectives, scopes, importance of study, theoretical framework and definition of terms. In Chapter Two, a detailed review of past researchers studies will be discussed. It involves description on techniques in stock market prediction, KLSE Stock data, time series modeling and stock prediction, data mining operations and techniques and lastly support vector machine and artificial neural networks. After the analysis of past research, it is followed by Chapter Three, which presents the project framework and methodology. The project framework starts with the data collection, analysis on KLSE stock market domain, design of support vector machine structure that includes data prepossessing and parameter selection, experiments on the prepared data, analysis and comparison on experimental results.
143
REFERENCES
Alan, F. and Palaniswami, M. (2001). Stock Selection using Support Vector Machines. Department of EEE, University of Melbourne, VIC 3010, Australia.
Ali, S. and Smith, K. A. (2003). Automatic parameter selection for polynomial kernel. International Conference on Information Reuse and Integration. IRI 2003. 27-29 Oct. 2003 .IEEE: 243 – 249.
Amir, A., Talaat, N. and Shaheen, S. (1997). An Efficient Stock Market Forecasting Model Using Neural Networks. Cairo University. Giza, Egypt.
Antonio, G. B., Claudio, O. U., Manuel, M. S. and Nelson, O. M. (1996). Stock Market indeces in Santiago de Chile: Forecasting Using Neural Networks. Department Physiology, Electronics and Economic Studies. University of Valparaiso. Chile
Asim, M., Malik, M. U., Mohsin, F. and Muttee, A. (2005). Stock Market Prediction Software using Recurrent Neural Networks. Department of Computer Science Lahore University of Management Sciences. Lahore.
Athanasios, S. and Costas, S. (2005). Time Series Forecasting of Averaged Data With Efficient Use of Information. IEEE Transactions on Systems, man, and Cybernetics - Part A: Systems and Humans, Vol. 35, No. 5.
Banks, J., Spoerer, P. and Collins, R. (1986). ZBM PC Applications for the Industrial Engineer and Manager. Prentice-Hall. Englewood Cliffs, NJ.
Bao, Y., Lu, Y., and Zhang, J. (2004). Forecasting Stock Price by SVMs Regression. In C. Bussler and D. Fensel (Eds): AIMSA 2004. Lecture Notes Artificial Intelligence. Berlin: Springer-Verlag. 295–303.
Barnett, V. and Lewis, T. (1994). Outliers in Statistical Data. Third edition. Wiley.
Begg, R. and Kamruzzaman, J. (2003). A Comparison of Neural Network and Support Vector Machines for Recognizing Young-Old Gait Patterns. Australia. IEEE.
Boser, B. E., Guyon, I. M. and Vapnik, V. (1992). A training algorithm for optimal margin classifiers. In D. Haussler, editor, Proceedings of the 5th Annual ACM Workshop on Computational Learning Theory, Pittsburgh, PA, ACM Press, pages 144-152.
Bowerman, B.L. and O’Connell, R. T. (1979). Time Series and Forecasting:An Applied Approach. Belmont, California: Duxbury Press.
Box, G. E. P., Jenkins, G. M., Reinsel, G.C. (1994). Time Series Analysis, Forecasting and Control. Ed. Englewood Cliffs: Prentice Hall, 3 edition.
Brian, J. R. (2004). Data Mining and Science? Knowledge discovery in science as opposed to business. CLRC Rutherford Appleton Laboratory Chilton, Didcot, Oxon OX11 0QX, UK.
Burges, C. J. C. (1998). A tutorial on support vector machines for pattern recognition. Data Mining and Knowledge Discovery, 2(2):121-167.
Campbell, C. and Bennett, K. P. (2001): A linear programming approach to novelty detection. In Advances in Neural Information Processing Systems 14.
145
Singapore, Singapore 119260. IEEE Transactions on Neural Networks, Vol. 14, No. 6.
Cao, L. J. and Gu, Q. M. (2002). Dynamic Support Vector Machines for Non-stationary Time Series Forecasting. Intelligent Data Analysis, 6, pp.1-16.
Casdagli, M., Eubank, S. (1992). Nonlinear Modelling and Forecasting. Reading MA, Addison-Wasley.
Castillo, G. S. and Melin, P. (2001). Simulating and Forecasting Complex Economic Time Series Using Neural Network and Fuzzy Logic. IEEE.
Chakraborty, K., Kishan, M., Chilukuri, K. M. and Sanjav, R. (1992). Forecasting the Behavior of Multivariate Time Series Using Neural Networks. Neural Networks 5, 961-970.
Chen, B. J., Chang, M. W. and Lin, C. J. (2004). Load Forecasting Using Support Vector Machines: A Study on EUNITE Competition 2001. IEEE Transactions on Power Systems. Volume 19(4): 1821-1830.
Chen, C. H. (1994). Neural Networks for Financial Market Prediction. Proc. 1994 IEEE International Conference on Neural Networks, 1199-1202.
Cherkassky, V. and Mulier, F. (1998). Learning from Data - Concepts, Theory and Methods. John Wiley & Sons, New York.
Christianini, N. and Shawetaylor, J. (2000). An introduction to Support Vector Machines. Cambridge University Press, London.
Chu, F. and Wang, L. (2003). Gene Expression Data Analysis using Support Vector Machine. IEEE.
Chua, K. S. (2003). Efficient Computations for Large Least Square Support Vector Machine Classifiers. Pattern Recognition Letters, 24, pp.75-80.
Chun, H. W., Chia, C. W., Chang, M. H., Su, D. C. and Ho, J. M. (2004). Travel Time Prediction with Support Vector Machine. Institute of Information Science, Academia Sinica, Taipei, Taiwan.
Clarence, N. W. (1993). Trading a NYSE-Stock with a Simple Artificial Neural Network-based Financial Trading System. School of Information Technology, Australia. IEEE.
Darmadi, K., Chein, I. C. and Hanseok, K. (1994). Neural Network Technology For Stock Market Index Predixtion. Department of Electrical Engineering, University of Maryland Baltimore County Baltimore.
Dibike, Y. B., Velickov, S., Solomatine, D., and Abbott M. B. (2001). Model Induction with Support Vector Machines: Introduction and Applications. ASCE Journal of Computing in Civil Engineering.15 (3): 208-216.
Diehold, F. X. (1998). Elements of Forecasting. Cincinnati: South-Western.
Drossu, R., Obradovic Z. (1996). Rapid Design of Neural Networks for Time Series Prediction. Washington State University, IEEE Computational Science and Engineering.
147
Eric, A. P. (2000). Time Series Forecasting with Feed-forward Neural Networks: Guidelines and Limitations. Thesis for Master of Science in Computer Science, University of Wyoming.
Farmer, J. D. and Sidorowich, J.J. (1988). Can New Approaches to Nonlinear Modeling Improve Economic Forecasts? In Anderson. Addison-Wesley.
Fayyad, U. (1997). Data Mining and Knowledge Discovery in Database:Implications for Scientific Databases.Proceedings of the IEEE.
Fayyad, U., Piatetsky-Shapiro, G., and Smyth, P. (1996). From Data Mining to Knowledge Discovery in Databases. AI Magazine. American Association for Artificial Intelligence. (37-54).
Fernando, P. C., Julio, A. R. and Javier, G. (2003). Estimating GARCH models using support vector machines. Institute Physics Publishing, Quantitative Finance Volume 3 1-10.
Fletcher, D. and Gouss, E. (1993) Forecasting with Neural Networks: An Application using Bankruptcy Data. Information and Management. 24(3): 159-167.
Friedman, J. (1991). Multivariate Adaptive Regression Splines. Annals of Statistics, 19: 1-142.
Fritz, M. (1940). The Stock Market, Credit and Capital Formation. University of Buffalo. London.
Frontzek, T., Navin Lal, T. and Eckmiller, R. (2001). Predicting the Nonlinear Dynamics of Biological Neurons using Support Vector Machines with Different Kernels. Proceedings. IJCNN '01. International Joint Conference on Neural Networks, 2001,15-19 July 2001.IEEE.1492 – 1497.
Ganesh, M., Kung, K. Q., Sam, M. and Barr (1995). An Analysis of Neural-Network Forecasts from a Large Scale, Real-world Stock Selection System. LBS Capital management.
Gershenson, C. (1998). Artificial Neural Networks for Beginners.
Gia, S. J., Lai, F. P., Jiang, B. W. and Chien, L. H. (1991). An Intelligent Trend Prediction and Reversal Recognition System Using Dual-module Neural Networks. Taipei, Taiwan. IEEE.
Giovanni, C. (2003). A Comparison of Stock Market Mechanisms. Department of Science Economic. University of Degli Study Di Salerno. Fisciano.
Haykin, S. (1999). Neural networks: a comprehensive foundation. Englewood CliKs, NJ: Prentice Hall.
Hoff, J. C. (1983). A Practical Guide to Box-Jenkins Forecasting. Belmont, California: Lifetime Learning Publication.
Hossein, A. (1996). Time Series Analysis and Forecasting Techniques.
http://obelia.jde.aca.mmu.ac.uk/resdesgn/arsham/opre330Forecast.htm
Hsu, C. W., Chang, C. C., and Lin, C. J. (2003). A Practical Guide to Support Vector Classification. National Taiwan University. Taiwan.
Hsuan, T. L. and Chih, J. L. (2004). A Study on Sigmoid Kernels for SVM and the Training of non-PSD Kernels by SMO-type Methods. National Taiwan University, Taiwan.
149
Jan, K., Jirí, K. and Martin, V. (2003). Predictive System for Multivariate Time Series. Department of Cybernetics, Applied Research Department, Czech Republic.
Jayavarfhana, R. G. L., Alistair, P. S., Michael, M. P. and Marimuthu, P. (2005). Prediction of Cystine Connectivity Using SVM. The University of Melbourne, Victoria.
Jing, T. Y. and Hean, L. P. (1997). Forecasting The KLSE Index Using Neural Network. National University of Singapore, Singapore.
Johan, A. K. S. (2001). Nonlinear Modeling and Support Vector Machines. Department of Electrical Engineering ESAT-SISTA, Belgium.
John, L. (1965). The valuation of risk assets and the selection of risky investments in Stock Portfolios and Capital Budgets. Review of Economics and Statistics.
Kaastra, I. and Boyd, M. (1996). Designing a neural network for forecasting financial and economic time series. Neurocomputing, vol. 10, pp. 215-236.
Kamijo, K. and Tanigawa, T. (1990). Stock Price Pattern Recognition – A Recurrent Neural Network Approach. Proc. IJCNN at San Diego, Vol.1, pp.215-221.
Kamruzzaman, J., Sarker, R. A. and Ahmad, I. (2003). SVM Based Models for Predicting Foreign Currency Exchange Rates. Proceedings of the Third IEEE International Conference on Data Mining (ICDM’03). IEEE.
Karsten, S. and Cihan, H. D. (1996). Stock Market Prediction Using Different Neural Network Classification Architectures. University of Missouri, Rolla, MO.
Kim, T. W. and Valdes, J. B. (2003). Nonlinear Model for Drought Forecasting Based On a Conjunction of Wavelet Transforms and Neural Networks. Journal of Hydrologic Engineering, 8:6 (319-328).
Kolarik, T. and Rudorfer, G. (1994) Time Series Forecasting Using Neural Network. Time Series and Neural Networks. 86-94.
Kwok, J. T. (2001). Linear Dependency Between And the Input Noise in Support Vector Regression. ICANN 2001, LNCS 2130 405-410.
Lapedes, A., Farber, R. (1987). Nonlinear Signal Processing using Neural Networks. Prediction and System Modelling. Los Alamos National Laboratory.
LeBaron, B. (1994). Technical Trading Rule Profitability and Foreign Exchange Intervention. Technical Report, Dept. of Economics, Univ. of Wisconsin Madison.
Lendase, A. , De Bodt, E., Wertz, V. and Verleysen, M. (2000). Non-linear Financial Time Series Forecasting – Application to the Bel 20 Stock Index. European Journal of Economic and Social Systems, 14 : 81-91.
Lin, H. T. and Lin, C. J. (2003). A study On Sigmoid Kernels for Support Vector Machine and the Training of non-PSD Kernels by SMO-type methods. [Online] at http://www.csie.ntu.edu.tw/~cjlin/papers/tanh.pdf
Lu, W. Z., Wang, W. J., Leung, A. Y. T., Lo, S. M., Yuen, R. K. K., Xu, Z. and Fan, H.Y. (2002). Air Pollutant Parameter Forecasting Using Support Vector Machines. Proceedings of the 2002 International Joint Conference on Neural Networks, 2002. IJCNN '02. , May 12-17, 2002. IEEE, Volume: 1,Pages: 630 – 635.
151
Mantegna, R. and Stanley, E. (2000). An Introduction To Econophysics: Correlations and Complexity in Finance. Cambridge Univ. Press.
Masters, T. (1993). Practical Neural Network Recipes in C++. New Yeok, NY: Academic Press. 266-267, 328-341, 411.
McCullagh, J., Bluff, K. and Ebert, E. (1995). A Neural Network Model for Rainfall Estimation. IEEE.
Mendelsohn, L. (2001). Neural Network Development for Financial Forecasting. Technical Analysis of Stocks & Commodities.
Milliaris, M. E. (1994). Modeling the Behavior of the S&P500 Index. A Neural Network Approach. Proc 10th IEEE Conference on AI for Applications, 86-90.
Morphy, J. J. (1986). Technical Analysis of the Futures Markets, A Comprehensive Guide to Trading methods and Applications. New York Institute of Finance.
Mukherjee, S., Osuna, E. and Girosi, F. (1997). Nonlinear prediction of chaotic time series using support vector machines. In J. Principle, L. Giles, N. Morgan and E. Wilson, editors, IEEE Workshop on Neural Networks for Signal Processing VII, page 511, IEEE Press.
Muller, J. T., Smola, A. J., Ratsh, G., Scholkopf, B., Kohlmorgen, J. and V. Vapnik (1997). Predicting Time Series With Support Vector Machines. In ICANN, pages 999-1004.
Nelson, M., Hill, T., Remus, W. and O’Connor, M. (1999). Time Series Forecasting using Neural Networks: Should the Data be Deseasonalized First?. Journal of Forecasting.18:359-367.
Engineering Management, The Chinese University ofr Hong Kong, Shatin, N. T., Hong Kong. ICMIT.
Norashikin binti Ahmad (2003). Pengkelasan Data Kajicuaca Di Dalam Peramalan Hujan Dari Pelbagai Sumber Menggunakan Rangkaian Neural.Universiti Teknologi Malaysia: Master Thesis.
Norio, B. and Hishasi, H. (1996). Utilization of Neural Network for Constructing a User Friendly Decision Support System to Deal Stocks. Information Science, Osaka, Kyoiku University, Asahiga-Oka. Kashihara City, Osaka Prefecture, 582, Japan.
NYSE Net: About the NYSE, Capt. About the Exchange, HTTP adress
http://www.nyse.com/public/about/market/flowchrt.htlm
Okamoto, T., Ueda, Y. and Kunishige, M. (1995). The Distributed Multimedia Learning Environment Employing Gaming/Simulation Method with Expert System in the world of Macro Economics. Computer and Artificial Intelligence, Vol. 14, No.4, 395-415.
Osborne, M. F. M. (1964). Brownian Motion in The Stock Market, The Random Character of Stock Market Prices. M.I.T. Press.
Osuna, E., Freund, R. and Girosi, F. (1997). Support Vector Machines: Training and Applications. Artificial Intelligence Memo 1602, MIT.
Ovidiu, I. (2002). Structure-Odor Relationships for Pyrazines with Support Vector Machines. Internet Electron. J. Mol. Des. 2002, 1, 269-284
Pai, H. C., Chih, J. L. and Scholkopf, B. (2003). A Tutorial on v-Support Vector Machines. National Taiwan University, Taipei 106, Taiwan.
153
of Information System, School of Computing. National University of Singapore. Singapore.
Parrado-Hernandez, E., Mora-Jimenez, I., Arenas-Garcia, J., Figueiras-Vidal, A. R., and Navia-Vazquez, A. (2003). Growing Support Vector Classifiers With Controlled Complexity. Pattern Recognition. 36:1479.1488.
Peters, E. E. (1991). Chaos and Order in the Capital markets : A New View of Cycles, Prices and Market Valatility. John Wiley & Sons Inc.
Povinelli, R. J. (2001). Identifying Temporal Patterns for Characterization and Prediction of Financial Time Series Events.J.F. Roddick and K. Hornsby (Eds.): TSDM 2000, LNAI 2007. Springer-Verlag Berlin Heidelberg : 46-61.
Prasanta, K. J. (2004). A Neural Network Based Time Series Forecasting. Dept. of Computer Sc. & Eng,. Indian School of Mines Dhanbad - 826 004, India. IClSlP.
Rahayu binti Hamid (2004). Bioactivity Prediction And Compound Classification Using Neural Network And Support Vector Machine: A Comparison. Universiti Teknologi Malaysia: Master Thesis.
Rakesh, A., Johann, C. F. and Raghu, R. (2004). Data Mining: The Next Generation. Dagstuhl Workshop.
Raman, L. (1997). Using Neural Networks to Forecast Stock Market Prices. University of Manitoba: Course project.
Rozilawati binti Dollah@Md. Zain (2001). Pengelompokan Data Kajicuaca Dalam Perlombongan Data:Perbandingan Antara Kaedah Statistic Dan Teknik Peraturan Kesatuan.Universiti Teknologi Malaysia: Master Thesis.
Rucy, L. C., Dipti, S. and Eng, T. T. (2003). Support Vector Machine Models for Freeway Incident Detection. 0-7803-8125-4/03 IEEE.
Rumelhart, D. and McClelland, J.(1986). Parallel Distributed Processing. MIT Press, Cambridge, Mass.
Sansom, D. C., Downs, T., and Saha, T. K. (2002). Evaluation Of Support Vector Machine Based Forecasting Tool In Electricity Price Forecasting for Australian National Electricity Market participants. Journal Elect. Electron. Eng. Australia., 22: 227–234.
Scholkopf, B. and Smola, A. J. (2002). Learning with Kernels. MIT Press, Cambridge, MA.
Scholkopf, B., Kah, K. S., Chris, J. C., Burges, Federico, G., Niyogi, P., Poggio, T., Vapnik, V. (1997). Comparing Suppourt Vectors Machines with Gaussian Kernels to Radial Basis Function Classifiers. Transactions on signal processing, Vol. 45. IEEE.
Scholkopf, B., Platt, J.C., Shawe, T. J., Smola, A. J. and Williamson, R. C. (2001). Estimating the support of a highdimensional distribution. Neural Computation, vol. 13, no. 7, pp. 1443-1471.
Scholkopf, B., Williamson, R., Smola, A., Shawe, T. J. and Platt, J. (2000). Support vector method for novelty detection. In Advances in Neural Information Processing Systems 12.
155
Sheng, C. C., Hung, P. C. and Chun, H. C. (1999). A Forecasting Approach for Stock Index Future Using Grey Theory and Neural Networks. School of Management Science, Taiwan.
Smola, A. J. and Scholkopf (1998). A Tutorial on Support Vector Regression. Technical Report NC2-TR-1998-030, NeuroCOLT2.
Solomatine, D. P. (2002). Data-driven Modelling:paradigm, Methods and Experiences. Proc. Fifth International Conference on Hydroinformatics, Cardiff, UK.
Speecht, D. F. (1990). Probabilistic Neural Networks. Neural Networks, 1, 109-118.
Stefan, Z. (1997). On Developing a Financial Prediction System: Pitfalls and Possibilities. Stockholm University and Royal Institute of Technology, Sweden. Mitchell, T. Machine learning. McGraw Hill.
Stefano, N. and Domenicom, P. (2001). Evolution of Artificial Neural Networks. Institute of Psychology, Rome.
Stergiou, C. (1996). What is a Neural Network?.
http://www.doc.ic.ac.uk/~nd/surprise 96/jouranl/vol1/article1.html.
Street, N. (1998). A Neural Network Model for Prognostic Prediction, Oklahoma State University, In Proceedings of the Fifteenth International Conference on Machine Learning, pages 540-546, San Francisco.
Tax, D. M. J. and Duin, R. P. W. (1999). Support Vector Domain Description. Pattern Recognition Letters. 20, 1191-1199.
Teh, E. L. (2004). Stock Price Prediction Using Kohonen Network. University of Technology Malaysia. Degree Thesis.
Tetsuji, T. and Ken’ichi, K. (1992). Stock Price Pattern Matching System. C & C Information technology Research Laboratories, NEC Corporation. IEEE.
Theodore, B. T. and Huseyin, I. (2000). Support Vector Machine for Regression And Applications To Financial Forecasting. University of Oklahoma, Norman, Oklahoma.
Thierry, C. (1996). Neural Networks Models for the Prediction of Stock Return Volatility. Katholieke Universiteit Leuven de Croylaan, Belgium. IEEE.
Thiesing. F. and Vornberger (1997). Forecasting Sale Using Neural Network. University of Osnabrueck, Computational Intelligence, Bernd Reusch (ed.), Proc. International Conference, 5th Fuzzy Days, Dortmund, Germany, April 28-30.
Thomason, M. (1999). The Practitioner Methods and Tool. Journal of Computational Intelligence in Finance 7(4):35-45.
Tong, H. (1990). Non-linear Time Series, Oxford University Press.
Tong, S. and Chang, E. (2001) Support Vector Machine Active Learning for Image Retrieval. MM’OI. Sept. 30-Oct. 5,2001. Ottawa, Canada: ACM,107-118.
Tong, S. and Koller, D. (2003). Support Vector Machine Active Learning with Applications to Text Classification. Journal of Machine Learning Research .45-66.
157
Valverde, R. M. C., Ferreira, N. J. and Velho, H. F. (2005). Artificial Neural Network Technique for Rainfall Forecasting Applied To the Sao Paulo Region. Journal of Hydrology. 301:146–162.
Vanajakshi, L. and Rilett, L.R. (2004). A Comparison of The Performance of Artificial Neural Network and Support Vector Machines for The Prediction of Traffic Speed. 2004 IEEE Intelligent Vehicles Symposium. June 14-17. University of Parma, Parma, Italy:IEEE, 194-199.
Vapnik, V. (1998). Statistical Learning Theory. New York: Wiley.
Vapnik, V. (1995). The Nature of Statisticak Learning Theory. Springer-Verlag New York, Inc.
Velickov, S., Solomatine, D. P., Yu, X. and Price, R. K. (2000). Application of Data Mining Techniques for Remote Sensing Image Analysis. Proc Forth Int. Conference on Hydroinformatics, U.S.A.
Wang, L. (1994). A General Design For Temporal Sequence Processing Using Any Arbitrary Associative Neural Network. Artificial Intelligence - Sowing the seeds to the future, Armidale New Wales, Australia, AI 21-25. Proceedings of the 7th Australian Joint Conference on Artificial Intelligence, World Scientific, Singapore.
Weigend, A. and Gershenfeld, N. (1994). Time Series Prediction – Forecasting the Future and Understanding the Past, Addison-Wesley, Reading, Massachussets.
William, S. (1964). Capital Asset Prices: A theory of Market Equilibrium. Journal of Finance.
Witten, I. H. and Frank, E. (2000). Data Mining. Morgan Kaufimann Publishers. Investopedia .Technical Analysis. Edmonton, AB, Canada.
http://www.investopedia.com/university/technical/.
Wong, R. C., Bodnovich, T. A. and Selvi, Y. (1995). A bibliography of neural network business applications research: 1998-September 1994. Expert System, Vol. 12, 3, pp. 253-262.
Wu, C. H., Ho, J. M., and Lee, D. T. (2004). Travel Time Prediction With Support Vector Regression. IEEE Transaction on Intelligent Transportation Systems. Volume 5(4): 276-281.
Yang, H. Q., Irwin, K. and Chan, L. W. (2003). Non-Fixed and Asymmetrical Margin Approach To Stock Market Prediction Using Support Vector Regression. The Chinese University of Hong Kong.
Yang, H., Chan, L. and King, I. (2002). Support Vector Machine Regression For Volatile Stock Market Prediction. Proceeding Intelligent Data Engineering and Automated Learning. H. Yin, N. Allinson, R. Freeman, J. Keane, and S. Hubbard, Eds. LNCS 2412:Springer, 391–396.
Zemke, S. (2002). Weka for financial prediction. Submitted.
Zhu, J.Y., Ren, B., Zhang, H. X. and Deng, Z. T. (2002) Time series prediction via new support vector machines. Proceedings of The First International Conference on Machine Learning and Cybernetics, November 4-5 2002, Beijing:IEEE, 364-366.