b
Department of Physisc, Faculty of Science, Universiti Teknologi Malaysia, 81310 Skudai, Johor, Malaysia.
Email Address: [email protected]
Abstract
Changes in surface roughness on the surface of copper was studied using AFM. A Q-switched Nd: Yag Laser was focused to optimize the copper surface area beam size at different energy levels. Different surface roughness of copper indicated when the laser is focused with different level energy, a different frequencies and a different number of pulses. Ra,(average), Rq(RMS) and Rq(grain-wise) show different readings at each different laser energy, different frequencies and different numbers of pulses. The conclusion shows the increasing surface roughness of copper will increase the level energy of laser, frequencies and number of pulses used.
Keywords: Surface Roughness; Ra(average); Rq (root mean square); Rq
(grain-wise)
1. INTRODUCTION
Roughness of surface is an important parameter for many manufacturing technologies. For focused pulsed laser processing surface depressions surrounded by a surface rim or solidified melt are often observed. The surface roughness or the topography of the modified surface is highly reproducible and can be controlled by varying the interaction parameters such as laser energy, pulse width, pulse shape and repetition rate [1, 9]. Laser is a powerful tool that can be used to improve surface properties such as hardness and wear resistance by modifying the composition and/or microstructure of the surface without affecting the properties of the bulk material.[2]
However, the surface roughness of the main investigation has been our goal to be analyzed. Therefore, in the present paper we intend to show the effect of the laser parameters on the microstructure of the copper surface change.
2. EXPERIMENT
A Q -switched Nd :YAG laser with a wavelength of fundamental 1064 nm, operating in repetitive mode at 1 Hz, 2 Hz and 3 Hz used as a source of energy. The laser pulse was 10ns and the output energy remained constant at 89 mJ per pulse. Laser concentrated using a convex lens with a focal length is 10 cm. In order to enlarge the area of the laser spot, the target is located at a distance of a defocused about 30 mm from the focal point.
A pure copper plate with a smooth surface was used as a substrate with a thickness of 2mm was cut in the size (length and width 1cm).
Atomic force microscope (AFM) was used to investigate the surface roughness of copper after laser focused on different energy sources. To assess the surface roughness of copper Gwyddion software version 2:45 utilized for measurement Ra(roughness average), Rq(RMS), and Rq(grain-wise).
3. RESULTS AND DISCUSSION
The characterization of surface topography and understanding is important in procedures involving friction, lubrication and adhesion force [4,11]. Surface measurements to determine the topography of the surface, which is important to adhere to the surface of suitability for specific functions. Surface measurements generally include surface, surface finish and surface roughness [5, 12]. In addition, the surface roughness can be characterized using various methods. Most sensitive to the different characteristics and are used for various types of rough surfaces [6, 10] is an atomic force microscope (AFM) to provide surface topography information directly to the final. Therefore, this section will describe the situation:
1. Surface roughness of the copper when focused with different laser energy.
2. Surface roughness of copper when the laser energy is focused with different frequencies
3. Surface roughness of copper when the laser energy is focused with different number of
pulses.
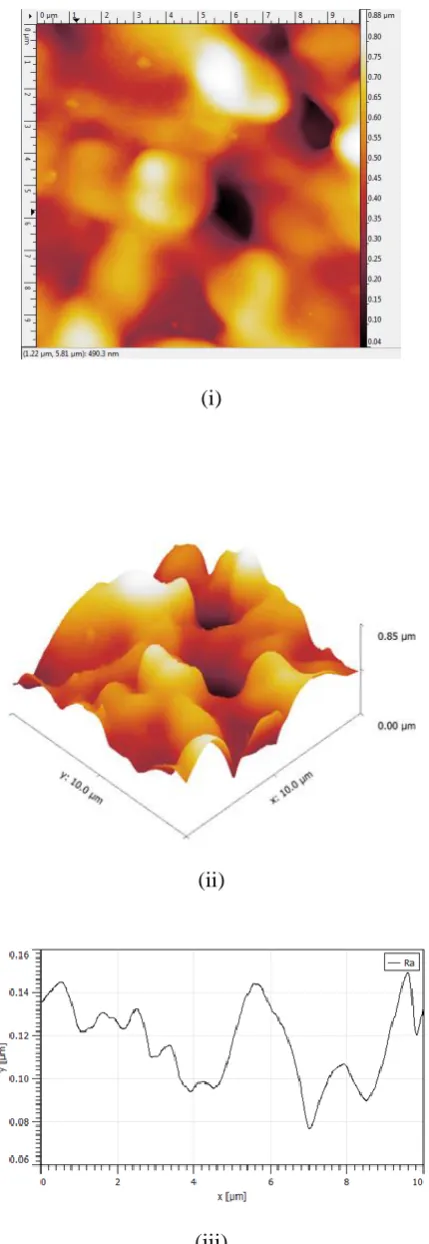
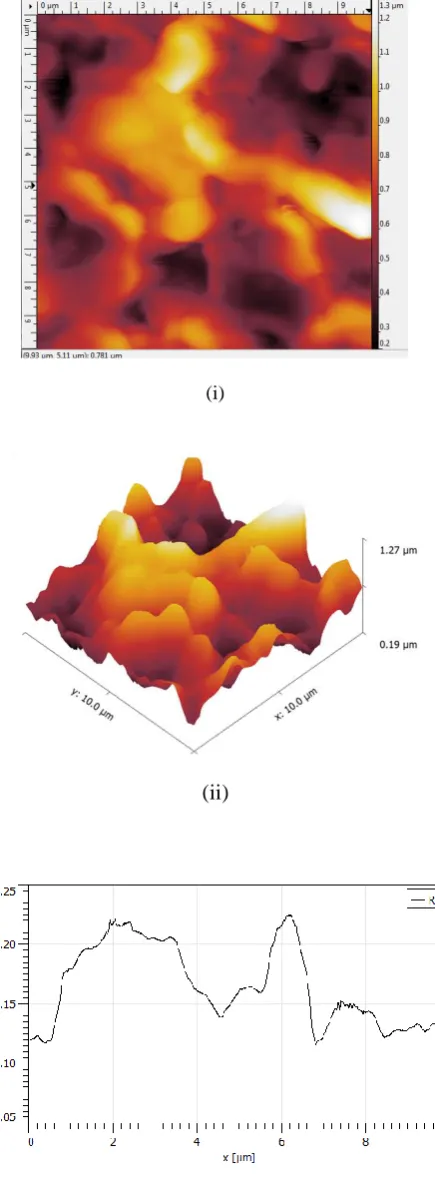
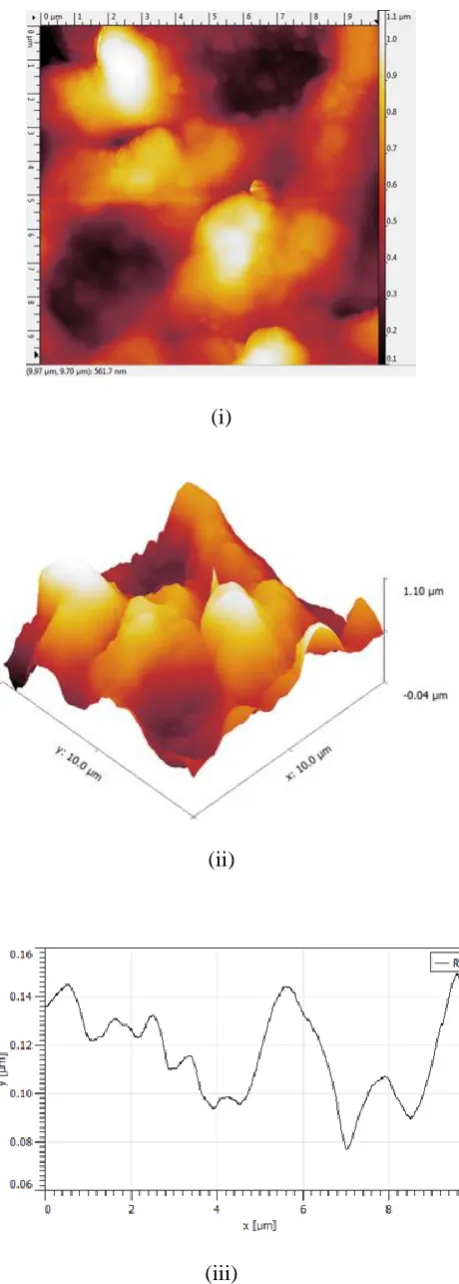
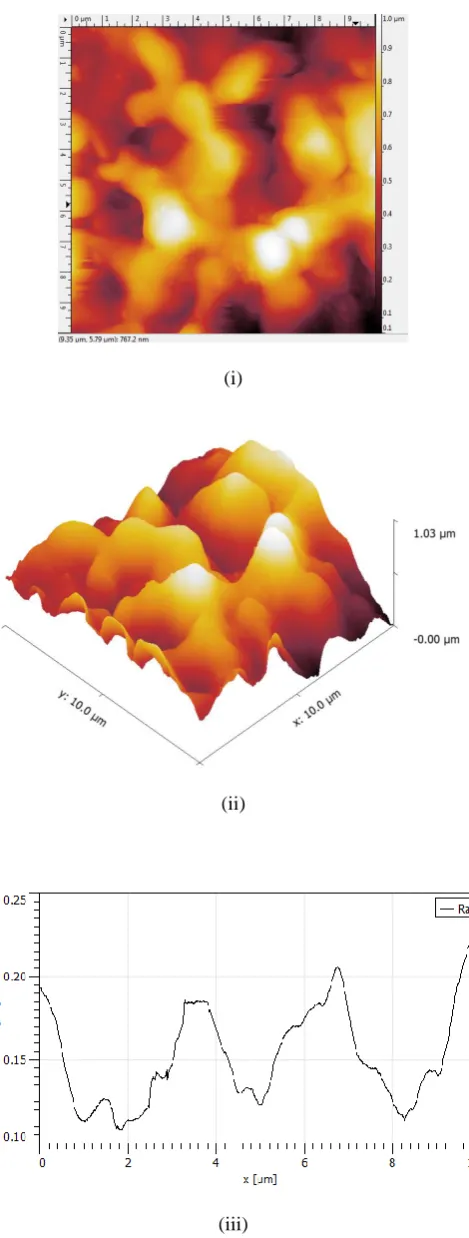
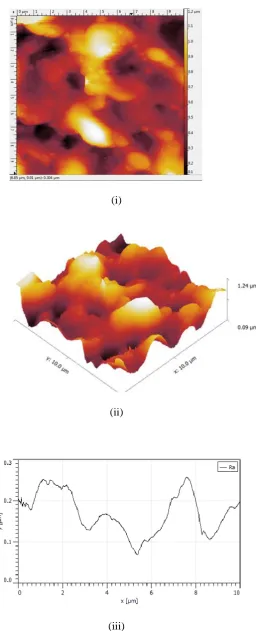
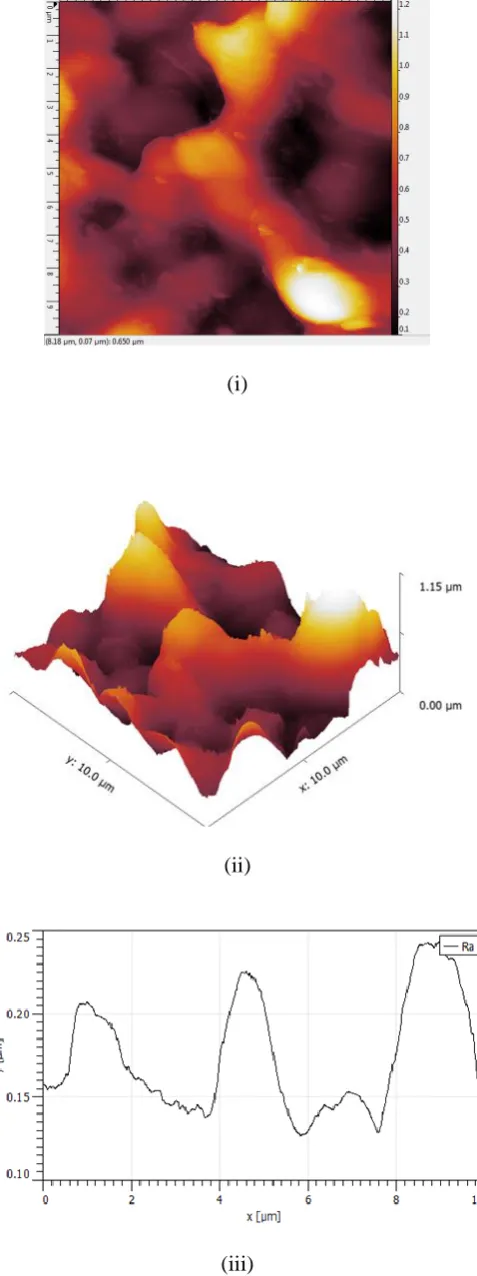
3.1 Surface roughness of the copper when focused with different laser energy
(i)
(ii)
(iii)
Figure 3.0 (a) AFM analysis on the copper surface with a focused laser
(i)
(ii)
(iii)
Figure 3.0 (b) AFM analysis on the copper surface with a focused laser
(i)
(ii)
(iii)
Figure 3.0 (c) AFM analysis on the copper surface with a focused laser
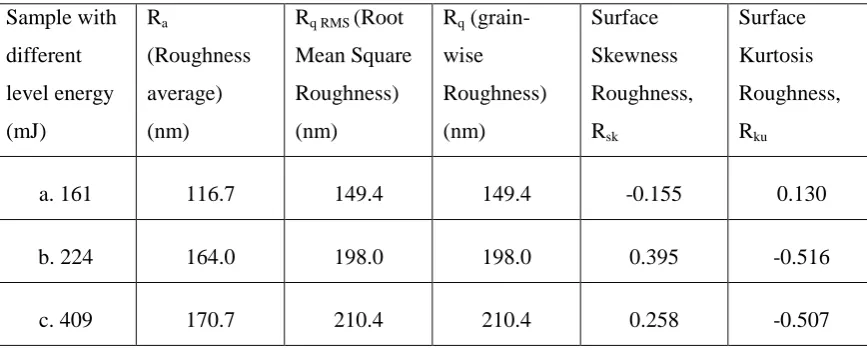
Table 3.0 Showing Ra, Rq, Rsk and Rku of sample with different level energy Sample with different level energy (mJ) Ra (Roughness average) (nm)
Rq RMS (Root
Mean Square Roughness) (nm)
Rq
(grain-wise Roughness) (nm) Surface Skewness Roughness, Rsk Surface Kurtosis Roughness, Rku
a. 161 116.7 149.4 149.4 -0.155 0.130
b. 224 164.0 198.0 198.0 0.395 -0.516
c. 409 170.7 210.4 210.4 0.258 -0.507
Sample (a) with laser energy 161mJ have a spiky surface as Rku > 0, while the sample (b) and
(c) with laser energy 224mJ and 409mJ have a bumpy surface as Rku < 0. Its show that, when
laser energy is focused at lower than the surface Rku > 0 while when the sample with the focused
laser energy is increased than the surface Rku < 0. Sample (a) with laser energy 161mJ having a
negative skewness as Rsk < 0, while the sample (b) and (c) with laser energy 224mJ and 409mJ
having a positive skewness as Rsk > 0. Its show that, when laser energy is focused at lower than
the surface Rsk < 0 while when the sample with the focused laser energy is increased than the
surface Rsk > 0. Ra, Rq(RMS) and Rq(grain-wise) increase when the surface skewness, Rsk > 0 at
the level laser energy 224mJ and 409mJ but the surface kurtosis, Rku < 0. While Ra, Rq(RMS) and
Rq(grain-wise) at the lower level laser energy then the surface skewness, Rsk < 0 but the surface
kurtosis, Rku > 0.
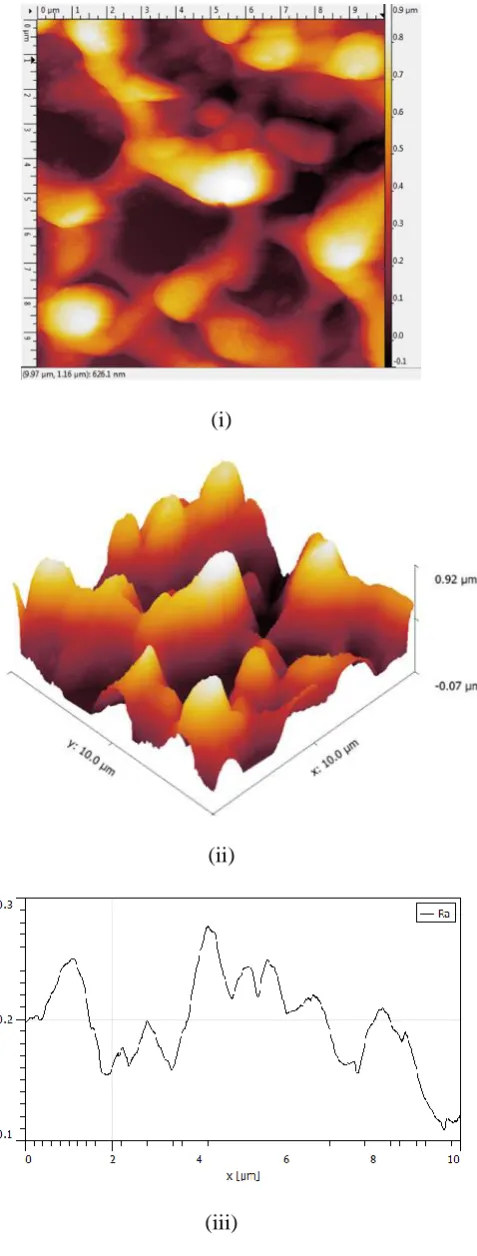
3.2 Surface roughness of copper when the laser energy is focused with different frequencies
AFM studies revealed that the copper sample when the laser energy is focused with different frequencies as shown in the table 3.1. Figure 3.1 (a), (b) and (c) show AFM analysis on the
copper surface with a different frequencies. The results show average roughness Ra increases as
the laser energy is focused with different frequency is increases. Rq(RMS) and Rq(grain-wise)
(i)
(ii)
(iii)
Figure 3.1 (a) AFM analysis on the copper surface with
(i)
(ii)
(iii)
Figure 3.1 (b) AFM analysis on the copper surface with
(i)
(ii)
(iii)
Table 3.1: Showing Ra, Rq, Rsk and Rku of sample with different frequency Sample with different frequency Ra (Roughness average) (nm)
Rq RMS
(Root Mean Square Roughness) (nm) Rq (grain-wise Roughness) (nm) Surface Skewness Roughness, Rek Surface Kurtosis Roughness, Rku
a. 1 Hz 152.9 185.7 185.7 -0.0394 -0.504
b. 2 Hz 170.0 212.0 212.0 0.5930 -0.130
c. 3 Hz 175.0 223.0 223.0 0.9900 0.7370
Sample (c) with the laser energy focused at frequency 3 Hz have a spiky surface as Rku > 0.5, while the sample (a) and (b) with laser energy focused at frequency 1Hz and 2Hz have a bumpy surface as Rku < 0. Its show that, when laser energy is focused at higher frequency than the surface Rku > 0.5 while when the sample with the focused laser energy at lower frequency than the surface Rku < 0. Sample (a) with the laser energy focused at 1Hz having a negative skewness as Rsk < 0, while the sample (b) and (c) with laser energy focused at 2Hz and 3Hz having a positive skewness as Rsk > 0.5. Its show that, when laser energy is focused at lower than the surface Rsk < 0 while when the sample with the focused laser energy is increased than the surface Rsk > 0.5. Ra, Rq(RMS) and Rq(grain-wise) increase when the surface skewness, Rsk > 0.5 at the laser energy focused at frequency 2Hz and 3Hz but the surface kurtosis, Rku < 0 for the laser energy focused at frequency 2Hz while surface kurtosis, Rku > 0.5 for the laser energy focused at frequency 3Hz. While Ra, Rq(RMS) and Rq(grain-wise) at lower frequency of laser energy then the surface skewness, Rsk < 0 and the surface kurtosis, Rku < 0.
3.3 Surface roughness of copper when the laser energy is focused with different number of
pulses
AFM studies revealed that the copper sample when the laser energy is focused with different number of pulses as shown in the table 3.2. Figure 3.2 (a), (b) and (c) show AFM analysis on the
copper surface with a different number of pulses. The results show average roughness Ra
increases as the laser energy is focused with different number of pulses is increases. Rq (RMS)
and Rq (grain-wise) roughness also increased when the laser energy is focused with different
(i)
(ii)
(iii)
(i)
(ii)
(iii)
(i)
(ii)
(iii)
Table 4.4: Showing Ra, Rq, Rsk and Rku of sample with different number of pulses Sample with different number of pulses Ra (Roughness average) (nm)
Rq RMS (Root
Mean Square Roughness) (nm)
Rq
(grain-wise Roughness) (nm) Surface Skewness Roughness, Rek Surface Kurtosis Roughness, Rku
a. 1 187.0 233.0 233.0 -0.1280 -0.2540
b. 2 196.7 240.6 240.6 0.4240 -0.8550
c. 3 241.0 300.0 300.0 0.8930 0.2660
Sample (c) with the laser energy focused at 3 number of pulses have a spiky surface as Rku > 0, while the sample (a) and (b) with laser energy focused at 1 and 3 number of pulses have a bumpy surface as Rku < 0. Its show that, when laser energy is focused at higher number of pulse than the surface Rku > 0 while when the sample with the focused laser energy at lower frequency than the surface Rku < 0. Sample (a) with the laser energy focused at 1 number of pulse having a negative skewness as Rsk < 0, while the sample (b) and (c) with laser energy focused at 2 and 3 number of pulse having a positive skewness as Rsk > 0.4. Its show that, when laser energy is focused at lower number of pulse than the surface Rsk < 0 while when the sample with the focused laser energy of number of pulse is increased than the surface Rsk > 0.4. Ra, Rq(RMS) and Rq(grain-wise) increase when the surface skewness, Rsk > 0.4 at the laser energy focused at 2 and 3 number of pulse but the surface kurtosis, Rku < 0 for the laser energy focused at 2 number of pulse while surface kurtosis, Rku > 0 for the laser energy focused at 3 number of pulses. While Ra, Rq(RMS) and Rq(grain-wise) at lower number of pulse of laser energy then the surface skewness, Rsk < 0 and the surface kurtosis, Rku < 0.
4.0 CONCLUSION
Including symbols and equations in the text, the variable name and style must be consistent with those in the equations. Equations should be indented at the middle and numbered at the right margin, equation number is enclosed with open and close parenthesis () Time New Roman in style and 11pt font size. Define all symbols the first time they are used. All equation symbols must be defined in a clear and understandable way.
use in microelectronic metallization,” Materials Chemistry and Physics, Vol41, pp 192-198 (1995.
[4] Thomas, T.R.(1999). Rough surface (2nd ed), Imperial College
Press,978-1-86094-100-9,London.
[5] R.R.L.De Oliveira, D.A.C. Albuquerque, T.G.S. Cruz, F.M.Yamaji and F.L.Leite,
Federal University of Sao Carlos, campus Sorobaca, Brazil (2015).
[6] Necas D. and Klapetek, P. 2012. Characterization of surface roughness, Masark
University,Brno, Czech Republic
[7] Singh A.K.,Mehra S., & Thool G.S (2014. Structural and Optical Properties of
nanocristalline CUxS solid Thin Films, Austin Chemical Engineering, Austin Publishing Group (May 2014).)
[8] Rajesh Kumar B, SubbaRao T. Atomic Force Microscopy Studies on DC Reactive
Magnetron Sputtered Zinc Aluminum Oxide Thin Films. Digest Journal of Nanomaterials and
Biostructures. 2012; 7: 1881-1889.
[9] Barabasi, A. L.& Stanley, H.E. (1995). Fractral Concept in Surface Growth, Cambridgr
University Press, 0-521-48318-2, Cambridge.
[10] Binning, G., Quate, C. F., & Gerber, C.(1986). Atomic Force Microscope. Physical
Review letter, Vol 56, No 9, (mar.1986)pp.930-933,0031-9007
[11] Gadelmawla, E.S., Koura, M.M., Maksoud, T.M.A., Elewa, I.M., Solimon, H.H. (2002).
Roughness Parameters, Journal of Material Processing Technology, Vol.123, No 1, (apr.2002), pp.133-145,0924-0135.
[12] Jurekha, S., Kobayashi, H., Takahashi, M., Matsumoto, T., Jureckova, M., Chovanec, F.,