ABSTRACT
ESTEVEZ, RAFAEL CHRISTOPHER. A Cost and Benefit Analysis of the North Carolina Southern Pine Beetle Prevention Program. (Under the direction of Dennis Hazel and Robert Bardon.)
The North Carolina Southern Pine Beetle Prevention Program (NCSPBPP) was
authorized and funded under the USDA Forest Service Forest Health Protection program in
2005. The objective of the NCSPBPP is to encourage eligible forest landowners in North
Carolina to improve forest health and reduce the threat and severity of southern pine beetle
(SPB) attack through technical assistance and cost-sharing of precommercial thinning (PCT)
of young pine stands (North Carolina Division of Forest Resources [NCDFR], 2006). A
process evaluation and a cost and benefit analysis (CBA) of the NCSPBPP were undertaken
to provide a program overview, quantify program benefits and associated costs, and construct
a set of recommendations for program improvement.
A process evaluation of the NCSPBPP was conducted for the 2006–2007 North
Carolina fiscal year. The evaluation focused on program implementation, stand
characteristics reporting, and the landowner application process. Site visits, informal
interviews, field data sheet reporting (FDSR) of stand characteristics, and application
processing time (APT) were used for the process evaluation. The CBA pertained only to the
cost-sharing and personnel portion of the NCSPBPP during the same time period. A sample
of 180 treated stands of loblolly pine was utilized to quantify benefits from PCT. An
incremental analysis of with and without PCT was commenced to estimate the program’s net
benefit to society. PCT incremental gain, program net benefit, and benefit-cost ratio for the
entire program were calculated using a growth and yield model, PLANTYLD, SPB
infestation probabilities (Daniels et al., 1979), SPB spot severity modeling (Reed et al.,
1981), SPB expected timber volume loss equations (Burkhart et al., 1986), Timber
Mart-South 2006 prices, and real discount rates of 4 and 10 percent. The process evaluation
identified high turnover rate of SPB Foresters, SPB Foresters’ being utilized outside the
These challenges can result in poor resource utilization and documentation that is insufficient
to quantify program impacts. The program net benefit was estimated to be $680,414.19 to
$818,019.97 with an associated program cost of $1,755,817.24. The benefit-cost ratio was
within the range of 1.42 to 1.55. These results indicated that society was better off due to the
NCSPBPP.
Recommendations for program administration include instituting incentives to retain
SPB Foresters, guaranteeing position funding, changing supervisory responsibility for the
SPB Foresters from the District Forester to the NCDFR Pest Control Department head,
encouraging collaboration with other NCDFR personnel and other forestry-related agencies,
and mandating a complete field data sheet (FDS) with all management and consultant plans
prior to landowner-funding approval. The program’s net benefit would be increased by
eliminating SPB Forester positions in Region III, removing eastern white pine as an eligible
species due to the low probability of SPB attack, and targeting landowners with pine stands
that are more than 6 years old, have greater than 1,500 TPA, and are on highly productive
soils. Research efforts also yielded an unplanned positive impact by identifying program
challenges during the process evaluation, which gave program managers the opportunity to
A Cost and Benefit Analysis of the North Carolina Southern Pine Beetle Prevention Program
by
Rafael Christopher Estevez
A thesis submitted to the Graduate Faculty of North Carolina State University
in partial fulfillment of the requirements for the Degree of
Master of Science
Forestry
Raleigh, North Carolina
2011
APPROVED BY:
____________________ ____________________
Dr. Erin O. Sills Dr. Arnold Oltmans
Committee Member Committee Member
____________________ ____________________
Dr. Dennis Hazel Dr. Robert Bardon
BIOGRAPHY
Rafael Christopher Estevez was born on October 27, 1982 in Miami, FL to Rafael
Angel Estevez and Guadelupe Estevez. He spent most of his early childhood in Davie, FL.
Here, Rafael exhibited his strong entrepreneurial spirit and love for plants at an early age by
establishing a small nursery with his older brother, propagating various tropical and
medicinal plants. Later, Rafael attended Leesville Road Middle and High School. He joined
the cross-country team, was chess club champion, and was an active participant in computer
club, quiz bowl, and DECA. Rafael attended various state and local competitions for
geography and marketing.
After high school, Rafael enrolled at North Carolina State University in the Fall of
2001 in the Forest Management program. Rafael earned a B.S. in Forest Management and
graduated Summa Cum Laude and Valedictorian of the Class of 2005. Throughout his
undergraduate career, Rafael earned several scholarships and awards for his academic
achievement, including the Crescent Resources/Duke Power Scholarship, the Edwin F. Conger
Academic Scholarship, the Multicultural Student Affairs Academic Award, and various
undergraduate research grants. Rafael conducted undergraduate research under the supervision
of Dr. Erin Sills for the Sustainable Woodlands Project and for the Eastern NC Christmas Tree
Growers Association for three years during his undergraduate studies. He gathered information
regarding consumer behavior, existing suppliers, market structure, and willingness to pay on
various non-timber forest products (NTFPs), including pine straw, longleaf pine needle baskets,
medicinal plants, Christmas greenery, wetland, and native plant propagation. Rafael worked for
the ENCCTGA on topics such as consumer demographics and behavior, Eastern NC Christmas
tree production statistics, a cost analysis for Eastern NC Christmas tree production, and
quantifying the potential of Christmas greenery in the NC Hispanic market. He presented his
findings at the NCSU Undergraduate Research Symposium, submitted several articles to the
Eastern NC Christmas Tree Growers Association’s newsletter, and published landowner
of the International Society of Tropical Foresters (ISTF) and the NCSU Forestry Club, in which
he was elected Treasurer.
These experiences led Rafael to pursue a Master of Science in Forest Management with
a minor in Economics at North Carolina State University. During his graduate studies, Rafael
accepted an internship with the City of Raleigh in North Carolina. Early in the internship, Rafael
worked with the Planting Coordinator to administer the NeighborWoods program, which
received the City’s Environmental Award and the Sir Walter Raleigh Award in 2009. Rafael
became later involved in revising the city’s Urban Forestry Policy and Standards Manual and
conducted research to construct recommendations to improve Raleigh’s City Tree Ordinance.
He also completed cost and benefit, payback, and lifecycle analyses for sustainability project
proposals and was part of a team that was instrumental in the Raleigh Parks and Recreation
Department being awarded over $500,000 in sustainability grants. Rafael plans to pursue a
Master’s in Business Administration and is working towards a career in renewable energy and
sustainability. Currently, Rafael holds the Eastern Region Forester position with Progress
ACKNOWLEDGEMENTS
I would like to express a deep appreciation to the North Carolina Division of Forest
Resources (NCDFR) and their staff for providing technical support, valuable insight, and
financial backing, which has made this research possible. I would like to further recognize
several NCDFR personnel, including Don Rogers, Rob Trickel, and each of the 13 SPB
Foresters, who were essential by contributing their time, talents, and resources towards this
project. I am indebted to my graduate committee members—Dennis Hazel, Erin Sills, Robert
Bardon, and Arnie Oltmans—for providing guidance, feedback, personal support, and
direction during my graduate studies. I would also like to give a special thanks to James
McCarter, an adjunct associate professor at North Carolina State University, for helping me
with the VBA programming and troubleshooting to generate the cost and benefit results data.
Furthermore, I would like to thank my family and friends for their continued loving
support and understanding. To my wonderful wife, who has given me the motivation,
emotional conditioning, and physical support throughout my academic journey. Lastly, I
would like to acknowledge God for giving me the strength and wisdom to complete my
TABLE OF CONTENTS
LIST OF TABLES ... vii
LIST OF FIGURES ... ix
INTRODUCTION ...1
NCSPBPP Process Evaluation ...4
Program Cost and Benefit Analysis ...5
Southern Pine Beetle History and Management Overview ...6
ESSAY ONE: NORTH CAROLINA SOUTHERN PINE BEETLE PREVENTION PROGRAM PROCESS EVALUATION ...9
Southern Pine Beetle Prevention Program Background ...9
Program Structure ...11
Program Promotion and Education ...12
Landowner Program Guidelines and Requirements ...12
Landowner Application Process ...13
Program Process Evaluation ...14
Field Data Sheet Recording (FDS Reporting) ...15
Application Processing Time (APT) ...16
Program Process Evaluation Results ...16
Landowner Participation and Program Interest ...16
Landowner Motivation...17
Program Implementation and the SPB Forester...17
Tree Contractors...18
Field Data Sheet Reporting Results ...19
Application Processing Time Results ...21
Program Process Evaluation Discussion ...21
NCSPBPP Program Challenges ...21
Program Process Evaluation Recommendations ...23
Program Process Evaluation Conclusion ...25
ESSAY TWO: NORTH CAROLINA SOUTHERN PINE BEETLE PREVENTION PROGRAM COST AND BENEFIT ANALYSIS ...26
Cost and Benefit Analysis General Application and Theory ...26
North Carolina Southern Pine Beetle Prevention Program...29
Program Structure and Eligibility ...29
NCSPBPP CBA Framework ...30
Landowner Study Sample Demographics ...31
CBA Standing Benefits ...31
CBA Standing Costs ...33
Program Net Benefit to Society ...33
Cost and Benefit Analysis Methodology ...34
Program Benefit Analysis ...34
Growth and Yield Model Comparison Methodology ...35
Growth and Yield Model Comparison Results ...37
Growth and Yield Model Effects on SPB Risk Analysis ...47
Growth and Yield Model Final Selection ...48
PLANTYLD Growth and Yield Model Methodology...48
SPB Risk and Expected Timber Volume Loss Analysis ...50
Annual SPB Infestation Probabilities ...51
SPB Severity Spot Model ...52
SPB Expected Timber Volume Loss ...53
Projected Prices and Present Values ...54
Program Cost Analysis ...55
Program Enrollment vs. Program Completion Costs ...55
Program Net Benefit Analysis ...59
CBA Sensitivity Analysis ...59
Cost and Benefit Analysis Results ...59
Study Sample Statistics ...59
Total Program Expenditures and PCT Costs ...60
SPB Infestation Probability Curves ...61
Program Net Benefits ...62
Benefit-Cost Ratios (B/C Ratios)...63
PCT Incremental Gain “Timber Benefit” Results for Age, TPA, and SI Categories ...64
Sensitivity Analysis Results ...66
Cost and Benefit Analysis Discussion ...68
Cost and Benefit Analysis Conclusion ...71
REFERENCES ...72
APPENDICES ...78
Appendix A: Growth and Yield Model Comparison Raw Data ...79
Appendix B: Growth and Yield Model Comparison Graphs of Raw Data for Output Variables Average Height, TPA, Basal Area, DBH, and Volume ...86
LIST OF TABLES
ESSAY ONE: NORTH CAROLINA SOUTHERN PINE BEETLE PREVENTION PROCESS EVALUATION
Table 1: NCSPBPP pre-stand and post-stand characteristics eligibility requirements stated in the program handbook of 2006. ...13 Table 2: Percentage of treated stands in a landowner management plan, with or
without a field data sheet, that included reporting data for each stand characteristic category. ...19
ESSAY TWO: NORTH CAROLINA SOUTHERN PINE BEETLE PREVENTION PROGRAM COST AND BENEFIT ANALYSIS
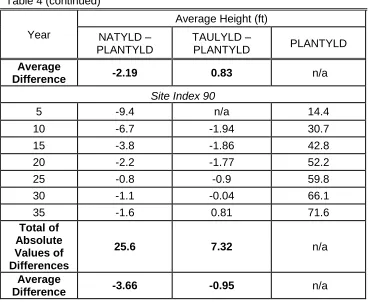
Table 3: Site indices base age 50 years converted to base age 25 years, which were inputted in the TAULYLD growth and yield model. ...36 Table 4: Average height per acre comparisons for SI 60, 70, 80, and 90 base age 50 years measured in feet. ...38 Table 5: TPA comparisons for SI 60. 70, 80, and 90 base age 50 years measured in trees per acre. ...40 Table 6: Basal area per acre comparisons for SI 60, 70, 80, and 90 base age 50 years measured in square feet per acre. ...42 Table 7: DBH per acre comparisons for SI 60, 70, 80, and 90 base age 50 years
measured in inches per acre. ...44 Table 8: Volume per acre comparisons for SI 60, 70, 80, and 90 base age 50 years measured in cubic feet per acre. ...46 Table 9: Undisturbed and disturbed stand regression coefficients obtained by Daniel et al (1979). ...52 Table 10: 2006 Timber Mart-South average prices for Western and Eastern North Carolina. ...54 Table 11: Program enrollment and completion costs for each group of landowners accounted in budget expenditures between July 1, 2006 and June 30, 2007. ...56 Table 12: Stand establishment amount of acres and percentage of the total by
Table 17: Average timber benefit present values for all SPB infestation levels by SI with base age 50 years discounted by 4% and 10% real discount rates. ...65 Table 18: Average timber benefit present values for all SPB infestation levels by TPA discounted by 4% and 10% real discount rates.. ...65 Table 19: Linear regression output of multiple r, r2, adjusted r2, standard error, and the number of observations generated by Microsoft Excel Regression Analysis Tool based on a four percent real discount rate, a dependent variable of PCT incremental gain and independent variables of age, site index, trees per acre, and enrollment period. ...66 Table 20: Linear regression output of degrees of freedom, sum of squares, mean squares, and f-test generated by Microsoft Excel Regression Analysis Tool based on a four percent real discount rate, a dependent variable of PCT incremental gain and independent variables of age, site index, trees per acre, and enrollment period. ...66 Table 21: Linear regression output of regression coefficients, standard error, t-values and p-values generated by Microsoft Excel Regression Analysis Tool based on a four percent real discount rate, a dependent variable of PCT incremental gain and
independent variables of age, site index, trees per acre, and enrollment period. ...67 Table 22: Linear regression output of 95% confident interval values for the line intercept, age, site index, trees per acre, and landowner type generated by Microsoft Excel Regression Analysis Tool based on a four percent real discount rate, a
dependent variable of PCT incremental gain and independent variables of age, site index, trees per acre, and enrollment period. ...67 Table 23: Linear regression output of multiple r, r2, adjusted r2, standard error, and the number of observations generated by Microsoft Excel Regression Analysis Tool based on a ten percent real discount rate, a dependent variable of PCT incremental gain and independent variables of age, site index, trees per acre, and enrollment period. ...67 Table 24: Linear regression output of degrees of freedom, sum of squares, mean squares, and f-test generated by Microsoft Excel Regression Analysis Tool based on a ten percent real discount rate, a dependent variable of PCT incremental gain and independent variables of age, site index, trees per acre and enrollment period. ...68 Table 25: Linear regression output of regression coefficients, standard error, t-values and p-values generated by Microsoft Excel Regression Analysis Tool based on a ten percent real discount rate, a dependent variable of PCT incremental gain and
independent variables of age, site index, trees per acre, and enrollment period. ...68 Table 26: Linear regression output of 95% confident interval values for the line intercept, age, site index, trees per acre, and landowner type generated by Microsoft Excel Regression Analysis Tool based on a four percent real discount rate, a
LIST OF FIGURES
INTRODUCTION
Figure 1: A map of the southern pine beetle natural range. ...1 Figure 2: Outbreak frequency of the southern pine beetle from 1960 to 2004 across the Southeast. ...2 Figure 3: Timber loss trends and frequencies of counties in the Southeast impacted by southern pine beetle outbreak from 1960 to 2004. ...2
ESSAY ONE: NORTH CAROLINA SOUTHERN PINE BEETLE PREVENTION PROCESS EVALUATION
Figure 4: A map of North Carolina Forest Service regions and districts. ...11 Figure 5: Percentage of treated stands in a landowner management plan with a field data sheet for which the given stand characteristics data were provided. ...20 Figure 6: Percentages of treated stands in a landowner management plan without a field data sheet for which the given stand characteristics data were provided. ...21
ESSAY TWO: NORTH CAROLINA SOUTHERN PINE BEETLE PREVENTION PROGRAM COST AND BENEFIT ANALYSIS
INTRODUCTION
Widespread southern pine beetle (SPB) outbreaks caused unprecedented damage in
the Southeast from 1999 to 2003 (Coulson & Stephen, 2006; Nowak, 2004), which resulted
in an estimated economic loss of $1 billion dollars (Nowak et al., 2008) and affected almost 1
million acres of forestland (Nowak, 2004). This pest is considered the most serious threat to
pine forest health in the Southeastern region of the United States (Thatcher & Barry, 1982).
The SPB, Dendroctonus frontalis Zimmermann, is endemic to the Southeast (Figure 1). SPB
outbreaks are cyclical, sporadic, and potentially highly devastating (Meeker, Dixon, & Foltz,
1995) (Figure 2 and 3). This pest plays a quintessential role in changing the landscape and
creating economic hardship for many forest landowners. The SPB has also threatened the
survival of the red-cockaded woodpecker (Picoides borealis [Vieillot]), an endangered
species, by destroying forests that serve as vital habitat (Nowak et al., 2008).
Figure 2: Outbreak frequency of the southern pine beetle from 1960 to 2004 across the Southeast.
Figure 3: Timber loss trends and frequencies of counties in the Southeast impacted by southern pine beetle outbreak from 1960 to 2004.
In the past, common SPB suppression methods included cut and leave, cut and
hand-spray, cut and remove, and pile and burn. These efforts have been very effective in
1986; Redmond & Nettleton, 1990). Generally, SPB infestations are candidates for
suppression methods when more host species is available, more than 10 trees currently
infested, freshly attacked trees are present, and the infestation is expanding (Hedden &
Billings, 1979; Billings, 1980). SPB suppression programs are effective in reducing resource
losses but will not prevent the onset of an SPB outbreak (Clarke & Billings, 2003).
Widespread SPB devastation and a renewed interest in a more proactive management
approach to promoting healthier forests prompted the funding and creation of the SPB
Prevention and Restoration Program administered by the U.S. Forest Service (Nowak et al.,
2008).
The U.S. Forest Service Forest Health Protection (FHP) and the Southern Research
Station (SRS) have been funded by the SPB Initiative (SPBI) to spearhead SPB preventive
efforts in all of the 13 Southeastern states and 12 national forests. FHP allocated $48 million
dollars to state forestry agencies during the federal fiscal years of 2003–2008 to help
implement the SPB Prevention and Restoration program (Nowak et al., 2008). Program
frameworks vary because states were given flexibility in allocating funds. These funds are
being used to educate landowners about the impacts of SPB infestations, develop SPB hazard
rating and mapping systems, and help manage non-industrial private forests and state-owned
land (Nowak et al., 2008).
The North Carolina Southern Pine Beetle Prevention Program (NCSPBPP) is
administered by the North Carolina Division of Forest Resources (NCDFR). The program’s
objective is to encourage eligible nonindustrial landowners in North Carolina to improve
forest health and reduce the threat and severity of SPB attacks through technical assistance
and cost-sharing of recommended prevention practices (NCDFR, 2006). The NCSPBPP
budget consists of several components including program marketing, forest health education,
personnel, and cost-share funding for approved forest prescriptions. This paper’s primary
foci were on providing an overview and process evaluation of the NCSPBPP and quantifying
the benefits and costs associated with the cost-share and personnel portions of the program
landowners who completed the program and on program implementation for the 2006–2007
state fiscal year are documented in this paper.
NCSPBPP Process Evaluation
A process evaluation of the NCSPBPP provided valuable insight and an insider
perspective of the interworking of the program’s administration and implementation. This
evaluation was prompted by the difficulty of collecting treated stand characteristics data for
the CBA. Because poor stand characteristics documentation hindered the quantifying of
program benefits, a process evaluation was initiated to better understand the reasons for this
shortfall. The process evaluation included participant observation and informal interviews
with eight of the SPB Foresters during site visits to several NCDFR districts. An overview of
the program’s administration and implementation was constructed to place the CBA into
context and explain how costs and benefits were derived. Stand characteristics data were
compiled, and processing times for landowner reimbursement and program completion were
quantified as part of the process evaluation.
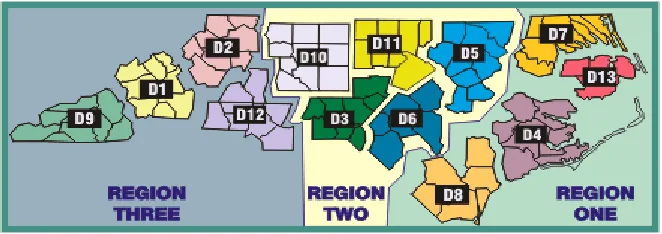
Site visits were conducted in eight of the 13 NCDFR districts to document program
processes and identify observed program challenges. Districts 2, 4, 5, 6, 7, 9, 10, and 11 were
visited based on the availability of the SPB Forester to be interviewed, while the other five
NCDFR districts were not visited because of scheduling conflicts and time constraints.
Topics discussed during the informal interview included landowner response and acceptance
of the program, landowner demographics in their particular NCDFR district, landowner
motivation to participate in the program, the relationship between landowners and the
NCDFR, program shortfalls, areas for program improvement, the administrative processes in
handling landowner applications, the dependency of other types of NCDFR officials to help
administer the program, perceived benefits to landowners participating in the program, and
tree contractor activity. Responses were recorded, compiled, and summarized in this paper.
The second half of the process evaluation was primarily focused on landowner
data-gathering efforts and the landowner application process. Field data sheet reporting (FDSR)
completeness of landowner data collection and the duration needed to process a landowner’s
SPB application—from when PCT was completed to when the landowner was reimbursed.
For each SPB landowner application, a management plan was required prior to full approval
by the NCDFR. A management plan can include a field data sheet (FDS), which may
expedite data collection by listing the mandatory data collection fields. However, many
landowner management plans prepared by forestry consultants omitted an FDS. An analysis
was conducted to determine how the completeness and consistency of stand characteristics
data obtained from management plans was affected by the presence or absence of an FDS.
Diameter at breast height (dbh), average tree height, soil classification, slope, and landform
were examined. The core analysis was focused on a subsample of 192 treated stands
completed during the study period and excluded landowners without an acquired
management plan. APT was created to gauge personnel efficiency in processing landowner
paperwork needed to close a project after the stand has been treated. APT was recorded for
121 landowners for which data were obtained, and the results are summarized in this paper.
Program Cost and Benefit Analysis
Commonly neglected during the program’s lifecycle are regularly conducted program
evaluations. The program evaluation process is sometimes disregarded due to lack of
available resources, inadequate technical expertise, or weak accountability standards.
Although often viewed as a low priority, program evaluation is vital in understanding
previous program frameworks, what contributed to their success or failure, benefits and costs
associated with a particular program, and program validation. The general intention of a
CBA is to help social decision making by facilitating better allocation of resources
(Boardman et al., 2006). An efficient incentive program must generate benefits to society
greater or at least equal to the costs (Kronrad & Morzuch, 1985). The development of a CBA
was undertaken to gain a greater understanding of derived benefits and program costs based
on a societal perspective, quantify a benefit-cost ratio for the program, and offer program
The CBA framework was designed to underestimate benefits and overestimate
program costs and was based on a similar study conducted by Burkhart et al. (1986)
regarding the effect of thinning on SPB expected timber volume loss. This type of framework
generates the presence of low SPB activity and does not take into account the economic
effects that are associated with SPB epidemics. SPB epidemics in the South are commonly
seen as large-scale catastrophes (Price et al., 1998). These catastrophes can affect timber
market prices and increase price risk. Prices drop precipitously in the short run because of a
glut of material available to timber buyers, lower quality of the salvage material, and the
added costs associated with salvage harvesting (Prestemon et al., 2001). After an SPB
outbreak in Louisiana and Texas during 1984–1985, prices were negatively affected for 15
months because of salvage logs (Holmes, 1991). SPB epidemics are also associated with
greater production risk by creating larger unforeseen volume and quality losses. This
framework would typically underestimate SPB losses, the bias is negligible for a situation
where salvage is infeasible and SPB infestations are small and scattered (Burkhart et al.,
1986).
Under the NCSPBPP, PCT is the primary forestry prescription approved. The CBA
focused on the treatment’s benefits of higher-valued timber products and reduction in SPB
expected timber volume loss. Other program benefits due to PCT, which may include
wildlife habitat improvement, enhanced aesthetics, reduced fire risk and fuel load, and a
decrease in timber price and production volatility due to less frequent SPB outbreaks, were
not included in the CBA due to lack of data and to resource constraints.
Southern Pine Beetle History and Management Overview
Research on the SPB has included lifecycle, population dynamics, tree species
susceptibility, hazard rating systems, and preventive forest management prescriptions. The
SPB is one of more than 12 American species of bark beetles found in North and Central
America and is considered a primary pest due to the susceptibility of numerous types of
coniferous species throughout its natural range (Thatcher et al., 1980). SPBs attack living
beneath the bark. Stressed, dying, and suppressed trees are normally targeted first, but during
periods of epidemics, healthy and vigorous trees can be overwhelmed and killed effortlessly.
Aggregated SPB populations in expanding infestations are known as spots (Clarke &
Billings, 2003). NCDFR personnel conduct aerial surveys with follow-up ground checks
across North Carolina and usually during late June to early July, fall, and winter after
hardwood leaf fall to record spot occurrence (Anderson & Doggett, 1980). During initial
ground checks conducted in North Carolina from 1973 to 1975, the average spot size was
found to be 1.356 acres (Doggett & Tweed, 1994). SPB epidemic intervals are regionally
dependent in North Carolina (Doggett & Tweed, 1994) and normally short-lived throughout
its natural range (Thatcher et al., 1980). Epidemics and spot spread are believed to be
correlated with favorable stand conditions such as high host density, poor vigor, stressed host
species (Lorio, 1968; Hicks, Coster, & Watterston, 1978), and lightning strikes.
Shortleaf pine, Pinus echinata, and loblolly pine, Pinus taeda, are considered to be
the most susceptible and preferred by SPB (Thatcher & Barry, 1982; Clarke & Nowak,
2009). In a study conducted during 1973 through 1975 in North Carolina, Pinus echinata was
the species most frequently killed based on total volume and quantity of available host
species. Loblolly pine, which is the most abundant pines species in North Carolina, was
ranked second in total volume killed (Anderson & Doggett, 1980). The SPB has also infested
other coniferous species, such as pitch pine (Pinus rigida), Eastern white pine (Pinus
strobus), longleaf pine (Pinus palustris), Virginia pine (Pinus virginiana), Slash pine (Pinus
elliotti), table mountain pine (Pinus pungens), and spruce pine (Pinus glabra) (Thatcher et
al., 1980). Pine forests totaling 8.4 million acres in the South are at risk of having 25% or
more of the standing live basal area (BA) greater than 1 inch in diameter killed by SPB
activity in the next 15 years (Krist, Sapio, & Tkacz, 2007).
Supported by the FHP and state funding, SPB stand hazard maps were developed and
released in 2008 for each of the 13 states in the Southern region. These maps are intended to
better prioritize and target areas for funding through the SPB Prevention and Restoration
recommendations. Based on a hazard rating system developed for East Texas, the following
prescription recommendations were constructed: stands that are rated moderate to high
hazard with an average height of greater than 60 feet should be considered for harvest and
replanted with a more SPB-resistant pine species such as slash pine; moderate to high hazard
stands with an average height of less than 60 feet should be thinned to 70–80 square feet of
basal area per acre; extreme hazard stands are recommended for harvest and conversion to
hardwood; and resistant pine species and stands with a low to moderate rating with an
average height of less than 60 feet generally would not require any treatment for SPB
protection (Hicks et al., 1978).
Preventing outbreak populations and creating forest conditions that adversely affect
SPB outbreaks once they occur is believed to be the most effective method of managing SPB
populations (Thatcher et al., 1980; Belanger, Hedden, & Lorio, 1993; Clarke, 2001). Stand
structure is thought be a major factor in estimating the probability of spot initiation and rate
of spread (Nowak et al., 2008). The predominant strategy of the SPB Prevention and
Restoration Program is to thin stands early. Thinning is a preferred method for altering the
stand structure and reducing SPB susceptibility because of lower intraspecific competition
(Nowak et al., 2008). Thinning can increase tree growth, shorten the length of the rotation,
increase forage for livestock or wildlife, and reduce the risk of timber losses due to fire,
insects, diseases, and weather (Mann & Lohrey, 1974). A PCT study conducted by Cain
(1993) concluded that crop trees grew substantially faster than did unthinned plots and that
PCT improved wildlife habitat. Precommercial thinning plots were also better suited for early
sawtimber production, and commercial loggers preferred to perform intermediate thinnings
in these plots. Precommercial thinning can also be profitable without SPB being a factor.
Precommercial thinning was found to be justified if the stand stocking was greater than 5,500
to 6,500 trees per acre and if was followed by an aggressive commercial thinning program
ESSAY ONE: NORTH CAROLINA SOUTHERN PINE BEETLE PREVENTION PROGRAM PROCESS EVALUATION
A process evaluation of the North Carolina Southern Pine Beetle Prevention Program
(NCSPBPP) was undertaken to place the cost and benefit analysis (CBA) into context and to
identify challenges that were encountered when gathering program information for the CBA.
Constructing an overview of the program provides background information on how costs and
benefits are derived and offers a detailed account of program administration and
implementation, which can be used to improve similar program frameworks and future
program replication.
Poor documentation of stand characteristics of treated stands hindered conducting the
CBA. Consistent and complete stand characteristic data collection from each treated stand is
vital in quantifying program impacts, such as SPB expected timber volume losses and
changes in timber product classes. Incomplete data documentation does not affect the overall
social and economic impact of the program, but this impediment can hinder research efforts
in program justification, quantifying economic efficiency and effect, and identifying program
aspects that can be improved upon. The CBA framework was tailored to what stand
characteristics could be collected consistently from treated stands and was constrained by
feasible methods that could be utilized.
Stand-characteristics requirements when met were approved by a North Carolina
Division of Forest Resources (NCDFR) official that inspected the stand before funding
approval. Specific stand characteristics documentation was not an explicit program
requirement. A process evaluation was initiated to document the program processes and
assess the reasons for the lack of complete and consistent stand characteristics
documentation.
Southern Pine Beetle Prevention Program Background
The NCSPBPP, administered by NCDFR, started to enroll landowners in 2005 and
was funded by federal grants from the Southern Pine Beetle Prevention and Restoration
replanting lower density stands, and planting less susceptible pine species (such as longleaf
pine) are the primary preventive methods being used by state-administered programs. The
number and type of approved methods varies by state. For example, the Florida SPB
Prevention Program (FSPBPP) has approved first pulpwood thinning, PCT, and prescribed
burning for cost-share funding, whereas the NCSPBPP has approved only PCT for cost-share
funding.
Treatment area prioritization and personnel needs also differ among state programs.
The Texas Forest Service has placed a special emphasis on targeting counties that are
considered having a high to moderate SPB hazard rating. Florida, North Carolina, and Texas
also use SPB hazard maps to preferentially treat stands, whereas other states may treat stands
based on need and SPB outbreak history (Nowak et al., 2008). Typically, SPB prevention
programs fund a coordinator position, and sometimes an assistant coordinator position, to
administer the program and rely heavily on other forest service staff to help with program
implementation. In contrast, the NCSPBPP hired 13 forester positions and an SPB
coordinator.
Availability of cost-share funds and rates vary among states. The FSPBPP limits
funding to 44 northern counties where SPB is found historically, yet the NCSPBPP has made
cost-shares dollars available to each of the 100 counties in the state, regardless of SPB
activity and perceived SPB risk. The cost-share rates for approved practices can also differ.
The Texas SPB Prevention Program pays up to $10,000 annually per landowner, with a 50%
cost-share rate. In contrast, the FSPBPP pays a flat rate of $50 per acre for first pulpwood
thinning, up to $50 per acre for PCT, and $8 per acre for prescribed burning. The SPB
initiative has brought about the hazard reduction and the thinning of over 500,000 acres,
educated several thousand landowners about SPB-related issues, and expanded our
knowledge base of SPB through funded research projects (Nowak et al., 2008).
Program Structure
The NCSPBPP is divided into three major components: personnel, cost-share, and
education. The personnel and cost-share portions are the primary foci of this paper. These
components were allocated approximately one million dollars for personnel costs and one
million dollars for cost-share spending out of the three million dollars for the NCSPBPP
given to the state during the state fiscal year of 2006–2007.
The NCDFR Pest Control Department head was responsible for overseeing and
executing the new prevention program. NCDFR created 13 new SPB Forester positions, one
for each NCDFR district (Figure 4), and an SPB program coordinator position located in the
Central Office in Raleigh, NC to manage outreach efforts to minority and limited resource
landowners.
Figure 4: A map of North Carolina Division of Forest Resources regions and districts.
The primary duties of the SPB Forester include educating landowners about the new
program, encouraging landowner participation, processing SPB landowner applications,
inspecting potential stands to gather stand characteristics, overseeing tree contractors,
surveying and mapping treated stands, and promoting overall forest health. Training
requirements for an SPB Forester, which is a two-year period, were similar to those of a
District Forester for daily tasks. The SPB coordinator’s primary functions were to encourage
minority landowners and limited-resource landowners to participate in the NCSPBPP,
through networking and attending community events. These positions were based on soft
monies and could be eliminated if funding was discontinued.
Program Promotion and Education
A consultant firm was contracted to launch a marketing campaign to promote forest
health and landowner participation. Various methods were tested, such as publishing
newspaper articles about the program and purchasing radio, newspaper, and television
advertisements. About $800,000 was spent on these efforts, and each SPB forester was also
encouraged to find innovative methods to reach at-risk landowners. Methods utilized include
aerial photos, compiling landowner lists from other federally or state funded forestry
programs, windshield inspections between appointments, coordinating with other NCDFR
county personnel, demonstration plots, and contacting the local media to generate publicity.
SPB educational efforts were integrated in both the marketing and personnel portions
of the program. Marketing efforts were intended to generate interest about SPB and the
NCSPBPP, but they also provided general information regarding this well-studied insect. The
SPB foresters and the SPB coordinator routinely educated landowners about the importance
of the SPB and why it is essential to manage their forests to promote good forest health as
part of the NC SPB educational initiatives while implementing the program.
Landowner Program Guidelines and Requirements
Commonly, PCT is completed mechanically or by manual-labor crews. Eligibility
requirements included being a nonindustrial private landowner located in North Carolina and
owning at least five acres of forestland in North Carolina, a written management plan, other
cost-share funds cannot be spent on the same acre for forestry practices, and a candidate
stand must meet certain stand characteristics criteria (Table 1), which was verified by a
Table 1: NCSPBPP pre-stand characteristics and post-stand characteristics eligibility
requirements stated in the program handbook of 2006.
Type of
Tree
Practice Max. Age
Crop Trees Pre-Treatment Condition Post-Treatment Condition Southern Yellow Pine Precommercial Thinning
12 years 700+ pine stems
/ acre
300–450 stems / acre,
depending upon age;
450 at age 3-9, down
to 300 at age 10+
White
Pine
Precommercial
Thinning
30 years 700+ pine stems
/ acre or 150+
square feet of
basal area
300–450 stems / acre
or 90 square feet of
basal area or less
The cost-share reimbursement rate was 70/30, in which the landowner pays 30% of
the costs and the NCDFR pays the remaining 70%. Landowners can be reimbursed up to
$8,000 per year per ownership. Prior to the 70/30 cost-share rate, the rate for landowners was
50/50 and up to $5,000 at the end of the 2005 state fiscal year. The cost-share rate was
adjusted upward as of July 1, 2006 to encourage landowner participation. Each approved
prescription was completed within one calendar year if an extension was not approved by the
NCDFR. Participating landowners were obligated to maintain treated stands for 10 years,
based on the stipulations outlined in the previously approved management plan. If a
landowner failed to do so, he or she may be required to return received cost-share dollars to
the State of North Carolina and other financial penalties may apply.
Landowner Application Process
Participating landowners begin the enrollment process by having an NCDFR official
assess a potential candidate stand. This official, which usually was an SPB Forester, a
establishing several plots to identify species, age, diameter at breast height (DBH), average
tree height, TPA, basal area per acre, site index (SI), volume range, stand quality, understory
species, if desirable reproduction was present, landform, and a site description for slope,
soils, aspect, and drainage. These data were later recorded in the management plan and
usually were compiled on the field data sheet (FDS) if included.
A management plan is required with each landowner application. A landowner may
ask an NCDFR official or a forestry consultant to prepare and submit a management plan on
his or her behalf. The enrolling landowner must also fill out a basic application that requires
personal and property information, such as name, address, social security number, PCT rate,
and the number of acres to be treated. This application and management plan were then
submitted jointly to the Central Office for NCDFR funding approval.
After administrative approval, the landowner must complete the PCT within a year, in
the absence of an extension. A PCT contractor was hired at a set rate, which was preapproved
by the NCDFR. The agency set rates for PCT as low ($80/acre), medium ($120/acre), and
high ($200/acre). A list of PCT contractors was usually kept at the district office and
furnished to inquiring landowners upon request.
During treatment, a NCDFR official can make site visits to monitor the work in
progress. When the PCT was completed, a NCDFR representative, usually a SPB Forester,
accurately measured the treated area for billing and inspected the completed work to ensure
that post-treatment stand characteristics criteria are satisfied. However, no post-treatment
stand characteristics are officially recorded. Written documentation, which may include a
map of the treated area and proof of payment to the tree contractor, was then submitted to the
NCDFR Central Office for landowner reimbursement. Once the landowner was reimbursed,
the application was considered complete.
Program Process Evaluation
The process evaluation was conducted through participant observations, informal
interviews, quantifying the effectiveness of data collection methods, and measuring
were reimbursed with cost-share funds during the study period. In the evaluation, 8 of the 13
NCDFR districts were visited, with the other 5 districts not being visited due to scheduling
conflicts and time constraints. Landowner management plans were compiled to analyze
program documentation efforts. The administrative staff within the NCDFR provided
landowner processing-time information for analysis. Each SPB Forester was informally
interviewed. Questions asked during the interview pertained to landowner demographics,
program decision-making, program acceptance in their particular district, identifying
qualifying landowners, administrative processes, treatment costs and tree contractor
behavior, the relationship between NCDFR and landowners, realized program benefits and
associated costs, areas for program improvement, and program limitations.
A metric created to estimate stand-characteristics data-collection completeness and
consistency was field data sheet reporting (FDSR), which is described in more detail in the
following section. Application processing time (APT) was used to quantify the time needed
to complete an SPB landowner application after PCT was completed in the field. Findings
from the program process evaluation were used to construct comprehensive
recommendations, with the intention of assisting the NCDFR by identifying areas for
improvement in program implementation, funding utilization, and data collection efforts.
Field Data Sheet Recording (FDS Reporting)
Stand characteristics and program documentation were recorded primarily in the
landowner management plan. An FDS was usually included in a management plan prepared
by an NCDFR official, unlike plans prepared by forestry consultants on behalf of the
participating landowner. This type of sheet was intended only as a guide in which stand
characteristics were recorded before PCT and is not a requirement for cost-share funding
approval. Landowner management plans that included an FDS were compared with
management plans that did not use an FDS, to analyze stand-characteristics data-recording
consistency and completeness. Each stand was counted individually even if a landowner
Stand characteristics examined were average diameter at breast height, average tree
height, soil classification, slope, and landform. These stand characteristics are commonly
used in SPB risk models to determine SPB expected timber volume loss and SPB hazard
ratings. Each stand characteristic category was given a score of 1 if specific data were
recorded for it; otherwise, 0. The core analysis was focused on a subsample of 192 treated
stands that completed the program during the state fiscal year of 2006–2007. Of those stands,
136 included an FDS and 56 did not.
Application Processing Time (APT)
Dates used for APT were provided by administrative staff within the NCDFR. This
benchmark was created to gauge personnel efficiency in processing landowner paperwork
needed to close a project after the necessary documents are submitted to show that treatment
has been completed. The 15th was the set day used if the day was not listed, but the month
and year were provided. No studies were found in the literature of similar programs using
this metric for a comparison. One hundred twenty-one landowners were sampled for APT.
Program Process Evaluation Results
Landowner Participation and Program Interest
Based on participant observations during site visits and on informal interviews with
the SPB Foresters, landowner participation and program interest seem to be higher in
NCDFR districts having landowners with a strong relationship with the NCDFR, good timber
markets, productive timberland, rural areas, and abundant loblolly pine. NCDFR Districts 3
and 5 had the greatest number of participating landowners during the study period. These
districts have few urban centers and plentiful loblolly pine. Also, timber pricing in the eastern
part of the state where these districts are located was higher than in the western part of the
state, based on Timber South 2006 annual average stumpage prices (Timber
Mart-South, 2006). Program participation in some districts was limited by landscapes’ being
highly fragmented due to urban development and large tracts of industrial lands, which are
ineligible. Landowners in districts with significant urban development, such as NCDFR
appreciating real estate prices within the 10-year period required by the program for the land
to remain in trees and because of smaller tract sizes, as reported by the SPB Foresters during
informal interviews. The SPB Forester in District 10 reported difficulty encouraging loggers
and tree contractors to conduct forestry prescriptions on small tracts. To entice tree
contractors and loggers by larger economies of scale, the District 10 SPB Forester organized
these landowners to conduct forestry prescriptions at the same time. Landowners with less
than 30 acres of timberland were less likely to be receptive to managing for mitigating SPB
risk (Molnar, Schelhas, & Carrie, 2007), which is consistent with larger forest landowners’
tending to be more likely to implement forest management practices (Mayfield, Nowak, &
Moses, 2006). Observations indicated that the cost-share rate’s being increased from 50/50
and a ceiling of $5,000 annually to 70/30 and a ceiling of $8,000 annually seemed to have
generated greater program interest and given NCDFR personnel greater confidence to
encourage landowners to enroll in the program.
Landowner Motivation
During site visit interviews, SPB Foresters were asked what motivated landowners to
enroll in the program. Answers varied between districts, but timber production, wildlife
management, and aesthetics were cited several times. Aesthetics seem to have had a greater
weight in landowner decision making in urban districts, due to the impracticality of timber
production on smaller tracts. Also, landowners seem to have little to moderate concern with
SPB risk in general. The literature corroborated with the foresters’ answers. In the South,
many landowners have little interest in mitigating SPB impacts and are unaware of SPB
being a source of timber losses (Molnar, Schelhas, & Holeski, 2003; Mayfield et al., 2006).
The majority of landowners with less than 15 acres are slightly aware to unaware of SPB as a
source of timber losses and have slight to no interest in mitigating SPB impacts (Molnar et
al., 2003).
Program Implementation and the SPB Forester
The SPB Forester position was observed to be experiencing high turnover, although
uncertainty and the availability of other permanent job opportunities within the organization,
such as a Service Forester position. This high turnover created significant program delays
due to the agency’s having to find qualified replacements and then train them. SPB Foresters
were also found to be utilized differently in each NCDFR district. Commonly, the SPB
Forester was acting as a Service Forester in an assigned county in addition to duties
pertaining to the NCSPBPP. Service Forester is a permanent state position that typically
addresses general concerns of forest landowners in a district and not just issues relating to
SPB and forest health.
SPB Foresters were also found to be involved at various stages of the landowner
application process and collaborated with other NCDFR personnel regularly. Other NCDFR
personnel were essential in promoting the program, encouraging landowners to participate,
and completing the landowner application process.
Forestry consultants played a critical role in landowner enrollment. In some districts,
such as district 3, over one third of landowner applications sampled were submitted by a
forestry consultant on behalf of the landowner. Forestry consultants work in the best interest
of the landowner by utilizing their professional expertise to increase financial returns and to
promote better forest management. This group of professionals is incentivized to seek out
government subsidies to boost their clients’ financial returns and lower treatment costs paid
by their clients.
Tree Contractors
Observed during site visits, PCT in each district was being primarily completed by
manual-labor crews instead of mechanically. New contractors entering the market were rare,
and many existing contractors only recently added PCT to their company services or
emphasized this service due to the NCSPBPP. Future program funding uncertainty
discouraged many tree contractors from investing in new employees and equipment.
However, many existing tree contractors already possessed the necessary equipment required
Most of the NCDFR districts had an ample list of tree contractors providing PCT in
their area, which allowed landowners to complete projects in a timely manner. Far fewer tree
contractors were present in the western districts than in the eastern districts. However, project
delays were seldom due to the lack of tree contractors being available and were usually
attributed to the landowner.
Field Data Sheet Reporting Results
Approximately 71% of treated stands sampled were included in a landowner
management plan where an FDS was included. Table 2 and Figure 5 and 6 compare the
availability of stand characteristics of treated stands according to whether the landowner
management plan included an FDS.
Table 2: Percentage of treated stands in a landowner management plan, with or without a field data sheet, that included reporting data for stand characteristic category.
Data Availability of Treated Stands in a Management Plan
Stand Characteristic Category
Availability with FDS (%)
Availability without FDS (%)
Average DBH 97.06% 12.50%
Average Tree Height 97.06% 16.07%
Soil Classification 92.65% 10.71%
Slope 77.21% 7.14%
Landform 13.24% 1.79%
NCDFR districts 1, 4, 6, 8, 12, and 13 did not have landowner management plans without an
FDS included for comparison. Landowner management plans were not provided from district
Figure 6: Percentages of treated stands in a landowner management plan without a field data sheet for which the given stand characteristics data were provided.
Generally, each stand characteristic category was reported more frequently when an FDS was
included. Landform data were seldom collected even where an FDS was used.
Application Processing Time Results
The application processing time was found to be 59.5 days or ~2 months with a
standard deviation of 56 days and a median of 46 days. The median is a better description of
the APT data because the distribution of APT values is rightly skewed. In general, NCDFR
districts closer to the Central Office in Raleigh, NC tended to have a lower APT. No further
comparisons were conducted.
Program Process Evaluation Discussion
NCSPBPP Program Challenges
Program challenges identified from early site visits were (1) a high turnover rate for
and (2) deficient accounting of stand characteristics for enrolled stands. Several
recommendations were constructed to address these issues.
The high employee turnover undermined the NCSPBP program. Recurring upfront
costs accrued during the hiring process and training period diverted program resources. Each
time a new SPB Forester was hired, a period of time was needed for him/her to build
professional relationships and creditability among landowners and to familiarize
himself/herself with the existing social demographics, geography, and other NCDFR
personnel working in their district. Also, more disruptions and delays may have occurred
when transitioning from old to new hires because of the lack of knowledge transfer of
existing projects undertaken by the previous SPB Forester.
SPB Forester duties on a day-to-day basis were under the direct oversight of the
District Forester in each NCDFR district. This posed a potential program challenge in some
cases because several SPB Foresters were being utilized for general NCDFR operations
instead of exclusively for NCSPBPP. It is unknown the magnitude of this impact on program
results that may have occurred due to diverting program personnel resources for NCDFR
general tasks.
Another program challenge was documentation of stand characteristics before and
after treatment. An NCDFR representative was not explicitly required by the program to
record each stand characteristic analyzed for FDS reporting before treatment. This individual
can use various inventory methods to determine if a particular stand met program
requirements. A plot method was commonly used to make this determination. The number of
plots taken varied based on the NCDFR official conducting the assessment. Commonly,
NCDFR representatives would take as many plots as he or she deemed necessary to
accurately reflect the stand characteristics of a particular candidate stand. This method was
sufficient in determining whether a stand exceeded the threshold requirements of the
program, but it may be lacking in providing robust data for deriving research conclusions
but documentation by an NCDFR official evaluating stand characteristics after treatment was
common.
Based on FDS reporting results, information consistency and completeness were
identified as areas for program improvement. Collection of stand characteristics data was
sporadic among districts and especially in landowner management plans containing no FDS.
Program Process Evaluation Recommendations
The program process evaluation resulted in the following five recommendations: Institute incentives to retain SPB Foresters by offering higher pay comparable to
NCDFR permanent positions such as a Service Forester position, and administratively
discourage SPB Foresters from filling those positions immediately.
SPB Forester positions would be on a contract basis, and funding for that time period
would be guaranteed.
Change supervisory responsibilities of the SPB Foresters to the NCDFR Pest Control
Department head instead of the District Foresters.
Encourage collaboration between county-level personnel or other forestry-related governmental agencies and forestry outreach groups, such as Cooperative Extension,
and SPB Foresters, to increase efficiency in reaching eligible and at-risk landowners.
Mandate inclusion of an FDS with all landowner management and consultant plans
and require all data fields to be properly provided on this sheet prior to landowner
funding approval.
The first three recommendations encourage measures, such as higher pay and greater job
security, to retain SPB Foresters. Pay comparable to that of a Service Forester would help
compensate SPB Foresters for the uncertainty associated with funding. Also discouraging
SPB Foresters internally from transitioning to a permanent position immediately should also
improve program results. Shifting day-to-day oversight of SPB Foresters to the Central
Office would give greater authority to the NCDFR Pest Control Department head in directing
and spearheading NCSPBPP efforts on a local level and minimize opportunities for SPB
The fourth recommendation encourages collaboration between SPB Foresters and
other NCDFR personnel. This is critical in gaining access to landowner relationships already
established by county-level officials. Precommercial thinning is associated with an upfront
expense that is usually carried to the end of the rotation. This can discourage many forest
landowners, which tend to be cost adverse, from conducting PCT. Having a strong
relationship with landowners is vital to building creditability and convincing these
individuals to make this type of investment with the promise of higher future returns due to
better quality timber and reduced SPB risk.
Collaborating with other forestry-related governmental agencies and outreach groups,
such as North Carolina Cooperative Extension, can help promote the program and reach
receptive landowners seeking forestry assistance. These types of agencies and groups tend to
have high landowner interaction and cater to individuals interested in managing their forest
landholdings. Collaboration among these groups, agencies, and the NCDFR can be a feasible
method in disseminating program information among their constituents more effectively.
The final recommendation pertains to program documentation and program
data-gathering efforts. Data data-gathering was shown to be inconsistent among districts. For various
stand characteristics, such data can be essential in evaluating SPB risk and program impacts.
By requiring an FDS for each landowner management plan and ensuring that each stand
characteristic field is recorded prior to funding approval, data-gathering should improve.
Concentrating stand-characteristics information on one sheet within the landowner
management plan would streamline the auditing process. Reviewing the FDS could alert
NCDFR officials more promptly to data parameters missed during the initial stand
assessment or excluded from the management plan altogether.
No program process evaluation recommendations pertaining to APT were given
because of the lack of baseline data for comparison. Findings in this study regarding APT
create the necessary baseline for future evaluations. Having an effective process in place for
reimbursing landowners is vital in encouraging them to participate in the program,
Program Process Evaluation Conclusion
Forestry officials and lawmakers are being more proactive by promoting SPB
prevention efforts through state-operated cost-share programs and forest-health education
initiatives. The program process evaluation for the NCSPBPP revealed several obstacles to
program implementation and documentation and proposed a remedy for each. The greatest
impediments were high turnover of SPB Foresters, which could be addressed by SPB
Foresters being given greater financial incentives and being internally encouraged to
postpone taking permanent positions; SPB Foresters’ being utilized for general tasks, which
calls for changing the position to which they directly report; and inconsistent data collection,
which suggests requiring a FDS to be filled out properly in each landowner management plan
prior to funding approval. Research efforts also yielded an unplanned positive impact on
program implementation. The previously identified program challenges of high turnover rate
of SPB Foresters and their being used for general tasks were brought to the attention of
program managers, who then addressed them early during research efforts, thus improving
ESSAY TWO: NORTH CAROLINA SOUTHERN PINE BEETLE PREVENTION PROGRAM COST AND BENEFIT ANALYSIS
Cost and Benefit Analysis General Application and Theory
Commonly, the government offers subsidies to landowners in the form of cost-share
programs to internalize positive externalities provided by environmental improvements such
as clean water, wildlife habitat improvement, enhanced aesthetics, and carbon sequestration.
Economists usually justify government interference in the free markets as preventing market
failures, such as positive or negative externalities. Based on the assumption that forest
landowners do not invest the necessary capital, state and federal cost-sharing and
tax-incentive programs have been instituted (Kronrad & Morzuch, 1985).
Publicly funded forestry cost-share programs can have the following objectives: (1)
provide incentives for private landowners to implement some specific practice(s) to better
manage their forests, and (2) produce more benefits derived from forests to society, which
may include improving ecosystem services, producing superior forest products, fueling
renewable energy, preserving recreation areas, and mitigating insect and disease outbreaks.
Federal, state, and local agencies document program benefits, costs, and
accomplishments, in part to present to policymakers and legislative bodies to justify initiation
of government funding or continued funding of a program or project. Cost and benefit
analysis (CBA) is an effective method to document and quantify different parameters in one
concise analysis. Executive Order 12291, issued by President Ronald Reagan in early 1981,
mandated the general use of CBA by the U.S. federal government, which was reaffirmed by
President Clinton in Executive Order 12866 in 1994 (Boardman et al., 2006). CBA has been
used in the past to justify or suggest elimination of preexisting forestry practices and
incentive programs (Kronrad & Morzuch, 1985; Clarke & Billings, 2003).
In a general sense, CBA is a policy-assessment technique to quantify all
consequences of a policy in monetary terms. CBA is intended to facilitate better decision
making to more efficiently allocate societal resources. There are three major types of cost
useful in determining whether resources should be allocated to a particular project or
program under consideration. This type of CBA is usually the least accurate. Media res
analysis is conducted during the life of a project or program. This type of analysis can
suggest possible shifts of resources to alternative uses and can lead to project or program
termination. Conducting a CBA at the end of a project or program, ex post CBA, is
commonly the most accurate and can contribute in determining the value of proposed
projects and programs that are similar (Boardman et al., 2006).
CBA benefits society by enabling better-informed decision makers and more efficient
resource allocation. A well-formulated CBA can break down the relevant costs and benefits
and present the analysis findings in the best comprehensive set of information to
policymakers (Williams, 2008). Conducting a CBA can also introduce accountability into
decisions that affect whole communities and encourages people to be aware of the
environmental and human costs of what they do (Schmidtz, 2001). CBA also creates greater
regulatory transparency and helps government agencies set priorities for different projects
and programs (Alder & Posner, 1999). This tool remains relevant through the continuous
development of new empirical methods to evaluate benefits and costs.
However, CBA can also have many pitfalls and sometimes is not the most appropriate
tool for government (Williams, 2008). Some pitfalls may include the following:
Difficulty of aggregating individual effects across the relevant population (Williams,
2008; Boardman et al., 2006),
Can be hampered due to lack of data (Alder & Posner, 1999),
Costly to measure benefits and costs, requires a level of expertise, includes intangible
elements that cannot be measured (Williams, 2008),
Does not produce morally relevant information (Alder & Posner, 1999), May have goals other than efficiency that are relevant (Boardman et al., 2006), May include distribution-of-wealth issues regarding willingness to pay (WTP) and
Greatly influenced by the discount rate and relevant costs and benefits chosen by the
analyst.
The very premise of CBA, Pareto efficiency, is argued by many economists and philosophers
as being inappropriate when deciding the wellbeing of individuals.
Alternative methods to CBA include cost-effectiveness analysis, cost-utility analysis,
and multigoal analysis. Cost-effectiveness analysis can be used when two programs have
similar or the same goal(s). Cost-utility analysis is commonly used in health economics
because the benefits are usually measured in non-monetary units (Williams, 2008). Multigoal
analysis can be used also when comparing alternatives based on relevant goals instead of just
efficiency (Boardman et al., 2006). Despite some of the disadvantages of CBA and
alternative techniques, these methods are commonly used by government agencies to
evaluate proposed government programs and projects and have aided lawmakers for decades
in weighing alternative uses and allocation of scarce public resources.
At the request of North Carolina Division of Forest Resources (NCDFR) officials, a
media res analysis was conducted to evaluate the net benefits of the North Carolina Southern
Pine Beetle Prevention Program (NCSPBPP). This program addressed the classic economic
problem of market failure due to underproduction of a positive externality. In this case, the
benefits generated from precommercial thinning (PCT), which includes the reduction of
expected timber volume loss caused by the southern pine beetle (SPB) in treated stands and
adjacent parcels. PCT increases the tree vigor of residual crop trees (Cain, 1993), reduces the
probability of SPB infestation and severity of spread once an SPB infestation is initiated,
produces higher-quality timber products (Cain, 1993), enhances aesthetics, and improves
wildlife habitat (Mann & Lohrey, 1974; Cain, 1993). This market failure in the free markets
justified government intervention through offering forest landowners subsidies, but this
measure does not address how to allocate societal resources efficiently.
The objectives of CBA of the NCSPBPP are to quantify program net benefits to
society, gain greater insight into program benefits and costs, identify feasible program shifts