OPTIMIZED FEATURE SELECTION FOR TROPICAL WOOD SPECIES RECOGNITION USING GENETIC ALGORITHM
USWAH BINTI KHAIRUDDIN
OPTIMIZED FEATURE SELECTION FOR TROPICAL WOOD SPECIES RECOGNITION USING GENETIC ALGORITHM
USWAH BINTI KHAIRUDDIN
A thesis submitted in fulfilment of the requirements for the award of the degree of
Master of Engineering (Electrical)
Faculty of Electrical Engineering Universiti Teknologi Malaysia
iii
iv
ACKNOWLEDGEMENTS
In the name of Allah, Most Gracious and Most Merciful
v
ABSTRACT
vi
ABSTRAK
vii
TABLE OF CONTENTS
CHAPTER TITLE PAGE
DECLARATION ii
DEDICATION iii
ACKNOWLEDGEMENTS iv
ABSTRACT v
ABSTRAK vi
TABLE OF CONTENTS vii
LIST OF TABLES xi
LIST OF FIGURES xiv
1 INTRODUCTION
1.1 Introduction 1
1.2 Manual Wood Recognition 2
1.3 Automatic Wood Recognition System 11
1.4 Research Objectives 16
1.5 Study Scope and Limitations 16
1.7 Thesis Outline 18
2 LITERATURE REVIEW
2.1 Introduction 19
2.2 Techniques of Wood Species Identification 20 2.2.1 Wood Identification Techniques Based on Wood
Microscopic Characteristics
viii 2.2.2 Wood Identification Techniques Based on Wood
Macroscopic Characteristics
25
2.3 Feature Extractors 28
2.4 Feature Fusion 29
2.5 Classifiers 31
2.6 Feature Selection 32
2.7 A New Mutation Operation in Genetic Algorithm for Convergence in Feature Selection Process
35
2.8 Summary 36
3 METHODOLOGY
3.1 Introduction to Automatic Tropical Wood Species Recognition System
38
3.2 Components of Automatic Tropical Wood Species Recognition System
41
3.2.1 Wood Database
3.2.2 Image Enhancement / Pre-processing 3.2.3 Feature Extraction Algorithm
41 49 54
3.3 Feature Selection Algorihtm 66
3.3.1 Overview on Genetic Algorithm (GA)
3.3.2 Implementation of GA as Feature Selector in the Automatic Tropical Wood Species Recognition System
3.3.3 Wrapper GA with k-NN Classifier 3.3.4 Wrapper GA with LDA Classifier
3.3.5 A New Mutation Operation in GA for Feature Selection for Faster Convergence
3.3.5.1 Formulation of the new mutation Process
3.3.5.2 Advantage of improved mutation operation in GA
ix
4 EXPERIMENTAL RESULTS & DISCUSSIONS
4.1 Introduction 90
4.2 Experiment A – 27 Wood Species Database 93 4.2.1 Experiment A-1: To determine the effect of
Varying the co-occurrence distance d for GLCM 4.2.2 Experiment A-2: Setting best BPNN parameters 4.2.3 Experiment A-3: Finding best k-NN distance And value
4.2.4 Experiment A-4: Classification before and after Feature selection
95
96 97
98
4.3 Experiment B – 36 Wood Species Database 101 4.4 Experiment C – 52 Wood Species Database 104
4.4.1 Finding best k for k-NN classifiers 4.4.2 Classification for GLCM features 4.4.3 Finding best parameters for BGLAM 4.4.4 SPPD Features classification
4.4.5 BGLAM feature & SPPD features fusion
106 106 107 110 111
4.5 Experiment D – New Mutation Operation in GA for Faster Convergence
114
4.5.1 Setting minimum fitness Fg for good
chromosomes
4.5.2 Setting the parameter l of mutated chromosome 4.5.3 Comparison between normal GA and GA with
the new mutation method
115
116 117
4.6 Conclusions 126
5 CONCLUSIONS
5.1 Conclusion 128
5.2 Future Works 131
REFERENCES 132
xi
LIST OF TABLES
TABLE NO. TITLE PAGE
3.1 List of 27 wood species in the database 43
3.2 List of 36 Wood Species 45
3.3 List of 52 Wood Species 48
3.4 Number of BGLAM Features for different Grey Levels 61 3.5 Classification of vessels or pores sizes on wood surfaces 63 3.6 Density of vessels and pores in wood surfaces 64 4.1 Result of classification using different GLCM distances.
Classification is done using BPNN classifier.
95
4.2 GLCM features extracted from 1 image sample 96
4.3 Best parameters for BPNN for training and classification 97 4.4 Result of classification using BPNN classifier 98 4.5 Result of classification using k-NN classifier 99 4.6 Distance difference between test sample 731, training
sample 4904 and training sample 5273
100
4.7 List of feature extractors used for 36 wood species database and number of features extracted per image
102
4.8 Classification accuracy before and after feature selection for all features database and for all classifiers.
103
4.9 Feature databases for 52 wood species 105
4.10 Classification accuracy for GLCM database. The classification is done using k-NN and LDA classifier. Feature selection is done using wrapper GA with
xii k-NN or LDA classifiers.
4.11 Classification accuracy for database BGLAM1. The
classification is done for various number of grey levels and window size, using k-NN and LDA classifier
108
4.12 Classification accuracy for database BGLAM2. The
classification is done for various numbers of grey levels and window size, using k-NN and LDA classifier
109
4.13 Classification accuracy for database BGLAM2, 16 grey
levels and 7x7 window size. The classification is done using k-NN and LDA classifier. Feature selection is done using wrapper GA.
110
4.14 Results of classification of SPPD features database 111 4.15 Results of classification accuracy for the fused
BGLAM&SPPD database. the database is the combination of BGLAM features and SPPD features. Number of features selected included
111
4.16 Result of classification accuracy for database GLCM, BGLAM2, SPPD2 and BGLAM&SPPD. Number of
selected features also included
112
4.17 Number of features selected from the fused feature database, BGLAM&SPPD, using two approaches; k-NN based GA feature selection and LDA based GA feature selection. The table also provides information about features selected from each feature extractor.
113
4.18 Result of feature selection using new mutation GA with different Fg
115
4.19 Results of the feature selection using new mutation GA with different l
116
4.20 Results of the feature selection process using both normal GA and new mutation GA
119
4.21 Number of occurrence of 1st ranked mutated chromosome at the time of increment
xiii 4.22 Average rank of mutated chromosome in a population and
its standard deviation
xiv
LIST OF FIGURES
FIGURE NO. TITLE PAGE
1.1 Cross section of a tree trunk 4
1.2 Manual identification by human using magnifier (left) and texture surface image through the magnifier lens
5
1.3 Pores on wood surface 6
1.4 Types of pores arrangement on wood surface 6
1.5 Wood surface with low density (left) and numerous density (right)
7
1.6 Some of the pores filled with pores deposit 7
1.7 Diffuse parenchymas on Keledang wood surface 8
1.8 Short tangential lines parenchymas on Keranji wood surface 8
1.9 Banded parenchyma on Mataulat wood surface 9
1.10 Aliform parenchyma on Kempas wood surface 10
1.11 Resin canal on Giam surface 10
1.12 Flow diagram for the automatic tropical wood species recognition system
12
2.1 Columnar cells of wood is one of microscopic characteristics of wood. (Dinwoodie, 1975)
21
2.2 Timber section. The top area is the cross section of wood surface. (Dinwoodie, 1975)
21
2.3 Microwave test bed to measure internal readings of wood (Fuentalba et al., 2004)
xv
2.4 Apparatus for fluorescent spectra analysis. (Piuri and Scotti, 2010)
24
2.5 Examples of tropical wood surface texture 26
2.6 Some examples of Indian wood grain. (Bremanath et al., 2009)
27
2.7 Some examples of China wood textures. (YunBing Tang et al., 2009)
27
3.1 Block diagram for automatic tropical wood species recognition system with feature selection algorithm (bold)
40
3.2 CCD Camera (right) captures wood surface images and saved in the computer.
42
3.3 Some of wood surface images captured by the CCD camera 43
3.4 Portable camera 45
3.5 (a) Original image, (b) Image sharpening using high-pass filter and (c) Contrast enhancement using histogram equalization.
50
3.6 Histogram plot of Figure 3.6 (a) before histogram equalization and (b) after histogram equalization
51
3.7 Flowchart of homomorphic filtering process where ln is the natural log, DFT is Discreet Fourier Transform and exp is exponential.
53
3.8 (a) original image and (b) image after homomorphic filtering
53
3.9 Illustration of BGLAM feature extractor; how it works 59 3.10 Illustration of BGLAM image in different rotation 61
3.11 Solitary pores on wood surface 64
3.12 Pair pores and scalarifom pores on wood surface 65 3.13 (a) Homomorphic image (b) Black and white images
showing the black pores and (c) Black and white images showing the “white pores”
65
3.14 A population of size m with m chromosomes that have length n
xvi
3.15 Crossover and mutation operation in GA 71
3.16 Flowchart of normal GA operation 72
3.17 The images of wood species Chengal (a) Image with surface defects, (b) Image with no surface defects
74
3.18 The images of wood species keranji in different lighting brightness
74
3.19 The images of wood species with similar surface patterns (a) Chengal, (b) Melunak
74
3.20 Alleles with bit number ‘1’ indicated the features are selected
75
3.21 Fitness evaluation for chromosome 1 (C1). Alleles with bit number ‘1’ indicated the features are selected.
76
3.22 Fitness evaluation for chromosome 1 (C1). Reduced size database with only selected features are formed. In the above Figure, features that are not selected are not present in this database. For example, features f2, f3, f5.
77
3.23 Body of a GA program. 79
3.24 Flow diagram of GA implementation as feature selector in automatic wood species recognition system
79
3.25 k-NN classifier inside GA fitness evaluation process 80
3.26 Implementation of LDA in GA 82
3.27 Flowchart for the new improved mutation operation in GA 85 3.28 Example of how the mutated chromosome (IMCh) is
created from a pool of good chromosome in the Improved Mutation Operation
88
4.1 Image of wood cube surfaces are captured using a camera 91 4.2 Images of wood surface are stored to build an image
database
91
4.3 Enhanced images of wood surface are stored to build an enhanced image database
92
4.4 Features extracted from the wood images are stored in excel file
92
xvii 4.6 Graph showing effects of using different value of k and type
of distance used
97
4.7 Classification accuracy versus value of k in k-NN classifier 106 4.8 New mutation GA converges to optimal solution faster than
normal GA.
117 4.9 Number of generations required by each experiment to
reach optimal value.
120
4.10 Distribution plot of the mutated chromosome’s rank in experiment 1
123
4.11 Results of experiments comparing improved mutation GA & normal GA for 27 wood database with 40 GLCM features
124
4.12 Results of experiments comparing improved mutation GA & normal GA for 27 wood database with 80 Gabor features
CHAPTER 1
INTRODUCTION
1.1 Introduction
Malaysia is one of the top exporters for tropical timbers product in the world. Statistics from Malaysian Timber Industry Board (MTIB) shows that timber exports contributed more than 4.5 billion USD for the country’s 2011 income. Tropical timbers are used in various activities and industries around the world. Revenues are generated from housing or development industries, furniture and shipping industry. It is important for the timber dealers to generate such revenue for future import-export activities. To do so, they have to maintain the quality of timber products, ensure the exact type of timber being used for certain products and ensure the exact type of timber being exported all around the world. However, some timber exporter practices fraudulent labeling to escape from paying high amount of export tax (Ruhong Li, 2008). Therefore, there are quite number of cases where wrong types of timber are used for the end product. This problem will cause danger especially in the development and housing industries.
2
in the tropical forests (Chapman, et al., 2001 & Johns, 1996). Wood species diversity will also be reduced due to the widespread illegal logging without any control and law enforcement. There are more than 32 million hectares of tropical forests damaged each year resulting in a loss of more than 360 million USD annual tax (Casson & Obidzinski, 2002). Income of people in money-poor, resource-rich countries is reduced because illegal trading of timbers. Fraudulent labeling also reduces country’s revenues generated by tax and tariffs where high quality wood are labeled as low quality and will be imposed a lower tax. It is important to have a good system that can control these kinds of activities.
In 4-weathered countries like United States, European countries and Japan, there are wood atlases where all images and details of wood types are compiled and become reference (Hoadley, 1990). They compare an unknown wood species with descriptions and illustrations in wood atlases in order to make wood identification. The identification process is simple and easy because wood types in these countries are of softwood type only and there are only 12 species of softwood altogether. However, wood identification process in Tropical climate countries are more complicated because of the large number of tropical wood species, mostly hardwoods which have many variations.
1.2 Manual Wood Recognition
3
However, when the trees are felled and processed to timber, these important characteristics are no longer available to present the identity of the wood species.
In order to identify wood species after it was processed to timber, another set of characteristics can be used. They are; the colour of the wood, the weight or density of the wood, the hardness, the smell and lastly, the texture on the wood surface. Menon (1993) has written a book that explained in detail the wood structure and how to identify wood species. The texture is actually the wood grain pattern on the cross section of timber surface. Out of these characteristics, wood texture will play the most important part in wood species identification. The texture will not be changed or evolved even after going through many processes. It will also maintain the same wood grain pattern after any type of chemical procedures. The age and place of growth may give variation to the texture. However, it can still be identified because the texture of wood is like fingerprints to humans. Our fingerprints may change a little as we grow but it remained to be unique to ourselves. It is essential to note that colour of wood may differ according to its location of growth, its age and its moisture. Furthermore, the colour may change after undergone chemical procedures. Chemical procedures will also alter the density, hardness and smell of the wood. Drying process will have the woods burned to remove all the moisture inside the wood. This process may change the wood colour, weight, density and also smell.
4
The chain list which contains the specific criteria of descriptions that match the pattern has to be followed diligently in order to obtain the matching answer.
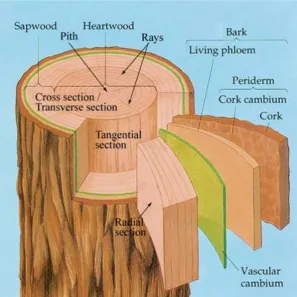
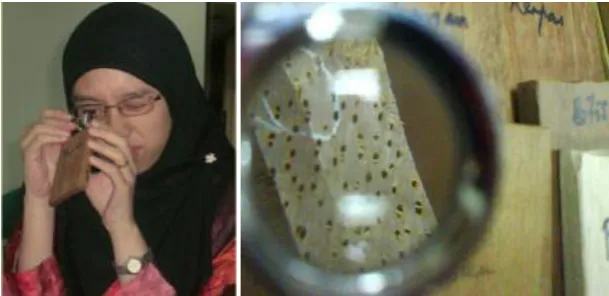
Wood texture can be seen on the cross section of timber surface (Figure 1.1) using a special magnifier that can give ten times (10X) magnification. Figure 1.2 shows how manual wood species identification is done using the magnifier and what the person is expected to see through the magnifier.
5
Figure 1.2 : Manual identification by human using magnifier (left) and texture surface image through the magnifier lens
Wood surface structure has some unique characteristics that can differentiate one species from the others. Important characteristics that these experts look at are the structure of:
vessels or pores
wood parenchyma or soft tissue rays or rays parenchyma
fibers phloem latex traces
intercellular canals
6
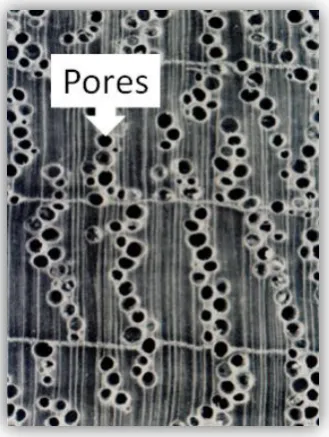
Figure 1.3 : Pores on wood surface
Pores may occur in single, pairs or multiples. Single pores are called solitary pores. Pair pores occur when two pores are so near each other that end walls in contact are flattened and the pores looks like a single pore that have been divided to two. Multiples pores, which are also called scalariform pores occur when multiple pores are crowded and so near each other and it forms a long string of pores. Figure 1.4 below shows example of solitary, pair and scalariform pores.
7
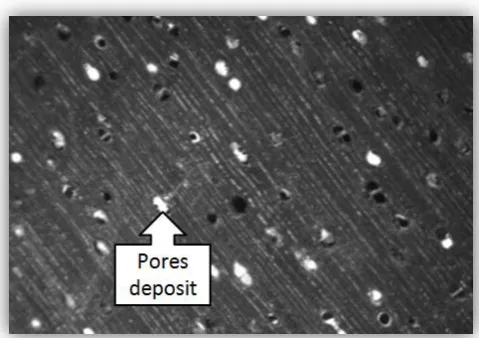
Pore density is determined by how many number of pores available per square millimeters on wood surface. Figure 1.5 below shows wood surface with low pores density and numerous pores density. Some of inactive pores are blocked with gummy or chalky substance called pores deposit. They are actually tyloses which are projected by the wall cavity. Figure 1.6 shows deposits in some pores.
Figure 1.5 : Wood surface with low density (left) and numerous density (right)
Figure 1.6 : Some of the pores filled with pores deposit
8
Figure 1.7 shows diffuse type parenchymas on wood species Keledang. Diffuse parenchyma is a single parenchyma cells that are distributed irregularly among the fibres.
Figure 1.7 : Diffuse parenchymas on Keledang wood surface
Another type of parenchyma is a short tangential lines parenchyma. There are some cells groups that are scattered tangentially between the rays to form network-like lines. Figure 1.8 is an example of short tangential lines parenchyma.
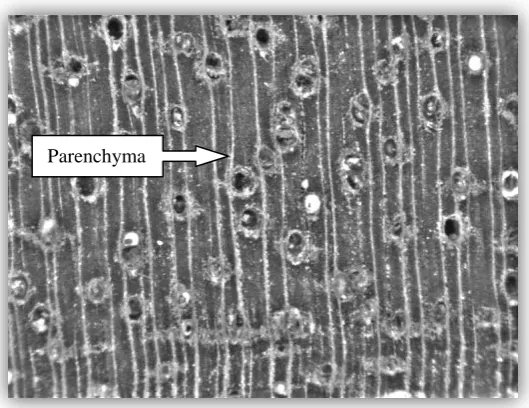
Figure 1.8 : short tangential lines parenchymas on Keranji wood surface Parenchyma
9
There are also bands or banded parenchyma where the parenchyma rays are so widely spaced than one another. Figure 1.9 shows example of banded parenchyma on mataulat wood surface.
Figure 1.9 : Banded parenchyma on Mataulat wood surface
The diffuse, short tangential lines and banded parenchyma are all from the apotracheal group of parenchyma where they are not associated with vessels or
pores. Parenchymas that are associated with vessels are from the group paratracheal paranchymas. The parenchyma tissues of this group usually found at pores surroundings. Most common paratracheal parenchyma is aliform parenchyma where the surroundings parenchyma tissues on the pores extended to form a wings-like shape. Figure 1.10 shows aliform parenchyma on wood species Kempas.
10
Figure 1.10 : Aliform parenchyma on Kempas wood surface
Other structural features on wood surface such as phloem, latex traces and intercellular canals are rarely seen on any types of wood species. These features are usually assumed as standard marks on wood or defects on wood. In this system, these marks will become noise features that may affect species classification result. An example of resin canal may be seen in Figure 1.11 below.
Figure 1.11 : Resin canal on Giam surface aliform
11
There is no doubt that the structural features discussed above may be the key features in classifying wood species. The most important features are the pores characteristics as it is unique for every species. Therefore, after taking into accounts all these information, a new feature extractor called Statistical Properties of Pores Distribution (SPPD) which extracts all information from pores characteristics; pores size, pores density and types of pores, was developed. This feature extractor will be used in the automatic tropical wood species recognition system alongside other feature extraction methods.
1.3 Automatic Tropical Wood Species Recognition System
12
The work includes the use of grey level co-occurrence matrix (GLCM) technique and Gabor filters for extracting the texture features of the wood species and using multi-layer back propagation neural network (BPNN) for classification. Figure 1.12 below shows the flowchart of the automatic tropical wood species recognition system. However, since the macroscopic anatomy image of wood is not uniform but contains variation of intensities which form certain repeated patterns called visual texture (Petrou & Sevilla, 2006), the system can only indentifies 20 types of tropical wood species. The system’s 95% accuracy dropped tremendously when more wood species are added into the database.
Figure 1.12 : Flow diagram for the automatic tropical wood species recognition system
13
image pre-processing technique which filters the image after nonlinear mapping into different domain and the image are mapped back into the original domain. This process eliminates illumination and reflectance in the image thus reduces noisy features in it.
Different feature extraction techniques such as the Basic Grey Level Aura Matrix (BGLAM), developed by Xuejie Qin and Yee-Hong Yang (2007) and Statistical Properties of Pores Distribution (SPPD) (Khairuddin, et al., 2011) are also explored in order to provide the system with better features to be used for classifications. The BGLAM feature extraction algorithm is similar to GLCM feature extraction method. However, the process is more straightforward. The numerical combinations of grey level values are taken as BGLAM features directly without going through any additional filters. BGLAM features are more reliable as it is proven that it can re-produce the original image from the feature values.
The SPPD feature extraction mimics manual procedure of tropical wood species recognition which is observing the pores characteristics such as size and density of pores. SPPD features are very important as wood texture is not a simple uniform pattern but contains a lot of variation even in the same wood species. Therefore, SPPD records the key of recognizing wood which is the pores characteristics.
14
Although increasing number of features will give more information for the data (Solberg & Jain, 1997, Clausi & Huang Deng, 2005 and Bing-Yu Sun, et al., 2010), there are also downsides of it. Some of the features are redundant and not discriminative. Feature redundancies will affect accuracy due to inter class and intra class discriminatory factors. There are also error features that did not give correct information about the image because it is obtained from uncontrolled environment when capturing the images.
Therefore, feature selection algorithm is introduced into the system to solve the above problems. Feature selection is a process that makes subset selection from the original database and it retains original features without changing the features’ domain (Huan Liu & Lei Yu, 2005). The feature selection technique is proposed for the implementation of the automatic tropical wood species recognition system in order to improve the system’s accuracy. The addition of the feature selection not only able to reduce the size of the wood databases but will have an effect in keeping only important discriminant features for classification use. The process can result in the removal of noise features that originates from wood defect or marks such as latex traces, resin canal and phloem.
Other objectives of feature selection that were highlighted by Liu, et. al. (2005) are:
1) To reduce database dimensionality
15
2) To remove irrelevant features
Quantity does not determine the quality. More features do not ensure good outcomes. Only good features can give good outcomes. Therefore, the extras, or outliers must be removed from the database.
3) To reduce learning computational cost
More features will result in high computational time. By reducing the feature dimensions, computational cost will be cut accordingly.
4) To increase variables prediction accuracy
After feature selection, only discriminative features are kept in the database. These features are unique for each class and can differentiate it with other classes.
5) To keep only important features that gives comprehensive understanding for all variables.
Every object has its important features that will be its own signature. For example, important key features for human identification are sex, height, skin colour etc. The other not so important features are the size of feet, the length of arm. These features are hard to be distinguished from others.
In this thesis, an optimize feature selection algorithm was developed to the fused feature set by selecting only discriminant features to be used for classification. A wrapper Genetic Algorithm (GA) is introduced into the system to make feature selection and classification.
16
the convergence rate in feature selection process. This new mutation operation is developed in such way to assist feature selection by GA. It creates good feature combinations from high fitted chromosomes thus fasten the process of obtaining the perfect feature combinations.
1.4 Research Objectives
The objectives of this master’s project are as follows:
a) To develop a feature selection algorithm using Genetic Algorithm (GA)
b) To implement feature selection algorithm in the automatic tropical wood species recognition system
c) To use suitable feature extraction method that can gives good discriminative features
d) To select suitable classifiers that can work with GA and give the best classification accuracy.
e) To develop method for reducing the computation time of the GA based feature selection
1.5 Study Scope and Limitations
17
blocks form. To assist this project, FRIM provides wood samples in small cubic form sized 1 inch by 1 inch approximately. A wood database was built in CAIRO for this project using the wood samples
This master’s research focuses on feature selection algorithm in the automatic wood species recognition system. Feature selection algorithm used is Genetic Algorithm. Feature selection algorithm for this system was programmed in such a way that it can be used on any wood databases. Therefore, if there are new wood databases in future, they can still use the same feature selection algorithm.
In the attempt to increase system’s performance, the feature selection algorithm must be supported by other good feature extraction algorithm and classifiers. Therefore, the scope of this research is expanded to finding the most compatible feature extraction method and classifiers. GA used in this system is wrapper GA where a classifier was embedded inside GA. Type of classifier can be changed according to the database suitability.
18
1.6 Thesis Outline
The flow of this thesis is as follows: Chapter 1 - Introduction
This chapter explained about wood recognition process and why there is a need to make the process automatic, how the automatic wood species recognition system was developed and what we did to improve the system. Problem statement and objective of this master’s research were included in this chapter.
Chapter 2 – Literature Review
This chapter discussed in detail research by other researchers that inspires this research, to decide and choose which algorithm can be used in this master’s research.
Chapter 3 – Methodology
This chapter explained all methodologies and processes involved in the automatic tropical wood species recognition system.
Chapter 4 – Experimental Results & Discussions
This chapter lay out results of experiments that have been done with analysis and discussions.
Chapter 5 – Conclusions
132
REFERENCES
Baas, P., Wheeler, E., et al. (2000). Dicotyledonous wood anatomy and the APG system of angiosperm classification. Botanical Journal of the Linnean Society. 134(1-2): 3-17.
Bashar, K.M., Ohnishi, M. (2002). Fusing cortex transform and intensity based features for image texture classification. Proceedings of 5th Int. Conference on Information Fusion. 1463–1469.
Bing-Yu Sun, Xiao-Ming Zhang, Jiuyong Li, Xue-Min Mao. (2010). Feature Fusion Using Locally Linear Embedding for Classification. IEEE Transactions on Neural Networks. 21(1): 163 – 168.
Bremananth, R., Nithya, B., Saipriya, R. (2009). Wood Species Recognition System. World Academy of Science, Engineering and Technology. 52.
Calhoun, V.D., Adali, T. (2009). Feature-Based Fusion of Medical Imaging Data. IEEE Transactions on Information Technology in Biomedicine. 13(5): 711-720.
Casson, A., Obidzinski, K. (2002). From New Order to Regional Autonomy: Shifting Dynamics of “Illegal” Logging in Kalimantan, Indonesia. World Development. 30(12): 2133-2151.
Chapman, C.A., Chapman, L.J., Jacob, A.L., Rothman, J.M., Omeja, P., Reyna-Hurtado, R., Hartter, J., Lawes, M.J. (2010). Tropical tree community shifts: Implications for wildlife conservation. Biological Conservation. 143(2): 366-374.
Choffel, D. (1999). Automation of wood mechanical grading - coupling of vision and microwave devices. Proceedings of SPIE 1999- The International Society for Optical Engineering, Boston, MA, USA.
Clausi, D.A., Huang Deng. (2005). Design-based texture feature fusion using Gabor filters and co-occurrence probabilities. IEEE Transactions on Image Processing. 14(7): 925 – 936.
133 Dinwoodie, J.M. (1975). Timber, it’s Nature and Behaviour. Journal of Microscopy,
104(1).
Duda, R., Hart, P., and Stork, D., (2001). Pattern Classification, 2nd ed. Wiley. New York.
Ekenel, H.K, Stiefelagen. (2007). Two-class Linear Discriminant Analysis for face recogntion. IEEE Transactions on Signal Processing and Communications Applications. 15(11): 1-4.
Faten Hussein, Rabab Ward, Nawwaf Kharma (2001). Genetic Algorithms for Feature Selection and Weighting, A Review and Study. Sixth International Conference on Document Analysis and Recognition (ICDAR'01), 2001. 1240.
Fuentealba, C., Simon, C. et al. (2004). Wood products identification by internal characteristics readings. Proceedings of the IEEE International Conference on Industrial Technology, Hammamet.
Göberk, B., Dutağacı, H., Ulaş, A., Akarun, L., Sankur, B. (2008). Representation Plurality and Fusion for 3-D Face Recognition. IEEE Transactions on Systems, Man, And Cybernetics –Part B: Cybernetics. 38(1).
Grefenstette J, Thompson K, Shannon W, and Steinmeyer B. (2005). Genetic algorithms for feature selection using Mantel correlation scoring. The Inter Face Classification and Clustering 37th Symposium. St. Louis, MO.
Guo-Dong Guo, Jain, A.K., Wei-Ying Ma, Hong-Jiang Zhang (2002) Learning similarity measure for natural image retrieval with relevance feedback. IEEE Transactions on Neural Networks. 13(4): 811 – 820.
Hadhoud, M.M. (1999). Image contrast enhancement using homomorphic processing and adaptive filters. Proceedings of the Sixteenth National Radio Science Conference, NRSC '99.
Haralick, R.M. (1979). Statistical and Structural Approaches to Texture. Proceedings of the IEEE. 67: 786-894.
Haralick, R.M., Shanmugam, K. & Dinstein, I., (1973). Textural Features for Image Classification. IEEE Transactions on Systems, Man, and Cybernetics. SMC-3(6): 610-621.
134 Hoadley, R.B. (1990). Identifying Wood. Taunton Press. Newton, Connecticut. Huan Liu, Lei Yu (2005). Toward integrating feature selection algorithms for
classification and clustering. IEEE Transactions on Knowledge and Data Engineering. 17(4): 491 – 502.
Ilic, J. (1991). CSIRO Atlas of Hardwoods. Crawford House Press Pty. Ltd. Australia.
Ingu, T.; Takagi, H. Accelerating a GA convergence by fitting a single-peak function. 1999 IEEE International Fuzzy Systems Conference Proceedings. Seoul, Korea.
Iqbal, M. A., Khan, N. K., Mujtaba, H., Baig, A. R. A Novel Function Optimization Approach Using Opposition Based Genetic Algorithm With Gene Excitation. International Journal of Innovative Computing, Information and Control.
7(7B).
Johns, A.G. (1996). Bird population persistence in Sabahan logging concessions. Biological Conservation. 75( 1): 3-10.
Jones, K. O. (2005). Comparison Of Genetic Algorithm And Particle Swarm Optimisation, International Conference on Computer Systems and Technologies - CompSysTech’2005. 1-6.
Khairuddin, U., Yusof, R., Khalid, M., Cordova, F (2011). Optimized Feature Selection for Improved Tropical Wood Species Recognition System. ICIC Express Letters Part B: Applications. 2(2): 441-446.
Kumar, N., Andreou, A.G. (1996). A Generalization of Linear discriminant Analysis in Maximum Likelihood Framework. Proceedings of Joint Meeting of American Statistical Association.
Kurvonen, L., Hallikainen, M.T. (1999). Textural information of multitemporal ERS-1 and JERS-ERS-1 SAR images with applications to land and forest type classification in boreal zone. IEEE Transactions on Geoscience and Remote Sensing. 37(2): 680 – 689.
135 Liu, H., Dougherty, E.R., Dy, J.G., Torkkola, K,, Tuv, E., Peng, H., Ding, C., Long, F., Berens, M., Parsons, L., Zhao, Z., Yu, L., Forman, G. (2005). Evolving Feature Selection. Intelligent Systems, IEEE. 20(6):64 – 76.
Marinakis, Y., Dounias, G., Jantzen, J. Pap smear diagnosis using a hybrid intelligent scheme focusing on genetic algorithm based feature selection and nearest neighbor classification. IEEE Computers in Biology and Medicine 39: 69 – 78. Marzuki Khalid, Eileen L.Y.L., Rubiyah Yusof, Nadaraj, M. (2008). Design of an
Intelligent Wood Species Reocgnition System. International Journal of Simulation Systems, Science & Technology. 9(3): 9-19.
Menon, P.K.B., Ani Sulaiman, Choon, L.S. (1993). Structure And Identification Of Malayan Woods. Malayan Forest Records No 25, Forest Research Institute Malaysia, Malaysia.
Nithya, R., Santhi, B. (2011). Mammogram Classification Using Maximum Difference Feature Selection Method. Journal of Theoretical and Applied Information Technology. 33(2): 197-204.
Petrou, M., Sevilla, G.S. (2006). Dealing With Textures. John Wiley & Sons Ltd. West Sussex, England.
Piuri, V., Scotti, F. (2010). Design of an Automatic Wood Types Classification System by Using Fluorescence Spectra. IEEE Transactions on Systems, Man, and Cybernetics, Part C: Applications and Reviews. 40(3): 358-366.
Raymer, M., Punch, W., Goodman, E., Kuhn, L., and Jain, A. (2000). Dimensionality Reduction Using Genetic Algorithms. IEEE Transactions on Evolutionary Computations. 4(2).
Ruhong Li, J. Buongiorno, J.A. Turner, S. Zhu, J. Prestemon (2008). Long-term effects of eliminating illegal logging on the world forest industries, trade, and inventory. Forest Policy and Economics. 10(7-8): 480-490.
Sharkawy, R., Ibrahim, K., Salama, M. M. a., & Bartnikas, R. (2011). Particle Swarm Optimization Feature Selection For The Classification Of Conducting Particles In Transformer Oil. IEEE Transactions on Dielectrics and Electrical Insulation, 18(6): 1897-1907.
136 Solberg A.H.S., Jain A.K. (1997). Texture fusion and feature selection applied to
SAR imagery. IEEE Transaction on Geosciences and Remote Sensors. 35(2): 475–479.
Sun, Y., Babbs, C., Delp, E. (2005). A Comparison of Feature Selection Methods for the Detection of Breast Cancers in Mammograms: Adaptive Sequential Floating Search vs. Genetic Algorithm. Proceedings of the 2005 IEEE Engineering in Medicine and Biology 27th Annual Conference. Shanghai,
China.
Teknomo, Kardi. (2006). Discriminant Analysis Tutorial. http://people.revoledu.com/kardi/ tutorial/LDA/
Thawonmas, R. and Abe, S. (1997). A Novel Approach to Feature Selection Based on Analysis of Class Region. IEEE Transactions on Systems, Man And Cybernetics-Part B: Cybernetics, 27(2).
Woods, R.E., Gonzalez, R.C. (1981). Real-time Digital Image Enghancement. Proceedings of IEEE, 69(5): 643 – 654.
Wu Jiying, Gaoyun An, Qiuqi Ruan. (2009) Independent Gabor Analysis of Discriminant Features Fusion for Face Recognition. IEEE Signal Processing Letters. 16(2): 97 – 100.
Xuejie Qin, Yee-Hong Yang (2007). Aura 3D Textures. IEEE Transactio on Visualization and Computer Graphics. 13(2).
Xuejie Qin; Yee-Hong Yang. (2004). Similarity measure and learning with gray level aura matrices (GLAM) for texture image retrieval. Proceedings of the 2004 IEEE Computer Society Conference on Computer Vision and Pattern
Recognition CVPR. 1: I-326 - I-333.
Yang, W., Li, D., Zhu., L. An Improved Genetic Algorithm for Optimal Feature Subset Selection from Multi-Character Feature Set. Expert Systems With Applications. 38: 2733-2740.
YunBing Tang, Cheng Cai, FengFu Zhao (2009). Wood Identification Based on PCA, 2DPCA and (2D)2PCA. Fifth International Conference on Image and Graphics, 2009 (ICIG '09). 784-789.