Study of the SM Higgs boson in the
ZZ
channel at CMS
Giacomo Ortona1,a, on behalf of the CMS collaboration
1Università degli Studi di Torino
Abstract. On July 4th, 2012 the ATLAS and CMS collaborations announced the dis-covery of a new Higgs-like resonance at a mass of about 126 GeV. To determine if the observed resonance is compatible with a SM Higgs boson, the resonance characteris-tics (mass, couplings, spin) must be measured with high precision. The ZZ channel (H → ZZ∗ → 4l,l =e, μ) is one of the most promising channels for these measure-ments. The CMS analysis H → ZZ∗ → 4lis presented, covering its most important aspects: lepton identification, isolation variables, kinematics, event selection, and back-ground control. The talk presents the most recent CMS results on the search for the standard model Higgs boson in theZZ channel, using the full dataset recorded at the LHC fromppcollisions at centre of mass energies of 7 and 8 TeV. The properties of the new boson, such as the mass and spin, are discussed in detail.
1 Introduction
The standard model of electroweak interactions (SM) relies on the existence of a scalar particle (the Higgs boson) associated with the field responsible for the spontaneous electroweak symmetry break-ing. Since the announcement of the discovery of a new particle made on July 4th, 2012 by the CMS [1] and ATLAS [2] collaborations much effort was dedicated by both collaborations to determine the compatibility of this new particle with the long sought standard model Higgs boson using the full set of data collected in 2011 and 2012.
In CMS, theH→ZZ∗→4l, withl=e, μis a particularly good channel not only to search for the presence of a new particle, but also to study its characteristics. Despite having a rather small branching fraction when compared to other production mechanism [3], theH →ZZ∗ → 4lchannel can profit from a very clear experimental signature: a peak in the invariant mass of two pairs of opposite sign same flavour charged leptons over a small and flat background. The signal over background ratio in this channel is about a factor 2 for a Higgs boson with a mass of 126 GeV. This makes the H → ZZ∗ → 4lchannel the most sensitive channel for the search of a low mass Higgs boson available in CMS. Another important characteristic of this decay channel is that the decay topology is fully reconstructed. The precise knowledge of the mass and of the angular distributions of all the final state particles can be used to reach high sensitivity when studying the mass of the reconstructed resonance, to improve the discrimination power between signal and background, and to study the spin and the parity of the new particle.
ae-mail: ortona@to.infn.it
DOI: 10.1051/
C
Owned by the authors, published by EDP Sciences, 2014
/2 01
2 The CMS experiment
The central feature of the Compact Muon Solenoid (CMS) apparatus is a superconducting solenoid of 6 m internal diameter, providing a magnetic field of 3.8 T. Within the superconducting solenoid vol-ume are a silicon pixel and strip tracker, a lead tungstate crystal electromagnetic calorimeter (ECAL), and a brass/scintillator hadron calorimeter (HCAL). Muons are measured in gas-ionisation detectors embedded in the steel return yoke outside the solenoid. Extensive forward calorimetry complements the coverage provided by the barrel and endcap detectors.
The particle-flow event reconstruction consists in reconstructing and identifying each single par-ticle with an optimised combination of all subdetector information. The energy of electrons is deter-mined from a combination of the track momentum at the main interaction vertex, the corresponding ECAL cluster energy, and the energy sum of all bremsstrahlung photons attached to the track. The energy of muons is obtained from the corresponding track momentum.
The mass resolution forZ→e++e−decays when both electrons are in the ECAL barrel is 1.6%, and is 2.6% when both electrons are in the endcaps. The electron energies are measured by the ECAL and their directions are measured by the tracker [4].
Muons are measured in the pseudorapidity range|η|<2.4, with detection planes made using three technologies: drift tubes, cathode strip chambers, and resistive plate chambers. Matching muons to tracks measured in the silicon tracker results in a transverse momentum resolution between 1 and 5%, forpTvalues up to 1 TeV
A more detailed description can be found in [4].
3 Analysis Description
3.1 Event selection
The results presented in these proceedings have been obtained from a 5.1 fb−1dataset collected at the LHC at an energy of √s=7 TeV during 2011 and a 19.6 fb−1 √s=8 TeV dataset collected in 2012. For passing the trigger requirements events must have at least two leptons with a minimal transverse momentum of 17 (8) GeV for the leading (subleading) lepton. To increase the efficiency in the case of the 4e final state, also events with three electrons passing transverse momentum thresholds of 15, 8, and 5 GeV are selected. The trigger efficiency for events within the geometrical acceptance is greater than 98% for a Higgs boson signal with mass larger than 110 GeV.
Pairs of same flavour/opposite sign leptons are combined to buildZZpairs. Muons (electrons) are required to have pμT >5 GeV (peT >7 GeV). To further reject background, at least one of the 4 leptons must havepT > 20 GeV and a second one pT > 10 GeV. We assign the label ofZ1 to the reconstructedZclosest to the nominalZ mass, andZ2 to the other. For the candidateZZpair to be considered, we ask that 40<mZ1 <120 GeV and 12<mZ2 <120 GeV. As further requirements we also select onlyZZpairs where the invariant mass of the 4-lepton system is larger than 100 GeV and in which any opposite charge pair mass is larger than 4 GeV. Leptons can lose energy emitting final state radiation (FSR). Reconstructed isolated photons withpγT >2 GeV found in a cone of sizeΔR<0.07 from one of the selected lepton, or withpγT >4 GeV and found isolated from charged particles and energy deposits within 0.07<ΔR<0.5 from a selected lepton candidate are attached to the selected lepton to recover for FSR. Further details on the selection can be found in [5]. The overall selection efficiency is 31%, 42%, and 59% for the 4e, 2e2μ, and 4μfinal states respectively.
[GeV]
4l
m
Events / 3 GeV
0 10 20 30
100 200 400 800
Data = 126 GeV
H
m *, ZZ γ Z Z+X CMS preliminary
-1 = 8 TeV: L = 19.6 fb s
-1 = 7 TeV: L = 5.1 fb s
Figure 1: Distribution of the four-lepton reconstructed mass from the full dataset collected at √s=7 and √s = 8 TeV. Points represent the data, shaded histograms represent the background and the unshaded histogram the signal expectation for a Higgs boson withmH=126 GeV. No observed event is present abovem4l>800 GeV.
coming frombjets. Additional instrumental background arises from jets misidentified as leptons in Z+jets,Z+γ+jets, andWZ+jets events. The irreducible contribution is evaluated using Monte Carlo simulation. Data-driven techniques, based on the probability for a reconstructed secondary lepton to pass the selection requirements (tag and probe) are used to evaluate the contribution from reducible and instrumental background.
The 4-lepton invariant mass distribution obtained combining 4e, 2e2μ, and 4μfinal states is shown in figure 1, together with the expectation from SM background processes. The observed distribution is in good agreement with the expectation. The resonant peak for theZ→ 4lprocess atm4l =mZis observed with the expected normalisation and shape and provides a basic test of the accuracy of the Monte Carlo used to simulate the background processes. A clear peak is visible atm4l = 126 GeV, thus confirming the presence of the Higgs boson already announced in [1].
3.2 Event categorization
For each event, 3 different variables are built in order to perform the statistical analysis. Along-side the 4-lepton invariant mass, a second variable, the kinematic discriminantKD = P
kin 0+ Pkin
0++P kin bkg =
1+P kin
bkg(m1,m2,Ω|m4l)
Pkin
0+(m1,m2,Ω|m4l)
−1
is built from a Matrix Element Likelihood Analysis (MELA) based on the prob-ability ratio of the signal and background hypotheses given the five angles and the two (mZ1.mZ2) masses that completely define the event kinematics [6]. The same approach can be used to build a dis-criminant to separate between different signal hypotheses instead of between signal and background. Such a discriminant can be used to asses the spin and the parity of the observed Higgs boson.
Higgs boson mass [GeV]
200 400 600 800 1000
th σ / 95% σ = μ -1 10 1 10 =8 TeV s at -1 L=19.6fb ∫ =7 TeV, s at -1 L=5.0fb ∫ CMS preliminary, SM prediction median expected σ 1 ± expected σ 2 ± expected observed τ 4l+2l2 ν 2l2 2l2q
Figure 2: Combined (black points) and single-channel (purple line: 4l, green line: 2l2ν, grey line: 2l2q) ob-served and expected (red line) 95% CL upper limit on the ratio of the production cross section to the SM pectation. The expected 68% and 95% CL ranges of ex-pectation for the background-only model are also shown with green and yellow bands, respectively.
[GeV]
H
m
110 120 130 140 150 160 170 180
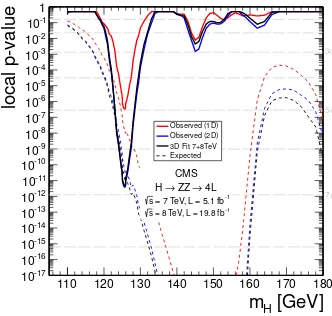
local p-value -17 10 -16 10 -15 10 -14 10 -13 10 -12 10 -11 10 -10 10 -9 10 -8 10 -7 10 -6 10 -5 10 -4 10 -3 10 -2 10 -1 10 1 CMS -1
= 7 TeV, L = 5.1 fb s
-1
= 8 TeV, L = 19.8 fb s 4L → ZZ → H σ 3 σ 5 σ 7 Observed (1D) Observed (2D) 3D Fit 7+8TeV Expected
Figure 3: Significance of the local excess with respect to the SM background expec-tation as a function of the Higgs boson mass in the mass range 110-1000 GeV. Re-sults are shown for the 1D fit (red), 2D fit (blue), and the nominal 3D fit (black). Dashed lines represent the SM expectation for a given mass Higgs boson.
together with the 4-lepton mass andKDwhen performing the fit of the results. The variable associated to category I ispjetT /m4l, while a Fisher discriminantDjet =αΔηj j+βmj jis used for the Dijet category.
This discriminant is tuned in order to separate vector boson fusion (VBF) from gluon fusion processes. In the 0/1 jet category about 5% of the signal events are expected to come from the VBF production mechanism, while this number increases to 20% in category II.
4 Results
In theH→ZZ∗→4lanalysis an unbinned maximum likelihood fit performed to the selected events is used to measure the various Higgs properties under study, such as signal and background yields, the mass of the resonance, and the spin-parity quantum numbers. Different multi-dimensional models are used depending on the specific properties of interest, as will be detailed in this section.
4.1 Searches, observation and mass
jet categories. These events are examined for 187 hypothetical SM-like Higgs boson masses in a range between 110 GeV and 1000 GeV. The significance is computed and exclusion limits are set following the statistical approach discussed in Ref. [7]. Limits are reported according to the modified frequentist construction CLs. The limit range at high mass can be extended includingZdecading into
τto improve the high mass sensitivity. With this addition theH →ZZ∗→ 4lanalysis is capable to exclude the presence of the Higgs boson from a mass of 130 GeV up to 827 GeV (expected range for SM Higgs is 113.5−778). The inclusion of other final states such as 2l2νand 2l2qallow to further extend this limit up to 1 TeV, as reported in figure 2. As shown in figure 3 the minimum of the local p-value is reached formH=125.7 GeV and the signal excess is measured to be 6.7 Gaussianσ, to be compared with an expected value of 7.2σ. When neglecting the jet categorization the 2D observed p-value is equal to 6.6σ(6.9 expected). At the same mass value the signal strength isμ=0.91+0.30
−0.24. The signal strengths in the two jet categories are measured to beμDijet =1.22+−00..8457 andμuntag =0.85+−00..3226 in category I and II respectively. The value of the signal strength modifier scale factors for the vector boson (VBF, VH) and fermion (ggH,ttH¯ ) contributions to the total cross section areμv=1.0+−22..43and
μf =0.9+−00..54. All signal strengths are compatible with the SM expectations.
To measure the mass of the observed Higgs boson, the per-event mass errors of each candidate are incorporated in the likelihood fit together with theKDand the 4-lepton mass. The dominant source of systematic uncertainty for this measurement comes from the effect on the mass scale of the lepton momentum scale which is known with limited precision. Figure 4 show the 3D likelihood scan for the three final states separately. The signal strength is left free to float in the fit. It is possible to observe that the three channels lead to compatible result among them and with the combined fit, that gives a best estimate for the Higgs boson mass ofmH=125.8±0.5(stat.)±0.2(syst.) GeV.
4.2 Spin-parity measurement
In the H → ZZ∗ → 4l the SM has been tested against six alternative spin-parity models (D0−,D0+h,D1−,D1+,Dgg2+h
m ,D qq
2+m). For each of the tested spin-parity models, a new kinematic
discrim-inant defined asDJP = c×PPSMSM+P
JP =
1+c ×Pang
JP Pang
SM
−1
is built using the MELA approach in order to discriminate between the SM and the alternative hypothesis. Thecfactor is tuned in order to adjust the relative normalisation of the probabilities. Monte Carlo simulations are used to generate 2D tem-plates ofDJPversusDbkgand the likelihood distributions for the signal and the alternative hypothesis under test. The test statisticq=−2 lnLJP
L0+ distribution is generated using Monte Carlo samples for the SM and the other six models. An example of such a distribution for theJP = 0−hypothesis, com-pared to the SM one, is shown in figure 5. A CLs criterion is defined as the ratio of the probabilities to observe a value of the test statistics q equal or larger than the one in the data under the SM or theJP hypotheses. Using this criterion, the SM is clearly favoured against all other tested hypotheses. The results for each of the six tests are reported in table 1.
It is possible to write the Higgs decay amplitude as:
A(H→ZZ)=v−1 1∗ 2∗a1gμνm2Z+a2qμqν+a3 μναβqα1q
β
2
=A1+A2+A3.
(GeV)
H
m
122 124 126 128 130 132
ln L D -2 0 1 2 3 4 5 6 7 8 9 10 Combined 4e ® ZZ ® H m 4 ® ZZ ® H m 2e2 ® ZZ ® H Combined 4e ® ZZ ® H m 4 ® ZZ ® H m 2e2 ® ZZ ® H
CMS Preliminary s=7 TeV, L=5.1 fb-1s= 8 TeV, L=19.6 fb-1
Figure 4: Scan of the negative 3D log-likelihood
−2ΔlnL versus tested SM Higgs boson mass, for each of the three channels separately and the combination of the three. Dashed line represents the scan including only statistical uncertainties.
) + 0 / L -0 ln(L × -2
-30 -20 -10 0 10 20 30
Pseudoexperiments 0 0.02 0.04 0.06 0.08 0.1
CMS preliminary s = 7 TeV, L = 5.1 fb-1 s = 8 TeV, L = 19.6 fb-1
+
0
-0
CMS data
Figure 5: Distribution of the test-statistic q =
−2 lnL0−
L0+ of the pseudoscalar boson hypothesis tested against the SM Higgs boson hypothesis. Distributions for the SM Higgs boson are repre-sented by the yellow histogram and for the al-ternative hypotheses by the blue histogram. The arrow indicates the observed value.
Table 1: List of models used in analysis of spin-parity hypotheses corresponding to the pure states of the type noted. Events for the expected separation are generated with SM expectation for the signal yield (μ=1). The observed separation quotes consistency of the observation with the 0+model orJP model, and corresponds to a scenario when the signal strength is pre-determined from the fit to data. The last column quotes CLs criterion for theJPmodel as described in the text.
JPmodel JPproduction expect (μ=1) obs. 0+ obs. JP CL s
0− gg→X 2.6σ(2.8σ) 0.5σ 3.3σ 0.16%
0+h gg→X 1.7σ(1.8σ) 0.0σ 1.7σ 8.1%
2+m gg→X 1.8σ(1.9σ) 0.8σ 2.7σ 1.5%
2+m qq→X 1.7σ(1.9σ) 1.8σ 4.0σ <0.1%
1− qq→X 2.8σ(3.1σ) 1.4σ >4.0σ <0.1% 1+ qq→X 2.3σ(2.6σ) 1.7σ >4.0σ <0.1%
5 Conclusions
The analysis of the Higgs boson decaying to a pair ofZbosons has been presented, focusing on the results with 4 leptons in the final state. A clear peak is visible above the background at a mass around 126 GeV. The significance of the observed peak is 6.7σ, above the discovery threshold in this channel alone. The ratio between the measured cross section times branching ratio and the SM expectation is
μ=0.91+0.30
cross section, obtained dividing the data sample in jet categories, are also compatible with the SM (μv =1.0+−22..43andμf =0.9+−00..54). The presence of a SM Higgs boson at a different mass is excluded up to 1 TeV. The spin-parity analysis strongly disfavour the tested pure alternative models with respect to the SM value ofJP=0+, and the fraction of CP-odd contributions is measured to be fa3=0.00+−00..2300.
References
[1] S. Chatrchyanet al.[CMS Collaboration], Phys. Lett. B716, 30 (2012) [2] G. Aadet al.[ATLAS Collaboration], Phys. Lett. B716, 1 (2012)
[3] Heinemeyer, S.et al.[LHC Higgs Cross Section Working Group] arXiv:1307.1347 (2013) [4] Chatrchyan, S.et al.[CMS Collaboration], JINST3, S08004 (2008)
[5] CMS collaboration, CMS Physics Analysis Summary HIG-13-002 (2013) [6] S. Bolognesiet al., Phys. Rev. D86095031 (2012)