FRAM for the Cherenkov Telescope Array: an update
Petr Janeˇcek1,, Jan Ebr1, Jiˇrí Blažek1, Michael Prouza1 for the CTA Consortium, Martin Mašek1, and Jiˇrí Eliášek1,2
1Institute of Physics of the Czech Academy of Sciences, Prague 2Faculty of Mathematics and Physics, Charles University, Prague
Abstract. The Cherenkov Telescope Array (CTA) is a project to build a new generation ground-based gamma-ray observatory. The FRAM – F(/Ph)otometric Robotic Atmospheric Monitor – is a device, which can provide it with the Vertical Aerosol Optical Depth (VAOD) maps in the field of view of the CTA in almost real time (delay in minutes). The FRAM is a small fast robotic astronomical telescope with a large field of view and a sensitive CCD camera. It uses stellar photometry to measure atmospheric extinction across the field of view and uses it to calculate the VAOD. In this contribution, results of first few months of operations of the prototype and outlook for deployment at the CTA site will be presented.
1 Introduction
The Cherenkov Telescope Array (CTA) will be the next generation of ground-based very high energy gamma-ray instruments [1]. To meet the strict requirements estab-lished for the precision of measurements and efficiency of use of the observation time, it is necessary to have precise knowledge of momentary atmospheric conditions, in par-ticular the presence of clouds and the aerosol content of the atmosphere. Multiple devices are proposed to be in-stalled at the CTA sites [2], one of which is a small robotic optical telescope, the "FRAM" (F(/Ph)otometric Robotic Atmospheric Monitor), which will measure the total Ver-tical Aerosol OpVer-tical Depth (integral to the edge of the at-mosphere) in the direction of the CTA field of view using stellar photometry, namely the comparison of measured apparent brightness of stars with respective catalog values [3].
The concept of the CTA FRAM builds on ten years of experience from operation of a similar device at the Pierre Auger Observatory in the Mendoza province of Ar-gentina [4] and the data analysis is directly inherited from the Auger FRAM, with modifications and extensions de-manded by the different properties of the CTA Observa-tory. In particular, the proposed mode of operation is based upon the strategy of using fast scans across a wide range of altitudes above the horizon in order to provide on-demand absolute calibration of the sensitivity of the system (as ex-pressed via the so-called zeropointZ) and precision global VAOD values simultaneously [5]. Tracking the changes of the zeropoint by virtue of those scans, VAOD maps can be produced from single images of the current CTA field of view with high temporal resolution (1 map per minute) and
e-mail: [email protected]
Full consortium author list at http://cta-observatory.org
with only intermittent interruptions (typically 1 calibration scan taking 5 minutes every 30–60 minutes)1.
A prototype of the CTA FRAM setup has been in-stalled on the grounds of the Institute of Physics in Prague in February 2016, has undergone extensive testing, dur-ing which the capabilities to operate in the proposed mode have been demonstrated, and is ready for deployment at a CTA site for preliminary characterization of atmospheric conditions at the site. In this paper we discuss the perfor-mance of this prototype and present first steps towards data products for immediate use during the CTA operation.
2 Hardware
The CTA has identified two candidate sites (one at each hemisphere) for the location of the future Observatory: the southern site near Cerro Armazones in Chile and the north-ern site at the Observatorio del Roque de los Muchachos on La Palma, one of the Canary Islands. Two FRAMs are proposed for the larger southern site (due to spatial varia-tions in weather and parallax with respect to the more dis-tant telescopes), one for the smaller northern site, all three in an identical hardware configuration which consists of a Paramount MYT mount (or similar commercial mount with the capabality to determine its absolute orientation
1The actual fequency of calibration scans that will be necessary is currently uncertain and will be determined during the preliminary opera-tion of the FRAMs on their respective locaopera-tions as it probably depends on the enviromental conditions on the sites as well as on possible future im-provements in the method. It is also worth noting that a calibration scan can fail due to presence of clouds that render the fit unreliable; in such a situation, the zeropoint will be extrapolated from previous values and the reported uncertainty on the VAOD in the CTA field of view increased accordingly. Using data from other instruments on site, in particular the all-sky cameras, may allow selection of cloud-free parts of the sky for more reliable calibration.
DOI: 10.1051/
, 01012 (2017 ) 714401012
144
EPJ Web of Conferences epjconf/201
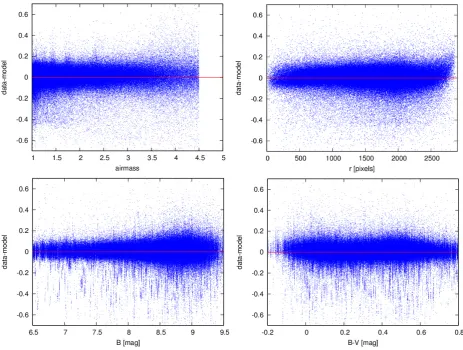
Figure 1.Residua of the global fit as a function of various variables.
after a power cut autonomously), a Zeiss 135/2.0 pho-tographic lens, a Moravian Instruments G4-16000 CCD camera with BVRI photometric filters, a custom enclosure by Elya Solutions and some auxiliary devices. The proto-type built in Prague follows the same configuration. The chosen combination of camera and lens provides field of view of 15×15 degrees, comfortably covering the whole CTA field of view even when accounting for parallax, while providing almost pin-point sharp star images across the field of view. A single 30-second exposure in the B photometric filter provides hundreds of usable stars any-where on the sky under reasonable weather conditions.
The whole system is designed for autonomous and safe operation, following our experience with the Auger FRAM, which is located on a remote unmanned location. The custom enclosure was designed in close collaboration with the Elya company. It opens and closes using a hy-draulic mechanism and includes fail-safe provisions for the case of a power cut, allowing the dome to be closed us-ing gas pressure stored in a pressure accumulator instead of electricity. Care has been taken to minimize both peak and average power consumption so that the whole system can be operated using a modest solar power plant with 1 kW of installed solar power, 144 kWh of battery capac-ity and a 2 kW 230 V AC power inverter (needed for the
operation of the hydraulic pump) for several days in case of bad weather during the day. This may prove necessary in case the system is deployed on the southern CTA site well ahead of any other infrastructure (the northern site will most likely allow for a power grid connection in any case), as planned in order to characterize the site in ad-vance.
The prototype is installed on a temporary wooden plat-form fixed into the ground using metal ground screws. This technology has proven useful and it is foreseen that it will be also used during the preliminary-characterization phase, before the FRAM is moved to its permanent con-crete foundations. During a site visit at the ORM (La Palma), we have confirmed that the screws can be success-fully used in the complicated terrain on the site.
3 Prototype data: altitude scans
The analysis of the calibration scans in altitude proceeds exactly as described in detail in [5]. Here we only remind the reader that the difference between the observed and catalog brightness of a star (in magnitudes) detected dur-ing thei-th scan is modeled with the following equation
6!/$
SCANNO
ZEROPOINT
SCANNO n¬&EB
¬!PRn¬-AY¬
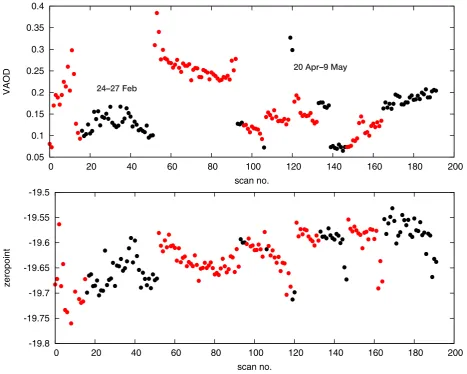
Figure 2.VAOD (upper row) and zeropoint (lower row) as a function of scan number. Consecutive points with the same color belong to the same night, but the nights are not neccessarilly consecutive. The first three nights are between 24 and 27 February, the rest between 20 April and 9 May – the very high VAOD values on 27 February are not surprising, as winter nights are mostly foggy in Prague.
where Zi is the zeropoint (calibration constant) for the scan, ki is the extinction coefficient (1.086×the vertical optical depth),Ais the airmass in units of the vertical air-mass,BandVare magnitudes of the star in the catalog in the respective filters,ris the distance of the star from the center of the respective image andM,c1,c2,R1,R2are pa-rameters of the system (optics+CCD+data reduction) and the last term represents the dependence of the extinction on the star color.
This analysis can proceed only when the scan is not affected by clouds, which is a rather rare condition in Prague, in particular in winter – we collected data in 12 nights between February and May 2016, totaling almost 200 usable scans. Fig. 1 shows the residua of the global fit over all those scans. Only stars with A < 4.5 could be used because of trees and other disturbances near the horizon. The overall RMS is 0.09, slightly larger than in the Auger FRAM data analysis (0.07). This expected as the conditions in Prague are much worse, mainly when it comes to background and parasitic light and the analysis
is not yet optimized for the different hardware setup of the CTA FRAM prototype.
Fig 2 shows the results for the zeropoint and VAOD in time series. Unlike in [5], here only an approximate Rayleigh model with black-body spectra has been used; however as the aerosol content in the urban atmosphere is rather high, this is not a significant effect. Note that the VAOD changes heavily even within a single night, but mostly in a smooth fashion. The zeropoints both drift and fluctuate. In order to obtain zeropoint for a given time within a night for which successful calibration scans are available, we fit a smooth function (quadratic in time) to the zeropoint values for each individual night. The spread of values around the fit is 0.02 mag and constitutes the main contribution to the uncertainty of the determination of VAOD maps described below. We suspect that the fluc-tuations of the zeropoint are related to thermal contraction of the lens with decreasing temperature during night, but this effects needs to be investigated more. The long-term drift of the zeropoint might be due to dust accumulation.
DOI: 10.1051/
, 01012 (2017 ) 714401012
144
EPJ Web of Conferences epjconf/201
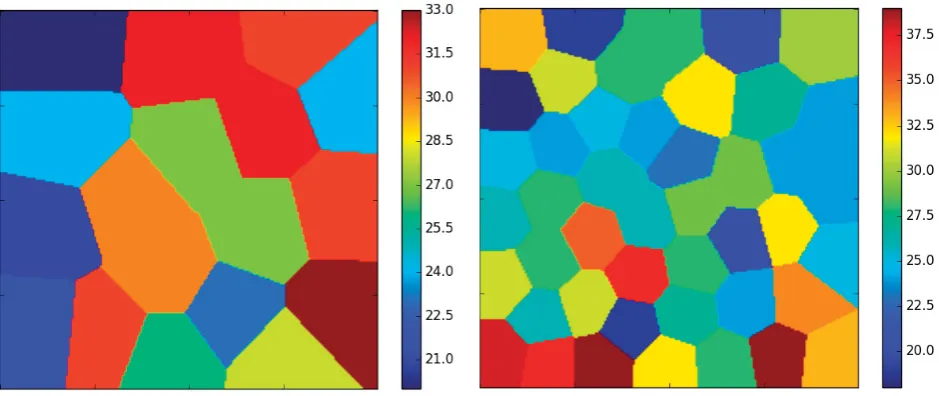
Figure 3.Examples of Voronoi tessellations for a poor (left) and rich (right) star fields. The color scale indicates the number of stars in each cell.
4 VAOD maps
For a night for which a zeropoint calibration is available, we can determine the VAOD at any point of the sky from a single image. We have taken series of images of fixed fields of view in between the altitude scans to simulate the proposed mode of operation of the FRAM within the CTA. To produce a VAOD map from an image, we must first perform 2D binning of the stars into regions, because a measurement of a single star is too imprecise. As the den-sity of stars varies greatly across the sky, this calls for an adaptive algorithm. We have chosen the so-called Voronoi relaxation which ensures that each spatial bin will con-tain betweenkand 2kstars for a chosen value ofk[6]. A Voronoi tessellation is a set of regions defined by a set of central points as areas that are closer to a given point than to any other of the points. The Voronoi relaxation algo-rithm starts with a regular grid. For each cell the center of mass of stars contained within the grid is calculated and centers of mass of all grids form a set of points that defines the first iteration of the Voronoi tesselation. Now the algo-rithm proceeds iteratively until it converges. In each step, cells with less thankstars are dropped and cells with more than 2kstars are split into two and new centers of mass are calculated. (In a real-world implementation, the procedure is slightly more complex for optimization reasons). Note that the tesselation is chosen based on the catalog, that is the stars we expected to detect in the given field of view. In the presence of small clouds (or even thick aerosols), some stars might not be detected in some parts of the field of view. In such a case, the adaptive algorithm applied to the detected sources would create large regions around these areas to compensate for the lack of stars, effectively concealing the presence of the clouds.
When the 2D bins are defined (usingk=20), we cal-culate the local VAOD as the average of
0.921minst−mmodel
A −τRayleigh (2)
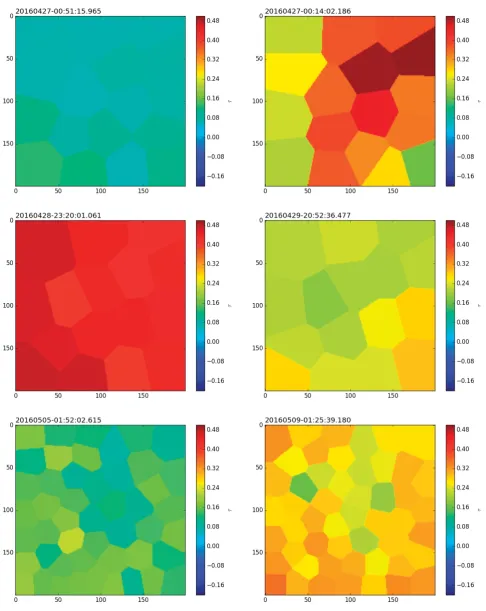
over the stars in the bin. Assuming that the RMS of the global fit reflects mainly the individual uncertainties in measured and modeled brightness of the stars, the sta-tistical uncertainty of an average over at least 20 stars is smaller than 0.02. Combined with the uncertainty in the zeropoint calibration of 0.02, the overall uncertainty of each cell in the VAOD map is roughly 0.03. This is still rather large for an absolute VAOD measurement, but when viewing sequences of such maps over time, the appearance of even thin cirrus cloud is immediately obvious. Some examples of VAOD maps are shown in Fig. 4
It should be noted that Prague serves as a worst case scenario for this measurement, because the sky is both bright and unevenly illuminated, parasitic light is om-nipresent, accessibility of the horizon and thus the lever arm in the model fit is limited and moreover, the extinc-tion is dominated by aerosols (not the Rayleigh scattering) and thus there are additional problems with the determina-tion of the dependence of the extincdetermina-tion for a single star on its color index. All of these problems will disappear once the system is deployed on a dark and clear site, such as those selected to host the CTA.
5 Summary and outlook
Figure 4.Example VAOD maps under varying weather conditions. X and y coordinates are in arbitrary units, the image plotted area corresponds to the whole 15×15 degree image. The upper left image shows very clear conditions while the upper right image shows a thin cloud, which allows the detection of most expected stars, but causes clear inhomogeneity in VAOD across the field of view. The rest of the images illustrate the various kinds of conditions encountered in Prague during the prototype operation.
DOI: 10.1051/
, 01012 (2017 ) 714401012
144
EPJ Web of Conferences epjconf/201
grateful for the support by the grants of the Ministry of Ed-ucation, Youth and Sports of the Czech Republic, projects LE13012, LG14019 and LM2015046.
References
[1] Acharya, B.S. et al. (CTA Consortium), Astroparticle Physics43, 3–18 (2013)
ods Phys. Res., Sect. A798, 172 (2015)
[5] Ebr, J. et al. (The Pierre Auger Collaboration), these proceedings (2016)
[6] Du, W., Faber, V., Gunzburger, M., SIAM Review