Study on Road Safety Index
Sunil Kumar.U 1, Gowtham. T 2, Pooja.M 3
U.G. Student, Department of Civil Engineering, Sai Vidya Institute of Technology, Rajankunte, Bengaluru, India1
U.G. Student, Department of Civil Engineering, Sai Vidya Institute of Technology, Rajankunte, Bengaluru, India2
Assistant Professor, Department of Civil Engineering, Sai Vidya Institute of Technology, Rajankunte, Bengaluru,
India3
ABSTRACT: The major cause for global deaths and injuries are mainly due to road crashes. It is worst in developing countries due to rapid and unplanned urbanisation. It was estimated in 2010 that about 1, 60,000 persons have died due to road crashes in India. Since, road safety is influenced by many factors it involves complex studies to arrive at the reasons for accidents. As a result the accident study itself remains underestimated in many of the countries especially in developing countries. In recent years several indicators are developed in order to study the factors influencing the accident and based on which the improvement measures can be adopted to reduce accident rate. In the present study three stretches were selected to validate the Road safety Index (RSI) equation and to suggest the improvements to the selected road stretches. Also an analysis was made to check if there is any improvement in the RSI value.
KEYWORDS: global deaths, indicators, Road safety Index (RSI), validation, improvements.
I. INTRODUCTION
Road safety is a multi dimensional issue. In order to improvise the safety of road it incorporates the development and management of road infrastructure, rules and regulations, law enforcement to the road users etc.,. The accident rate has increased rapidly with increase in road network, motorisation and urbanisation in the country. Worldwide, over 1.2 million people are killed in road crashes each year and 20 to 50 million are injured according World health Organisation, 2009. It means that every day around the world, more than 3000 people die from road traffic injury. WHO estimates road accidents will become the world’s third leading cause of death by the year 2020. India has a well established road network of about 33 kilometer. At the same time, India has one of the highest accident rates in the world with more than 14 accidents per thousand vehicles every year.
Table 1 describes the accident rate in India year wise
Table 1: Number of Road Accidents and Persons Involved: 2001 to 2009
Year
Number of Accidents Number of Persons Accident
Severity*
Total Fatal Killed Injured
2001 405,637 71219 (17.6) 80,888 405,216 19.9
2002 407,497 73650 (18.1) 84,674 408,711 20.8
2003 406,726 73589 (18.1) 85,998 435,122 21.1
2004 429,910 79357 (18.5) 92,618 464,521 21.5
2005 439,255 83491(19.0) 94,968 465,282 21.6
2006 460,920 93917(20.4) 105,749 496,481 22.9
2007 479,216 101161(21.1) 114,444 513,340 23.8
2008 484,704 106591(22.0) 119,860 523,193 24.7
2009 486,384 110993(22.8) 125,660 515,458 25.8
Figures within parenthesis indicate share of fatal accidents (i.e. involving death) to total accidents. * Accident Severity : No. of Persons Killed per 100 Accidents
II. BENGALURU ACCIDENT SCENARIO
In Bengaluru city, there is a tremendous increase in the population. the population in Bengaluru was around 1.59 lakhs in the year 1901, there was an increase in population to 65.37 lakhs in the year 2001, and the population has shoot up to 88.59 in the year 2011.
Bengaluru is branded as “Silicon Valley of India” as most of the Information technology industries are based in Bengaluru. It has witnessed a drastic growth on the radial and circumferential pattern due to increase in population since last two decades due to industrialisation. In 1901, the city spread area was 28.85 sq km. In 2001 the area was spread to 451.08 sq km. In 2011 the growth is 1309 sq km.
Due to increase the population and standard of living of the people there has been increase in the number of vehicles in the city. Bengaluru is one of the accident prone cities in India.
Table 2 Describes the total number of accidents occurred in Bangalore from 2003- 2010
Table 2: Year wise Total number of accidents for Bengaluru
Sl. No. Year Fatal Killed Non-Fatal Injured Total
1 2003 843 883 9662 7980 10505
2 2004 875 903 8226 6921 9101
3 2005 796 836 6782 5899 7578
4 2006 880 915 6681 6048 7561
5 2007 957 981 7469 6591 8426
6 2008 864 892 6908 6150 7772
7 2009 737 761 6138 5668 6875
8 2010 816 858 5667 5343 6483
Source: Transport Department GOK, Bengaluru Traffic Police
III.ROAD SAFETY INDEX
Since road accidents are due to several factors, study on the same involves many parameters which have its own significance in arriving at the road safety index. Certain indicators and indexes are being developed in the recent years
.
Although the aspect of road safety is the aim of any design process, it does not cover all the requirements to ensure accident free section in any road network.Road safety audit is a formal procedure for assessing accident potential and safety performance in the provision of new schemes, the improvement and rehabilitation of existing roads and in the maintenance of existing roads. The road safety audit, when used for applications on existing roads, is more appropriately termed as Road Safety Index (RSI). RSI is a proven and highly cost effective process that assists with the production of safer roads. It should become a part of road design process in most of the road authorities in developed countries.
IV.RELATEDWORK
An attempt was made by Prof. M.N. Sreehari and his team to develop a methodology to aggregate all the road safety parameters on to a common based scale by developing value score charts, after interviewing 100 traffic engineering experts in the country.
Many factors influence the rate of the accidents either separately or jointly. In his study, various factors affecting the causes of the accidents were identified and studied in detail.
• Pavement Characteristics • Miscellaneous Characteristics
Out of several engineering factors identified, certain important quantifiable parameters were measured and aggregated to a common base scale.
The unbiased responses from the field experts were collected based on the scientific questionnaire. Each of the sixteen parameters was rated on 100 based on their crucial role played in case of accidents. Rating on a scale from 0 to 100, 100 depicts the safest condition of the road and hence presumed to be the best, whereas, assigning 0 for a particular parameter implies the worst condition of the road. Thus the responses were gathered to develop the trend charts.
Likewise, the responses for the relative weightage needed for the five main factors were collected from the same hundred traffic engineering experts and field engineers, on the scale of 0 to 100. The 100 responses obtained were averaged to get the relative weightage. The relative weightages of the five main factors which governs the Road Safety Index is as listed below.
• Roadway Characteristics-0.34 • Traffic Characteristics-0.26 • Roadside Characteristics-0.18 • Pavement Characteristics-0.13 • Miscellaneous Characteristics-0.09
Based on the scientific questionnaire, the value scores were given by the experts. These value scores were used for preparing the charts. (Road safety and traffic engineering experts, number in 100 are interviewed) Based on these value scores, trend charts were developed. These charts act as ready reckoner to arrive at the value scores of the parameters under study.
Gradation of roads based on Road Safety Index
The roads were classified based on their safety conditions. In his work, the gradation of the road depends on the Road Safety Index (RSI) obtained from the RSI equation. Accordingly, the road is graded as Excellent, Very Good, Good/Average, Poor and Very Poor.
The gradation of road based on the level of service offered is shown in the Table 3.
Table 3: Gradation of roads based on RSI
RSI in % Level of Service
0.80-1.00 Excellent
0.60-0.80 Very Good
0.40-0.60 Good/Average
0.20-0.40 Poor
0.00-0.20 Very poor
‘Vei’ is the value score for ith service characteristics of the existing situation ‘Vsi’ is the value scores for ith service characteristics.
V. PRESENTSTUDY
The main objectives of the present study are to validate the Road safety Index. Five road sections were selected for validation of RSI equation. Based on road safety inspections and to measure safety index for different type of roads in Bengaluru, the following roads were selected. The selected stretch of roads measured 1km.
• Sadhashivanagar road
• Marasandra road
• Sir MVIT road
In the present study the parameters as suggested in the development of RSI equation such as carriageway width, number of curves, gradient, number of intersections, type of intersections etc., are evaluated. For the same parameters the valued scores are applied by making use of the charts and the average values are obtained. Based on the average values obtained for different characteristics the RSI value is obtained using the equation as mentioned above. Based on the RSI value the road is categorised from excellent to very poor.
Case study 1: Sadashivnagar road
Table 4 describes the roadway characteristics of Sadashivanagar road stretch and the valued scores obtained as per the recommendations of the experts and the average scores are obtained.
Table 4: Study on Roadway characteristic of Sadashivnagar road stretch
Roadway characteristic
Parameters Observed data Valued scores Average values
Carriageway width 4 lane with median 100
73.00
Number of curves 2 70
Gradient Flat 80
Number of intersections/km 2 75
Type of intersection Perfect right angle 40
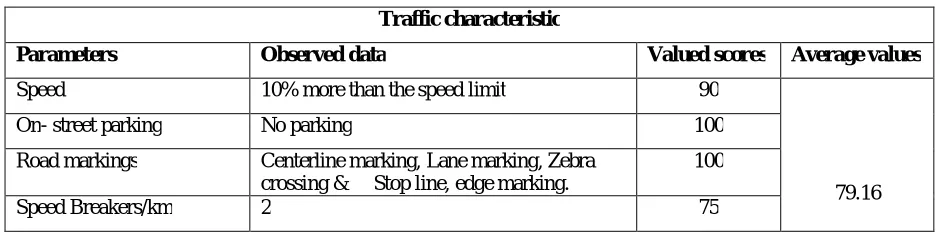
Table 5 describes the Traffic characteristics of Sadashivanagar road stretch and the valued scores obtained as per the recommendations of the experts and the average scores are obtained.
Table 5: Study on Traffic characteristic of Sadashivnagar road stretch
Traffic characteristic
Parameters Observed data Valued scores Average values
Speed 10% more than the speed limit 90
79.16
On- street parking No parking 100
Road markings Centerline marking, Lane marking, Zebra crossing & Stop line, edge marking.
100
Number of Fatalities/km Serious Injury 50
Signs No adequate signs 60
Table 6 describes the Roadside characteristics of Sadashivanagar road stretch and the valued scores obtained as per the recommendations of the experts and the average scores are obtained.
Table 6: Study on Roadside characteristic of Sadashivnagar road stretch
Roadside characteristic
Parameters Observed data Valued scores Average values
Presence of Obstacles Advertisement Board, trees, distracting road users 40
51.66
Shoulder With average kerbs and levelled 60
Street Lighting Interval 20m 55
Table 7 describes the pavement characteristics of Sadashivanagar road stretch and the valued scores obtained as per the recommendations of the experts and the average scores are obtained.
Table 7: Study on Pavement characteristic of Sadashivnagar road stretch
Pavement characteristic
Parameters Observed data Valued scores Average values
Pavement status Average 40
65.00
Potholes/km 4 70
Table 8 describes the Miscellaneous characteristics of Sadashivanagar road stretch and the valued scores obtained as per the recommendations of the experts and the average scores are obtained.
Table 8: Study on Miscellaneous characteristic of Sadashivnagar road stretch
Miscellaneous characteristic
Parameters Observed data Valued scores Average values
Bus-stop distance from Intersection 120m 100
78.75
Intersection visibility Very Good 80
Presence of median Median of 30 cm height 35
RSI= 0.7
Case 2: Marasandra road
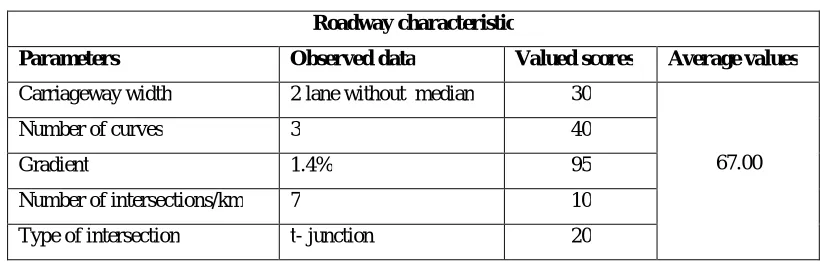
Table 9 describes the roadway characteristics of Marasandra road stretch and the valued scores obtained as per the recommendations of the experts and the average scores are obtained.
Table 9: Study on Roadway characteristic of Marasandra road stretch
Roadway characteristic
Parameters Observed data Valued scores Average values
Carriageway width 2 lane without median 30
67.00
Number of curves 3 40
Gradient 1.4% 95
Number of intersections/km 7 10
Type of intersection t- junction 20
Table 10 describes the Traffic characteristics of Marasandra road stretch and the valued scores obtained as per the recommendations of the experts and the average scores are obtained.
Table 10: Study on Traffic characteristic of Marasandra road stretch
Traffic characteristic
Parameters Observed data Valued scores Average values
Speed 35% more than speed limit 30
76.33
On- street parking No parking 95
Road markings No marking. 00
Speed Breakers/km 1 90
Number of Fatalities/km Property damage 40
Signs No adequate signs 60
Table 11 describes the roadside characteristics of Marasandra road stretch and the valued scores obtained as per the recommendations of the experts and the average scores are obtained.
Table 11: Study on Roadside characteristic of Marasandra road stretch
Roadside characteristic
Parameters Observed data Valued scores Average values
Presence of Obstacles No 00
00
Shoulder Not adequate 00
Table 12 describes the Pavement characteristics of Marasandra road stretch and the valued scores obtained as per the recommendations of the experts and the average scores are obtained.
Table 12: Study on Pavement characteristic of Marasandra road stretch
Pavement characteristic
Parameters Observed data Valued scores Average values
Pavement status Poor 20 87.50
Potholes/km 4 80
Table 13 describes the miscellaneous characteristics of Marasandra road stretch and the valued scores obtained as per the recommendations of the experts and the average scores are obtained.
Table 13: Study on Miscellaneous characteristic of Marasandra road stretch
Miscellaneous characteristic
Parameters Observed data Valued scores Average values
Bus-stop distance from
Intersection
10m 20
6.67
Intersection visibility Poor 00
Presence of median No Median 00
RSI= 0.34
We can see that the obtained RSI lies within a range of 0.2 to 0.4, and hence the road is graded as poor
Case 3: Sir MVIT road
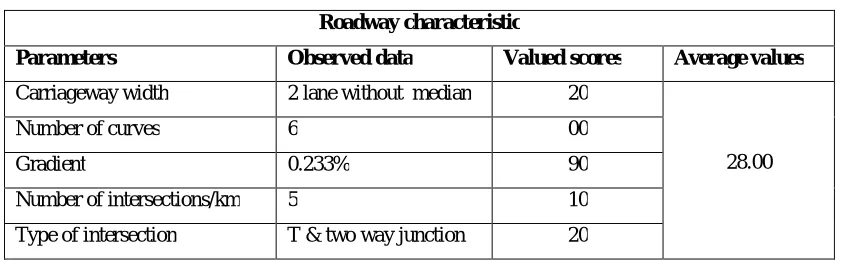
Table 14 describes the roadway characteristics of Sir MVIT road stretch and the valued scores obtained as per the recommendations of the experts and the average scores are obtained.
Table 14: Study on Roadway characteristic of Sir MVIT road stretch
Roadway characteristic
Parameters Observed data Valued scores Average values
Carriageway width 2 lane without median 20
28.00
Number of curves 6 00
Gradient 0.233% 90
Number of intersections/km 5 10
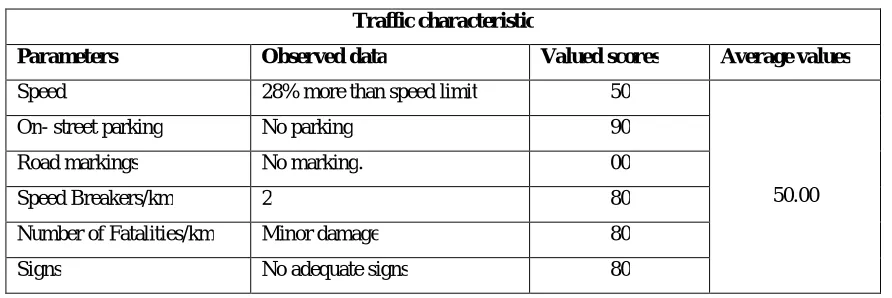
Table 15 describes the Traffic characteristics of Sir MVIT road stretch and the valued scores obtained as per the recommendations of the experts and the average scores are obtained.
Table 15: Study on Traffic characteristic of Sir MVIT road stretch
Traffic characteristic
Parameters Observed data Valued scores Average values
Speed 28% more than speed limit 50
50.00
On- street parking No parking 90
Road markings No marking. 00
Speed Breakers/km 2 80
Number of Fatalities/km Minor damage 80
Signs No adequate signs 80
Table 16 describes the roadside characteristics of Sir MVIT road stretch and the valued scores obtained as per the recommendations of the experts and the average scores are obtained.
Table 16: Study on Roadside characteristic of Sir MVIT road stretch
Roadside characteristic
Parameters Observed data Valued scores Average values
Presence of Obstacles No 00
00
Shoulder not adequate 00
Street Lighting Interval No Lighting 00
Table 17 describes the Pavement characteristics of Sir MVIT road stretch and the valued scores obtained as per the recommendations of the experts and the average scores are obtained.
Table 17: Study on pavement characteristic of Sir MVIT road stretch
Pavement characteristic
Parameters Observed data Valued scores Average values
Pavement status Poor 20
55.00
Potholes/km 4 90
Table 18: Study on Miscellaneous characteristic of Sir MVIT road stretch
Miscellaneous characteristic
Parameters Observed data Valued scores Average values
Bus-stop distance from Intersection 20m 30
23.33
Intersection visibility Fair 40
Presence of median No 00
RSI= 0.35
We can see that the obtained RSI lies within a range of 0.2 to 0.4, and hence the road is graded as poor
Based on the studies conducted on the selected stretches it was observed that the safety index varies from poor to good condition. Some suggestions are made to the existing condition and studies are conducted to check the improvement in the RSI value.
• SADHASHIVANAGAR Road
Table 19 describes the improvement suggested for Sadashivanagar road stretch and the valued scores obtained as per the recommendations of the experts and the average scores are obtained.
Table 19: Improvement suggested to Sadashivnagar Road
Improvement suggested Improved RSI Valued score
Traffic characteristics
By installing adequate signs 100 85.83
Roadside characteristics
By constructing Footpath 100
78.33
By removal of obstacles 80
Pavement characteristics
By providing overlay 100 85
Miscellaneous characteristics
By improving the median 100 95
Improved RSI = 0.8 Very Good to Excellent
• Marasandra Road
Table 20 describes the improvement suggested for Marasandra road stretch and the valued scores obtained as per the recommendations of the experts and the average scores are obtained.
Table 20: Improvement suggested to Marasandra Road
Improvement suggested Improved RSI Valued score
Traffic characteristics
By installing adequate signs 100
70
Provide speed breakers 60
Provide road markings 95
Roadside characteristics
Miscellaneous characteristics
By construction of the median 100
63.33 Shifting bus stop location 90
Improved RSI = 0.52 Poor to good
• Sir MVIT Road
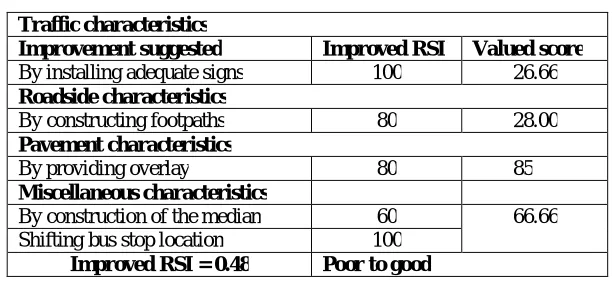
Table 21 describes the improvement suggested for Sir MVIT road stretch and the valued scores obtained as per the recommendations of the experts and the average scores are obtained.
Table 21: Improvement suggested to Sir MVIT Road
Traffic characteristics
Improvement suggested Improved RSI Valued score
By installing adequate signs 100 26.66 Roadside characteristics
By constructing footpaths 80 28.00 Pavement characteristics
By providing overlay 80 85
Miscellaneous characteristics
By construction of the median 60 66.66 Shifting bus stop location 100
Improved RSI = 0.48 Poor to good
VI.EXPERIMENTAL RESULTS
The RSI value for the selected stretches ranges between 0 and 1. The higher values indicate higher levels of safety for that road. The lower values indicate the worst performance of the road in terms of road safety level. The target value of RSI is 1 and it shows how far the road has to be developed to ensure safety. This direct and simple ranking is quite useful to policy makers and ordinary people since it will show the scale of the problem clearly and easily
.
VII. CONCLUSION
The experimental model developed by Prof. M.N Sreehari to analyse the road safety by aggregating several parameters on to a common based charts is one of the simple tool to measure the RSI and correlate the same to the level of service at which the road is catering as regard to safety. The RSI model developed is validated by analysing the parameters considered in developing the model on the selected stretches, also the suggestion have been made to improve the RSI value of the existing road condition.
VIII. ACKNOWLEDGEMENT
First of all, we would like to thank the almighty for being our strength. We are very much proud and grateful to our parents, my guiding Professors, my HOD and to all my non teaching staff for their continuous inuts and constant support in every action of preparing this research work. Also, we would like to thank Prof. M.N. Sreehari for sharing his valuable work without which this work would be meaningless.
REFERENCES
[1] WHO (2009), “Global Status Report on Road Safety: Time for Action”.
[3] Al-Haji, G., (2001) "Traffic Safety in Developing Countries- New Approaches in Technology Transfer by Using Distance Education Technique", Linköping University, Sweden.
[4] Asp Kenneth et al (1998), "Urban transport in a Road safety perspective", Sida Publications, Sweden.
[5] MoRTH, (2009)"Road Accidents in India”.
[6] NIMHANS (2008), "Road Traffic Injury", BISP Fact Sheets.
[7] Peden, M., Scurfield, R., Sleet, D., Mohan, D., Hyder, A.A., Jarawan, E. & Mathers, C. (2004).“World report on road traffic injury prevention”. World Health Organization WHO, Geneva.
[8] Al-Haji, G. (2003). “Road Safety Development Index”. Presented at 16th ICTCT Workshop, Soesterberg.
[9] Hermans, E., Van der Bossche, F. & Wets, G. (2008). “Combining road safety information in a performance index in Accident Analysis and Prevention”, vol. 40, p.1337-1344.
[10] Hakkert, A.S, Gitelman, V. & Vis, M.A. (eds.) (2007). “Road safety performance indicators: Theory”. Deliverable D3.6 of the EU FP6 project Safety Net. European Commission, Brussels.
BIOGRAPHY
Mr. Sunil Kumar. U is an under graduate student studying 8th semester, B.E. Civil Engineering in Sai Vidya Institute of Technology. His area of interest lies in the study of highway and traffic design and maintenance. Also, he is a sportsman and has represented the college in many events and has won many awards and prizes.
Mr. Gowtham. T is an under graduate student studying 8th semester, B.E. Civil Engineering in Sai Vidya Institute of Technology. His area of interest lies in the study of highway safety, design and maintenance.