ISSN: 2319-8753
I
nternational
J
ournal of
I
nnovative
R
esearch in
S
cience,
E
ngineering and
T
echnology
(An ISO 3297: 2007 Certified Organization)
Vol. 2, Issue 12, December 2013
Copyright to IJIRSET www.ijirset.com 7809
Exploring Nexus between Urbanization Growth and
Environment: with Reference to South Asian Countries
A.D.Gade
1, Dr.V.P.Katti
2, R.A.Todkar
3AssistantProfessor, Department of Geography, D.R.Mane College Kagal1
Assistant Professor, Department of Economics , Shivaji university Kolhapur2
Research Student Department of Economics, Shivaji University Kolhapur3
Abstract: The nexus between, urbanization, economic growth and environmental quality has been a source of great controversy for a very long time. There are two extreme views regarding this nexus. The first view demonstrates that rapid urbanisation and modernisation lead to expansion of economic activity. This greater economic activity or economic growth is inevitably leads to environmental degradation and consequently economic and ecological collapse. The second extreme approach has been demonstrates the view that those environmental problems worth solving will be addressed more or less automatically as a consequence of economic growth and modern urbanisation. This debate has still prolonged because of lack of substantial empirical evidence on how environmental quality changes at different income levels and at different level of urbanisations. Compilation of such evidence has been constrained by the absence of data for a large number of countries. At present, the situation is much improved and this paper takes a step of systematic analysis in exploring these nexus by using Log-linear, Log–lin and Lin-log models. Since it is very complex phenomenon, theoretically it is quite difficult to explore this nexus .However it is not impossible even though there are some problems exist like intercept value of variables and identification of dependent and independent variables. By considering available data of different indicators (from period 2001 to 2010) and with the help of econometric models an honest attempt is being made towards the exploring this casual nexus. Especially South Asian countries were considered for study and it arrived at conclusion that there is positive nexus between urbanisation and economic growth and on the contrary negative linkages are found between economic growth and environmental quality.
Keywords: Urbanization, GDP, GDP Per Capita, Improved Sanitation, Forest Depletion, Economic Growth, Environmental Degradation.
JEL: R00, R23,R15, Q25,O4,O47, O44
I. INTRODUCTION
ISSN: 2319-8753
I
nternational
J
ournal of
I
nnovative
R
esearch in
S
cience,
E
ngineering and
T
echnology
(An ISO 3297: 2007 Certified Organization)
Vol. 2, Issue 12, December 2013
Copyright to IJIRSET www.ijirset.com
7810
conducted on the issue of urbanization, economic growth and environment nexus. Under this backdrop it is necessary to explore this spiral nexus in order to better management, planning and administration of the urban environment.
The nexus between, urbanization economic growth and environmental quality has been a source of great controversy for a very long time. There are two extreme views regarding the is nexus. The first view has been demonstrates that rapid urbanisation and modernisation lead to expansion of greater economic activity. This greater economic activity or economic growth is inevitably lead to environmental degradation and consequently in economic and ecological collapse. The second extreme approach has been demonstrates the view that those environmental problems worth solving will be addressed more
or less automatically as a consequence of economic growth and modern urbanisation.
This debate has still prolonged because of lack of substantial empirical evidence on how environmental quality changes at different income levels and at different level of urbanisations. Compilation of such evidence has been constrained by the absence of data for a large number of countries. At present the situation is much improved and this paper takes a step of systematic analysis in exploring these nexus by using available data. In order to make the study more intensive three basic models are used e.g. Log-linear, Lin –log and Log-lin. Since it is very complex phenomenon, theoretically it is quite difficult to explore this nexus .However it is not impossible even though there are some problems like intercept value of variables and identification of dependent and independent variables. By considering available data of different indicators (from period 2001 to 2010) and with the help of econometric models an honest attempt is being made toward the exploring this casual nexus. Especially South Asian countries were considered for study.
II. OBJECTIVES OF THE STUDY
The major objectives of the present research work are as below.
1. To observe the nexus between urbanization and economic growth,
2. To examine the nexus between urbanization and environment,
3. To explore the nexus between environment and economic growth.
III. RESEARCH METHODOLOGY
A) DATA SOURCE AND DATA COLLECTION
The present research is purely analytical type of research which exclusively relies on secondary data. The necessary data has been collected from the report of the World Bank. The collected data has been processed and tabulated by using Excel Software. The statistical tools such as , multiple correlation, log- linear regression equations are applied for data analysis and interpretation. The present paper has considered ten years period from 2001-02 to 2010-11 and attempts were made to examine the coiled nexus between urbanization, economic growth and environment quality in context of South Asian countries namely Afghanistan, Bangladesh, Bhutan, India, Iran, Maldives, Nepal, Pakistan and Sri Lanka. In case of absences of some indicators of time series data the panel data has been used.
B) HYPOTHESIS
Following hypothesis have been formulated.
1. The significant positive correlation prevails between economic growth and urbanization. 2. There significant positive correlation exists between economic growth and level of pollution. 3. There is significant negative nexus between urbanization and environment quality.
C) REVIEW OF RESEARCH LITRATURE
ISSN: 2319-8753
I
nternational
J
ournal of
I
nnovative
R
esearch in
S
cience,
E
ngineering and
T
echnology
(An ISO 3297: 2007 Certified Organization)
Vol. 2, Issue 12, December 2013
Copyright to IJIRSET www.ijirset.com
7811
between urbanization and economic growth is weak at least in recent times, and as such does not foster growth of region‟s economies.
Generally, there is exercised enormous control of cities over national economies. They provide jobs, access to the best cultural, educational and health facilities and they act as focal point for communication and transport which are necessary conditions for economic development of any nation. Although they also cluster massive demand for energy, generate large quantities of waste and concentrate pollution as well as social adversity. According to Todaro and Smith (2003), there is a close association between urbanization and per capita income. Including other economic development indicators it is one of the most observable and sticking fact to development process. According to Quigley,(2007),the economic and social crises that have enveloped most of the developing countries are as a result of urban growth without proportional economic development. To Quigley (2007), urbanization on one hand is destructive, while on the other, it is the base for development process of any region.
The relationship between urbanization has long popular issue of debate in the literature of economic development. Should a developing country encourage urbanization as a part of economic development strategy? Or is high rate of urbanization just necessary condition for economic growth? According to Rakodi (2004), cities of developing countries are faced with the challenges of rapid population increase with unaccompanied economic growth. The foregoing analysis clearly reveals that there is clear cut nexus between urbanization and economic development but the literature has not covered impact of urbanisation on the environment.
Recently the United Nation published “World Urbanization Prospects (2009)” and pointed out that 2010 is the break-even year of the world urban rural population. By the middle of 2009, the number of people living in urban areas (3.42 billion) had surpassed the number living in rural areas (3.41 billion) and since then the world has become more urban than rural. It is also stated that the growth rate of urbanisation in developing countries is more than developed countries.
IV. THEROTICAL MODEL Economic growth and Environment Quality
According to Environmental Kuznet Curve there is invert U-shaped relationship between economic growth and environmental degradation. That is with the increase in economic growth, environmental degradation also goes on increasing and this process to be continue up to the potential or maximum economic growth level and then afterword it is not possible to further increase in economic growth with deteriorated natural resources. After this maximum growth every attempt of accelerating economic growth hampers natural resources without further increase in economic growth. In present study the same model has been tried to test empirically in context of above mentioned nine Asian Countries. The basic log linear models applied to explore the shape of the relationship between income and each environmental indicator.
ln E it = a0 + a1ln Yit + a2Tt+a3Fieit (1)
Where E, is an indicator of environmental quality for country i at time t, Y is per capita income (Growth parameter), T is a time trend, F is the fixed effect for site-specific factors, and e is a stochastic error term (that any other random factor which affects on environment quality). Per capita income was defined in purchasing power parity terms. All variables are in logarithms unless otherwise specified in the data table.
For the measurement of slope we have, Slope= 𝑑𝑦
𝑑𝑥 = β2 ( 𝑦
𝑥)
for elasticity 𝑑𝑦
𝑑𝑥 𝑥
𝑦= β2 has been used.
Economic growth and urbanization
For the measurement of nexus between these two variables Log-lin model were used because it is very difficult to identify which is the dependent variable and which one is independent.
Therefore,
ISSN: 2319-8753
I
nternational
J
ournal of
I
nnovative
R
esearch in
S
cience,
E
ngineering and
T
echnology
(An ISO 3297: 2007 Certified Organization)
Vol. 2, Issue 12, December 2013
Copyright to IJIRSET www.ijirset.com
7812
Where Y, is per capita income level (growth parameter) of a country i at time t, t is a time trend, X is a level of urbanization of a country i at time t, and e is a stochastic error term (that is any other random factor which affects on economic growth (Y)). Per capita income was defined in purchasing power parity terms. All variables are in logarithms unless otherwise
specified in the data table. For the measurement of slope ( 𝑑𝑦
𝑑𝑥 ) =β2(Y) and for elasticity i.e 𝑑𝑦 𝑑𝑥
𝑥
𝑦 =β2(X) has been used.
Urbanization and environment quality
For the measurement of nexus between these two variables Lin-log model were used. Therefore, we have
Yit =β1+ β2 ln Xt+β3+eit (3)
Where Y, is environment quality (environment parameter) of a country i at time t, X is a level of urbanization of a country i at time t, and e is a stochastic error term (that is any other random factor which affects on environment quality (Y)).While
processing the data, logarithms of all variables has been taken. For the measurement of slope ( 𝑑𝑦
𝑑𝑥 ) =β( 1
𝑥)and for elasticity
i.e 𝑑𝑦
𝑑𝑥 𝑥
𝑦 =β2 ( 1
𝑦 ) has been used.
V. RESULTS OF THE STUDY
The major findings of the study are as below
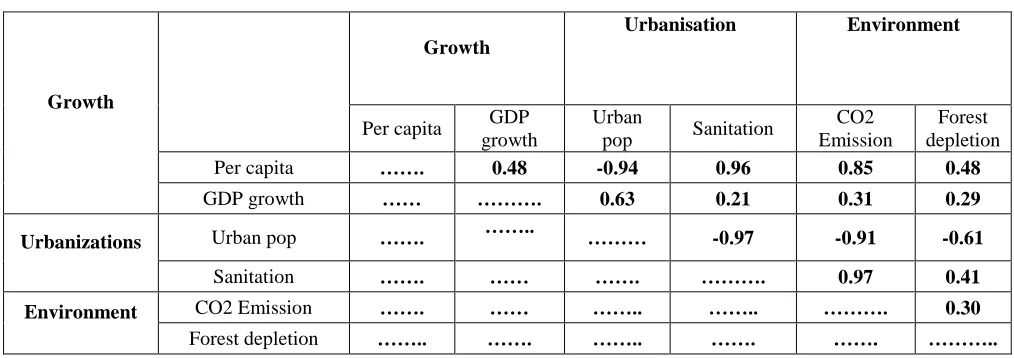
Correlation Results
1) The economic growth and declining environment quality are strongly and positively correlated.
2) It has also seen from foregoing analysis that economic growth and rate of urbanization are also positively
correlated.
3) Urbanization and environment are negatively and significantly correlated.
Table No1. Correlation Matrix
Growth
Growth
Urbanisation Environment
Per capita GDP
growth
Urban
pop Sanitation
CO2 Emission
Forest depletion
Per capita ……. 0.48 -0.94 0.96 0.85 0.48
GDP growth …… ………. 0.63 0.21 0.31 0.29
Urbanizations Urban pop ……. …….. ……… -0.97 -0.91 -0.61
Sanitation ……. …… ……. ………. 0.97 0.41
Environment CO2 Emission ……. …… …….. …….. ………. 0.30
ISSN: 2319-8753
I
nternational
J
ournal of
I
nnovative
R
esearch in
S
cience,
E
ngineering and
T
echnology
(An ISO 3297: 2007 Certified Organization)
Vol. 2, Issue 12, December 2013
Copyright to IJIRSET www.ijirset.com
7813
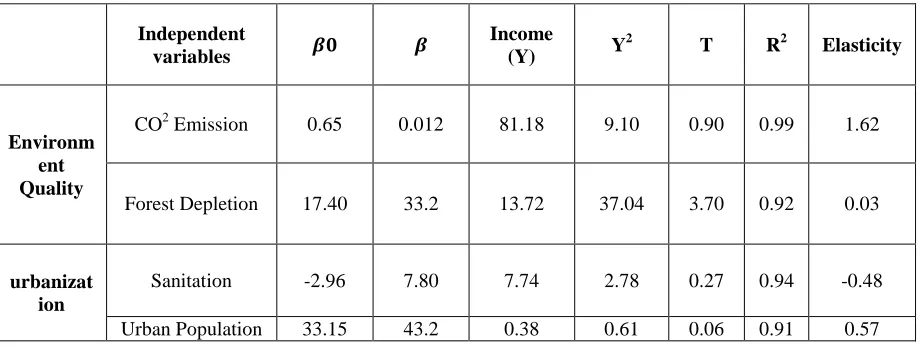
Table 2. Regression Results
Regression Results
1) Regression results revels that at with the increase in per capita income level, environment quality goes to decline.
2) As a consequence of economic growth rapid CO2 emission has been taken place in south Asian countries and
one percent change in income level will leads to 1.65 percent change in CO2 emission. That has been proved by
the regression table.
3) Income elasticity of urban sanitation is -0.48, whereas in case of urban population it is 0.57.
4) All the indicators are very strongly good fitness to the regression line (R2).
REFERENCES
1. Allen. J. and Barnes, D, 'The Causes of Deforestation in Developing Countries', Annals of the Association of American Geographers,Vol. No.2 pp 75,(1995).
2. Davis, S. 'Indigenous Views of Land and the Environment', World Bank Working Paper, Washington, D.C. (1992).
3. Diwan, I. and Shafik, N. 'Investment, Technology and the Global Environment: Towards International Agreement in a World of Disparities', (1992)
4. P. Low and R. Safadi (eds), Trade Policy and the Environment, The World Bank, Washington, D.C. (1992).
5. Grossman, G. and Kruger, A.. 'Environmental Impacts of a North American Free Agreement', in P. Gabor (ed.), The US-Mexico Free Trade Agreement, MIT Press, Cambridge, MA. (1993).
6. Holtz-Eakin, D. and Seldon, T.. 'Stoking the Fires? CO2 Emissions and Economic Growth', Mimeograph, Syracuse University, Syracuse, NY. (1992).
7. Johnon, B. Responding to Tropical Deforestation. An Eruption of Crisis and Array of Solutions, Conservation Foundation, London; World Wildlife Fund, Washington, D.C. (1991).
8. Kneese, A. V. and Sweeney , J. Handbook of Natural Resource and Energy Economics, North-Holland, Amsterdam(1985)..
9. Seldon, T. and Song, D. 'Environmental Quality and Development: Is there a Kuzuets Curve for Air Pollution?', Mimeograph, Syracuse University, Syracuse, NY. . (1992).
10. World Bank 'The Forest Sector: A World Bank Policy Paper', Washington, D.C. (1991).
11. Neamt, S. Economic Development and Environment Quality: an Econometric Analysis‟ The World Bank, 1818 The H Street NW, Washington, DC 20433, USA(1994),„
12. World Bank-World Data Bank, World Development Report 2010.
13. Fay, M. and Opel, C.Urbanization without Growth: a not so Uncommon Phenomenon, Working Paper, World Bank, Washington DC(2000). 13. Polese, N.Cites and National Economic Growth: A Reappraisal. Routledge Taylor & Francis Group. Urban Studies, 42, 8(2005)
Independent
variables 𝜷𝟎 𝜷
Income
(Y) Y
2 T R2 Elasticity
Environm ent Quality
CO2 Emission 0.65 0.012 81.18 9.10 0.90 0.99 1.62
Forest Depletion 17.40 33.2 13.72 37.04 3.70 0.92 0.03
urbanizat ion
Sanitation -2.96 7.80 7.74 2.78 0.27 0.94 -0.48
ISSN: 2319-8753
I
nternational
J
ournal of
I
nnovative
R
esearch in
S
cience,
E
ngineering and
T
echnology
(An ISO 3297: 2007 Certified Organization)
Vol. 2, Issue 12, December 2013
Copyright to IJIRSET www.ijirset.com
7814
Annexe. 1
Source: World Bank, Report 2010
Source: World Bank, Report 2011
GDP Growth Rate
Country 2001 2002 2003 2004 2005 2006 2007 2008 2009 2010
Afghanistan NA NA 8.44 1.05 11.17 5.55 13.74 3.61 21.02 8.43
Bangladesh 3.44 2.68 3.6 4.72 4.54 5.35 5.27 5.1 4.64 4.93
Bhutan 8.2 10.72 7.66 5.89 7.12 6.84 17.92 4.66 6.72 11.67
India 4.94 3.9 7.94 7.84 9.28 9.26 9.8 3.89 8.47 10.54
Iran 3.66 7.51 7.11 5.08 4.62 5.89 7.82 2.3 1.8 NA
Maldives NA 6.09 14.15 12.48 -8.67 19.58 10.55 12.19 -3.63 7.05
Nepal 4.79 0.12 3.94 4.68 3.47 3.35 3.41 6.1 4.53 4.81
Pakistan 1.98 3.22 4.84 7.36 7.66 6.17 5.68 1.59 3.59 3.54
Sri-Lanka -1.54 3.96 5.94 5.44 6.24 7.66 6.79 5.95 3.53 8.01
Growth Rate of urban population
Country 2001 2002 2003 2004 2005 2006 2007 2008 2009 2010
Afghanistan NA NA 5.25 5.03 4.64 4.28 3.98 3.76 3.65 3.63
Bangladesh NA NA 3.24 3.09 2.94 2.95 2.8 2.71 2.69 2.71
Bhutan NA NA 6.88 6.58 6.22 4.74 4.34 4.19 4.04 3.96
India NA NA 2.67 2.61 2.55 2.57 2.51 2.64 2.42 2.39
Iran NA NA 2.26 2.21 2.2 1.57 1.57 1.58 1.6 1.64
Maldives NA NA 5.63 5.47 5.36 5.38 5.27 5.18 5.11 5.04
Nepal NA NA 4.09 3.9 3.72 3.36 3.2 3.08 3.02 2.99
Pakistan NA NA 2.59 2.56 2.58 2.64 2.66 2.65 2.62 2.56
Sri-Lanka NA NA 0.56 0.59 0.3 0.96 0.79 0.77 1.03 0.87
Improved sanitation facilities, urban (% of urban population with access)
Country 2001 2002 2003 2004 2005 2006 2007 2008 2009 2010
Afghanistan NA 35.8 37 38.2 39.5 40.7 41.9 43.1 44.3 45.6
Bangladesh NA 54.9 55 55 55.1 55.1 55.2 55.2 55.3 55.3
Bhutan NA 67.3 68.1 68.9 69.7 70.6 71.4 72.2 73 73.9
India NA 55.9 56.4 56.8 57.3 57.8 58.3 58.8 59.3 59.7
ISSN: 2319-8753
I
nternational
J
ournal of
I
nnovative
R
esearch in
S
cience,
E
ngineering and
T
echnology
(An ISO 3297: 2007 Certified Organization)
Vol. 2, Issue 12, December 2013
Copyright to IJIRSET www.ijirset.com
7815
Source: World Bank, Report 2010
Source: World Bank, Report 2010
Per Capita CO2 Emission
Maldives NA 97.6 97.6 97.6 97.6 97.6 97.5 97.5 97.5 97.5
Nepal NA 44.9 45.5 46.2 46.8 47.5 48.1 48.8 49.4 50.1
Pakistan NA 71.9 71.9 71.9 71.9 71.9 71.9 71.9 71.8 71.8
Sri-Lanka NA 80.9 81.1 81.4 81.6 81.8 82 82.2 82.5 82.7
Net Forest Depletion (%of GNP)
Country 2001 2002 2003 2004 2005 2006 2007 2008 2009 2010
Afghanistan 3.13 2.12 1.38 1.25 2.02 5.43 3.56 4.77 2.53 2.08
Bangladesh 0.74 0.70 0.67 0.66 0.64 0.64 0.69 0.60 0.54 0.46
Bhutan 4.07 4.03 3.68 3.48 3.17 3.24 5.56 4.60 4.68 3.48
India 0.76 0.86 0.71 0.63 0.57 0.60 0.85 0.78 0.88 0.57
Iran® 2.90 2.94 3.78 3.76 3.71 3.31 3.22 3.39 3.86 3.49
Maldives® 0.22 0.30 0.22 0.20 0.21 0.18 0.20 0.17 0.18 0.18
Nepal 2.75 3.23 2.90 2.44 2.26 2.51 4.42 3.20 4.07 2.54
Pakistan 0.71 0.81 0.65 0.46 0.44 0.48 0.94 0.73 0.97 0.68
Sri-Lanka 0.44 0.48 0.40 0.34 0.30 0.34 0.61 0.39 0.49 0.32
Coun try
2001 2002 2003 2004 2005 2006 2007 2008 2009 2010
Afghan istan
781 645 359 583 733 997 1272 1889 3777 6315
Bangla desh
27866 32449 33700 33890 39794 37623 48170 48481 46443 51037
Bhutan 400 389 418 378 308 396 392 392 422 422
India 1186663 1203843 1226791 1281914 1348525 1411128 1504365 1611404 1802158 1979425
Iran 372703 398827 402178 418859 447480 486714 505265 539364 580174 602055
Mal dives
499 576 689 598 752 678 869 898 972 1027
Nepal 3234 3454 2710 2952 2769 3242 2662 2699 3047 3517
Paki stan
106449 108283 114084 118895 131620 136636 145855 159386 159199 161220
Sri- Lanka
ISSN: 2319-8753
I
nternational
J
ournal of
I
nnovative
R
esearch in
S
cience,
E
ngineering and
T
echnology
(An ISO 3297: 2007 Certified Organization)
Vol. 2, Issue 12, December 2013
Copyright to IJIRSET www.ijirset.com
7816
Source: World Bank, Report 2010
BIOGRAPHY
Mr. Adinath D. Gade
Assistant Professor, D.R.Mane Mahavidyalaya, Kagal, Qualification: M.A. (Geography), SET, B.Ed.
Specialization : Agriculture Geography, Urban Geography.
Dr. V.P.Katti
Asst. Professor Dept. Of Economics
Shivaji University Kolhapur
Qualification
: M.A, M.Phil,Ph.D
Specialisation
: Money, Banking and Finance
Mr. Ranjit.A.Todkar
Research Student, Department of Economics, Shivaji University Kolhapur
Qualification: M.A.(Economics)