The Response to Artificial Selection from New Mutations in
Drosophila melanogaster
Armando Caballero,' Miguel A. Toro' and Carlos Lopez-Fanjul
Departamento de Genitica, Facultad de Ciencias Biolbgicas, Universidad Complutense, 28040 Madrid, Spain.
Manuscript received July 17, 1990 Accepted December 17, 1990
ABSTRACT
Twenty generations of divergent selection for abdominal bristle number were carried out starting from a completely homozygous population of Drosophila melanogaster. All lines were selected with the same proportion (20%) but at two different numbers of selected parents of each sex ( 5 or 25). A significant response to selection was detected in eight lines (out of 40) and, in most cases, it could be wholly attributed to a single mutation of relatively large effect (0.5-2 phenotypic standard deviations). The ratio of new mutational variance to environmental variance was estimated to be (0.33 k 0.1 1) X
The distribution of mutant effects was asymmetrical, both with respect to bristle number (85% of it was negative) and to fitness (most detected bristle mutations were lethal or semilethal). Moreover, this distribution was leptokurtic, due to the presence of major genes. Gene action on bristles ranged from additive to completely recessive, no epistatic interactions being found. In agreement with theory, larger responses in each direction were achieved by those lines selected at greater effective population sizes. Furthermore, the observed divergence between lines selected in opposite directions was propor- tional to their effective size, as predicted for mutations of large effect.
I
N classical quantitative genetics theory, mutation was viewed as the primary source of variation on which natural selection could act on an evolutionary time scale, but was considered negligible for selection experiments. However, in the last decade, considera- ble effort has been devoted to expanding the theory by investigating the joint action of mutation, selection and drift on polygenic variation and selection re- sponse. Different models have been explored and, in each case, formulas obtained for the genetic variance maintained at equilibrium. These formulas are func- tions of the intensity of each of the three forces acting:1) the effective population size ( N ) , 2) the mutational input of genetic variance per zygote and generation (gm2) and 3) the bivariate distribution of mutant effects on the trait and on reproductive fitness.
In the absence of selection, LYNCH and HILL (1 986) have shown that the amount of neutral genetic varia- tion that can be maintained by mutation-drift equilib- rium is likely to exceed that commonly observed for
most traits (MOUSSEAU and ROFF 1987; ROFF and
MOUSSEAU 1987), even in populations of moderate effective size ( N
>
500). This suggests that some selective force is acting to reduce variation (KEIGH-TLEY and HILL 1988; BURGER, WAGNER and STETTIN-
For directional (artificial) selection, theoretical anal-
C E R 1989).
' Present address: Institute of Cell, Animal and Population Biology, Uni-
' Present address: Departamento de Producci6n Animal, INIA, Apartado versity of Edinburgh, West Mains Road, Edinburgh EH9 3JT, Scotland.
8 1 I I , 28080 Madrid, Spain. Genetics 127: 89-102 (May, 1991)
yses by HILL and co-workers [see HILL and RASBASH (1 986) and HILL and KEIGHTLEY (1 988) for reviews] indicate that the longer the time horizon considered the more important will be the role of mutation in determining the response obtained. This response is dependent on the effective population size and the shape of the joint distribution of mutant effects. Pre- dictions generally refer to neutral traits and a com- pletely homozygous base population. In this situation, the expected cumulative response to artificial diver- gent selection will be proportional to N for genes of large effect and a slower increasing function of N under the infinitesimal model (HILL 1982b). How- ever, a skewed distribution of mutant effects critically affects the response obtained in each direction (KEIGHTLEY and HILL 1987). T h e variance of the response t o selection will also be dependent on N . It will be directly proportional to the response under the infinitesimal model and higher than that for genes of large effect (HILL and RASBASH 1986).
90 A. Caballero, M. A. Tor0 and C. L6pez-Fanjul
usually estimated to be between 50 and 70% of the census (CROW 1954).
Estimates of spontaneous mutational heritabilities
(a,' scaled by the environmental variance) ranging from 5 X lo-' to have been obtained for several traits in experimental animals and cereal crops [see LYNCH (1 988) for a review]. For induced mutations, there is some evidence (mostly restricted to bristle traits in Drosophila) that X-rays [see MACKAY (1 989) for a review], y-rays and chemicals (EMS) (DEMPFLE and GRUNDL 1988) slightly increase the genetic vari- ation available to selection, but this increment is usu- ally associated with strong detrimental effects on fit- ness. Transposable element-induced mutations, again producing deleterious effects, can increase the genetic variance of bristle traits by two orders of magnitude more than that obtained from spontaneous mutations (LAI and MACKAY 1990).
Very little is known about the distribution of mutant effects on quantitative traits. It may show considerable asymmetry, as observed for abdominal and sterno-
pleural bristle number (LAI and MACKAY 1990).
Moreover, mutations of large effect will result in considerable leptokurtosis, as repeatedly reported for bristle traits (SHRIMPTON and ROBERTSON 1988a,b); and they generally lower the fitness of their carriers, as found in many long-term selection experiments (Yo0 1980).
This paper reports a Drosophila selection experi- ment started from a genetically homogeneous base population. T h e data provide information on the mu- tational heritability of the selected trait (abdominal bristle number) and the shape of the joint distribution of mutant effects on the trait and fitness. In addition, theoretical predictions of response to selection from new mutants and its variation have been checked.
MATERIALS AND METHODS
The isogenic base population: A line was made isogenic for all four chromosomes employing the crossing scheme illustrated in Figure 1. The following balancer chromosomes were used: FM6 (chromosome X , carrying the dominant marker Bar), SM5 (chromosome ZZ, carrying the lethal dom- inant marker Cy: curly wings), and TM3 (chromosome ZZZ, carrying the lethal dominant markers S6: stubble bristles and Ser: serrate wings). In addition, the FM6 stock carried the lethal dominant marker apterous-Xasta (up") associated with a translocation between chromosomes ZZ and ZZZ. Cross- ing over is virtually absent in the very small chromosome ZV (HOCHMAN 1976). T o make it isogenic, a stock was used carrying the lethal dominant markers ciD (cubitus interrup- tus-Dominant) and M ( 4 ) (Medium minute). In the presence
of all balancer chromosomes (FM6, SM5 and TM3), recom- bination events at chromosomes X and ZZZ have been occa- sionally observed. Notwithstanding, they can be detected in our case and its carriers discarded (generations 3 and 4) by recourse to the recessive markers present in the balancer chromosomes. The isogenic line also carried the recessive eye-color marker sepia (se) in chromosome ZZZ, as an indi- cator of possible contaminations.
Six different isogenic lines were obtained and tested for homozygosity by submitting them to three generations of divergent selection for abdominal bristle score (3-generation average divergence -0.01 f 0.09 bristles). One of these lines, showing a response to divergent selection in the direc- tion opposite to expectation, was chosen to be the base population of this experiment (3-generation average diver- gence -0.17 f 0.04 bristles).
The selected lines: Starting from the isogenic line, 20 generations of divergent mass selection were carried out on bristle number on the 4th and 5th sternites of males and the 5th and 6th sternites of females. There were two groups of lines: small (S) and large (L), maintained with five or 25 pairs of parents per generation, respectively. In the first group, there were 16 replicates selected upward (lines S+, denoted I + to 16+) and 16 selected downward (lines S-, denoted 1- to 16-). These replicates were selected with proportion 5/25 of each sex every generation, the five selected pairs being allowed to mate and lay eggs in a vial for 4 days. In the second group, there were four replicates selected upward (lines L+, denoted A+ to D+) and four selected downward (lines L-, denoted A- to D-), with proportion 251125 of each sex every generation. The 25 pairs selected were randomly divided in five groups of equal size, each group placed in a different vial and treated as above. Each of these vials contributed 25 offspring of each sex to the scored population. Therefore, selection was car- ried out with the same proportion (20%) in all lines, but at two different population sizes, that of the L lines being five times greater.
Control line: A control line was maintained in eight bottles employing a circular mating scheme to ensure a sufficiently large population (about 800 parents per gener- ation). T h e performance of the control line was evaluated on 100 individuals scored per sex and generation, starting with generation 11. T o produce control flies which had developed under exactly the same conditions as the selected flies, standard vial cultures were set up with five males and five virgin females as parents, using only parents which were also produced in standard vial cultures. Thus, two successive generations of vial culture were required for each genera- tion in which controls were measured. This procedure in- sured a uniform culture density in the control and selected lines. Moreover, control and selected lines were kept strictly contemporary and under the same environmental condi- tions.
Culture conditions: Flies were reared on the standard medium formula of this laboratory (brewer's yeast-agar- sucrose). All cultures were incubated at 25" f 1 under continuous lighting. The control line was kept in 250-ml bottles with 50 ml medium added, but vials (35 mm diame- ter, 105 mm height) with 20 ml medium were used for evaluation. All selected lines were maintained in these vials. T h e generation interval was 3 weeks, both in the control and the selected lines.
Crosses between selected lines: All possible crosses be- tween pairs of lines previously showing a significant response to selection in the same direction were made after the response plateaued (generations 15- 18). Selection on these crosses was subsequently continued for a further 6- 15 gen- eration period. Each parental line contributed three individ- uals of each sex selected out of 15 as parents. Selection was continued from the offspring of the two reciprocal crosses with proportion 5/25 of each sex.
X a
F W 6 a p I V x 1 1 1 1 1 C L
. D D
x X I 1 x 1 c i X S M S T H 3 I V x
- -
-
-
I-
-Y I 1 I 1 1 I V 0 " " " X"""-
-
-
""_
X I 1 I f t I V Y I 1 I 1 1 M ( 4 ) X I 1 1 1 1 M C 4 )
x a D
e e p i a F M 6 a p m a 1 e a
C \
x
_
"
"
x 1 1 1 1 1 I V
-
" " "X S M 5 T M S M ( 4 ) e e p L a
X
Y I 1 1 1 1 I V f e m a 1 e a
3
4
m a n y f e m a L e e x a
C l
x I 1 1 1 1 I V F M d a p
-
"--=e-
DX
c-
r
1
"
F M 6 S M 5 " "
x . 1 1
D
. - T M 3 e e
-
c iI 1 1 I V 0 X
I
F M 6 S W 5 T W S I V
" "
-
x . X I o I 1 1
0 I V 0
e o
-
Xd
X ,
o r Y I I ~
FJCURE 1 .-Crossing scheme used to obtain the isogenic line.
7-10 generations. In parallel, selection was relaxed, begin- ning at generation 16-25 and these lines were maintained thereafter with as many parents as possible. Their perform- ance was evaluated at intervals during a subsequent period of 12-20 generations of relaxation. T o do this, a random sample of five males and five virgin females was taken from each relaxed line and mated together in a vial, the trait being scored in 50 offspring of each sex. T h e same culture density was, therefore, achieved in all forward selected, reverse selected and relaxed lines, and the control line.
Lethal analysis: Chromosomes II and III of all lines showing a significant response to selection, together with those of the control line, were screened for lethals using the SM5(Cy)-TMS(Ser) stock. At generation 20, the five ex-
treme males in the direction of selection out of 25 (S lines)
or 125 (L lines) were used, and a random sample of 4-5 second and 4-5 third chromosomes for each male was tested for lethality. T h e probability of a lethal carried by only one male not being detected was thus 1/16-1/32. Lethal chro- mosomes were isolated and their allelic relationships tested by half-diallel crosses within males, between males within lines and across lines. A minimum of 20 offspring per cross was examined.
I I I e I V
"
X . SA45 T M 3 I V
"
"_
" 8 8 IY o I I o 1 1 1 . I V
It1 each line carrying a lethal, 130 males were both scored
for bristles and classified as homozygous nonlethal or het- erozygous for the lethal. T h e difference between the mean bristle number in the two groups estimates the effect of the lethal on the selected trait in the heterozygote.
Semilethal analysis: The viability of a third chromosome semilethal homozygote (s/s) relative to that of the heterozy- gote (s/+), was estimated by the method described by WAL- LACE ( I 956) as 2( 1
-
r ) / r , r being the proportion of individ- uals carrying the marker among the progeny of a cross between parents heterozygous for both the semilethal and the balancer TM3 (TM3/s).T h e effect of the semilethal on bristle number was esti- mated as follows. In each of three crosses (TM3/5 X TM3/
s, TM3/s X
+/+
and TM3/+ X+/+)
the difference ( A , B and C, respectively) in bristle score between the progeny carrying and not carrying the marker was calculated. T h e effects of s/+ and s/s relative to+/+
are given by C-
B and 2C - A-
B , respectively. This procedure assumes independence of the effects of s and TM3 in the heterozy- gote.92 A. Caballero, M. A. Tor0 and C. L6pez-Fanjul
35
1
361
33
-
X
2 9 h l , , , , ,
0 2 4 6 8 10 12 14 16 18 20 t
-0- L+ - - - o-" L-
S-
s+
- - -. . . - s --..--- contro I
FIGURE 2.-Average bristle score plotted against generation number f o r each type of selected lines and the control line.
mosomal substitutions on bristle score were undertaken
using the technique of OSMAN and ROBERTSON (1 968). At generation 13, males from a stock with a dominant marker on each autosome (Cy, Sb, 2 ) were crossed to females of the 1 1 - and the control (C) lines. In each cross, male
offspring carrying all three markers were crossed again to females from each of the two lines, and the bristle score recorded on 10 males and 10 females of each of the eight different genotypes in the progenies of the second crosses
Gonadal sterility tests: The P factor activity and the
cytotype regulating activity of lines, were determined by the percent gonadal sterility at 29" of the female offspring of its crosses to Canton4 females or Harwich males, respec- tively, following the procedure outlined by KIDWELL (1 986).
(11- x 1 1 - , 1 1 - x
c, c
x 11-, C x C).RESULTS
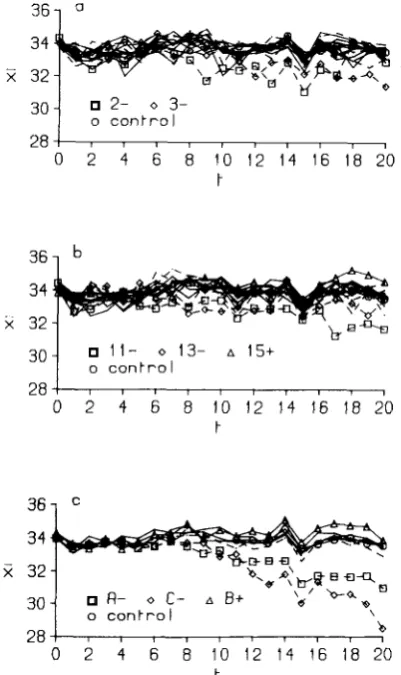
The individual replicates: No significant diver- gence was detected between the overall means of the upward and downward selected lines during the first five generations of selection (0.02 f 0.04). This result confirms the homozygosity of the original stock. How- ever, in the course of 20 generations of selection clear differences emerged between controls and the means of selected lines (Figure 2). The control line was scored only during the second half of the experiment (generations 11-20). T h e regression coefficient of the control mean on generation number was -0.03 & 0.04, not significantly different from zero. However, significant upward and downward trends were appar- ent and should be attributed to environmental fluc- tuations, as they were paralleled by similar changes in the selected lines in both directions of selection (Fig- ure 2). T o evaluate the difference between each se- lected line and the control line, the average diver- gence from generations 11 to 20 was tested for signif- icance. Empirical standard errors were computed from the divergences calculated in each generation. As there were 40 lines (Figure 3), a type I error of 0.01 was deemed necessary. Six lines selected down-
34
X
3230 -
I 28
2- o 3-
o control
0 2 4 6 8 10 12 1 4 16 18 20 t
3 6 1
34
x 32
30. 1 1 - o 13- A 15+
o control
2 8 - t m r 8 r 8 r n 1 1
0 2 4 6 8 10 12 1 4 16 18 20
t
361
34
X 32
3 0 - 6" o C - A B+ \6' b-+. 'B
o control \
2 8 - 8 1 7 1 , 1 7 1 8 '0 1
0 2 4 6 8 10 12 1 4 16 18 20
t
FIGURE J . " M e a n bristle score plotted against generation num-
ber: a) lines 1-8 (+ and -), b) lines 9- 16 (+ and -), c) lines A-D (+ and -).
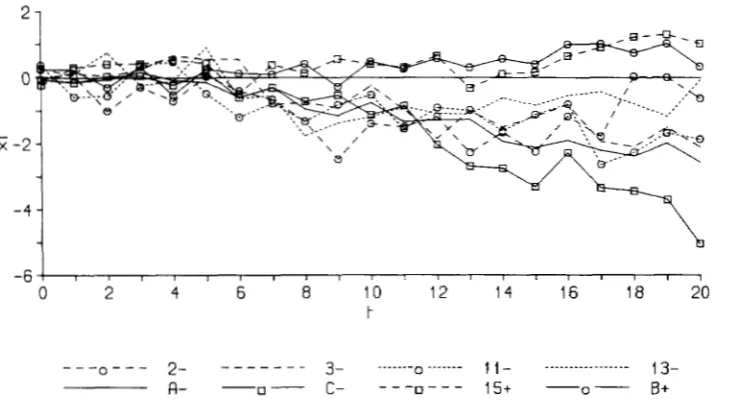
ward (2-, 3-, 1 1 -, 13-, A- and C-) and two selected upward (1 5+ and B+) departed significantly from the control. T h e evolution of these lines is shown in Figure 4, where the mean of the 32 lines showing no response was taken as a control from generation 0 to
10. Near the end of the 20-generation period, three of the responding downward selected lines
(2-,
13-and C - ) fluctuated in the direction of the control line, but in later generations all three lines returned to their earlier selected levels, as will be shown below. Apparently, most lines diverged from the control between generations 5 and 8. This statement, how- ever, needs some qualification as considerable oscilla- tions of the means of the lines, probably due to uni-
dentified environmental agents, were common
2
0
- x -2
-4
-6
0 2 4 6 8 10 12 14 16 18 20
t
FIGURE 4,"Deviation of mean bristle score from control (genela- tions 11-20) or from average of lines with no detected response (genera- tions 0-1 0), plotted against genera- tion nutnber for the lines slwwing a significant response to selection.
rapidly reaching its maximum possible frequency. A more gradual response was observed in the L lines, possibly due to the initial frequency of mutations being one-fifth of that in the S lines. Only in line 11- was there a clear pattern of a second major mutation occurring within the same line, in generations 17 to
18.
A permanent increase of the phenotypic variance associated with the response observed was apparent in three lines (2-, A - and C - ) . This is an indication of the presence of mutations that cannot be fixed by selection, i.e. lethals with a pleiotropic effect on bris- tles. The phenotypic variance of line 13- also in- creased when the corresponding response appeared, fluctuating strongly afterward. That of line 11- in- creased as well during its first period of response, but afterward the variance returned to its previous level. This observation suggests that the mutation respon- sible for that response was fixed by selection.
All flies scored were sepia homozygotes, indicating that no genetic contamination from external sources occurred in any of the lines.
Overall behavior of the selected lines: Statistics summarizing this part of the experiment are presented in Table 1. Selection intensities were estimated per line and generation as the applied selection differen- tial in phenotypic standard deviation units. T h e av- erage values for each group of replicates were very close to their expected values (BECKER, 1967). T h e average response of a group of lines is given as devia- tion from the control over the last three generations
of selection, and it was only significant in the down- ward direction, both for the S- and L- lines. There- fore, the response was markedly asymmetric, pointing to a parallel asymmetry of the distribution of mutant effects. Moreover, only two lines responded to upward selection during the period considered, as compared to six in the downward direction. T h e expected di-
vergence between lines of the same effective size selected in opposite directions was calculated assuming that all mutations have large effects normally distrib- uted around zero, and a mutational heritability of
as estimated from previous experiments (HILL 1982b; LYNCH 1988).
The evolution of the variances of the means of the replicates is shown in Figure 5 for each group of lines. N o appreciable changes were noticed in the upward lines, as only one of each type showed a significant response to selection. However, the variance of the means of the downward selected replicates clearly increased with time, gradually in the S- lines and speedily in the L- lines. This pattern is expected when most mutations have large effects but not under the infinitesimal model, where the variance of the re- sponse should be strictly proportional to that response (HILL 1985; HILL and RASBASH 1986). The variance of the means of the 32 lines in which no response was detected did not significantly increase during the whole experiment (regression coefficient of that vari- ance on generation number -0.002 & 0.003). There- fore, no indication of genetic differentiation among these lines has been found. This suggests that minor mutations have not yet made a significant contribution to the response to selection.
T h e average phenotypic variance (Table 1) was very similar in the four groups of selected lines and clearly exceeded the corresponding value in the control (av- erage value over generations 11-20: 3.86). This is likewise expected as a much larger number of gener- ations will be needed in the control to attain the equilibrium variance, although its magnitude will eventually be much higher in the control than i n the selected lines.
94 A . Caballero, M. A. Tor0 and C. Lbpez-Fanjul
TABLE 1
Response to selection and associated parameters for each type of line
Type of line
s
+
s- L+ L -lntensity of selection
Expected 1.34 1.34 1.39 1.39
Observed" 1.32 1.32 1.36 1.34
Response to selectionb 0.08 f 0.14 -0.31 f 0.11* 0.21 +- 0.16 -1.72 k 0.20*
Expected' 1.37 6.86
Observedb 0.39 f 0.18* 1.93 f 0.26*
Phenotypic varianced 4.20 f 0.29 4.44 f 0.28 4.48 k 0.08 4.87 f 0.21 Between-line varianced 0.22 f 0.11 0.64 f 0.03 0.13 +- 0.04 3.55 f 0.74 Divergence
" Average over 20 generations of selection.
'
Deviations from control averaged over generations 18-20." Average over generations 18-20,
* P < 0.05
Expectations for mutants of large effects: 2tNi &/a (see text for values used).
4
1
P
I
I
I
P ,
P
/'
o d
n
- 0 2 4 6 8 10 12 14 1'6 1 8 20
t
FIGURE 5.-Between line variance plotted against generation number for each type of selected lines.
cally distributed around zero. Neutrality has also been assumed although the action of natural selection will lead to underestimates of the mutational variance.
For a trait with phenotypic variance u2, the expected cumulative response Rc after t generations of selection with intensity
i
in an initially isogenic line of effective size N is given by(HILL 1982b) under the infinitesimal model or, for genes of large effect (greater than a / Ni ; HILL 1982b), which are fixed instantaneously, by
Rc = 2tNium2/a.
Using these equations, expectations under both hy- potheses have been calculated for each line. T h e fol- lowing parameter values have been used: effective size equal to 60% of the number of parents per generation, phenotypic variance equal to the average of the con- trol line, observed average selection intensity, and cumulative response estimated by the average devia-
TABLE 2
Mutational heritabilities (XlO-') calculated under the infinitesimal model or for mutants of large effect in each type
of line
Mutant effects
Type of line SllYdll Large
S+ 0.32
*
0.32 0.17 f 0.16S- 1.08 f 0.61* 0.53 f 0.30 Average 0.70 f 0.34* 0.35 f 0.17*
L+ 0.49 f 0.38 0.07 f 0.05
L- 3.84 -+ 2.07 0.55 f 0.30 Average 2.16 f 1.05* 0.31 f 0.15* Overall average 1.43 f 0.55* 0.33 f 0.1 1*
* P < 0.05 (one-tailed t test, standard errors of averages SE (1
+
2) based on the standard errors of original estimates by the formula
SE ( 1
+
2) = 1 /2 ((SE (1)'+
SE (2y)"').tion from the control over the last three generations of selection.
Mutational heritabilities obtained under both hy- potheses, together with their corresponding empirical standard errors, are given in Table
2
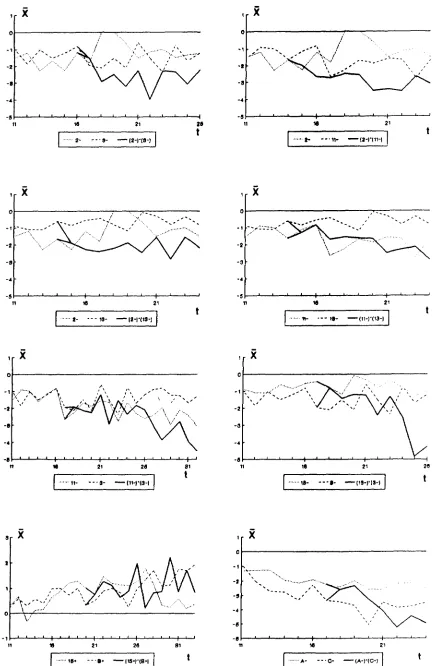
for all groups of lines. All averages were significantly different from zero. Estimates from the downward selected lines were higher, reflecting the negative asymmetry of the re- sponse to selection. In this respect, more reliable estimates can be obtained by averaging over both directions of selection.FIGURE 6.-Deviation o f mean bristle score from control plotted against generation number for pairs o f lines responding to selection and
96 A. Caballero, M. A. Tor0 and C. L6pez-Fanjul
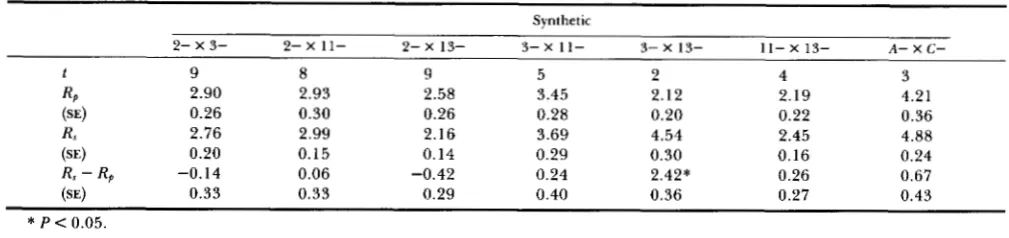
TABLE 3
Final response to downward selection (averaged over t generations after response ceased) attained by synthetics formed by crossing pairs of selected lines (R,), compared to the sum of the responses (averaged from generation 11 up to that in which the cross was made)
attained by the corresponding parental lines ( R p ) (all R’s in deviations from control)
Synthetic
2- x 3- 2- x 11- 2- X 13- 3- x 11- 3- X 13- 11- X 13- A- X C -
t 9 8 9 5 2 4 3
RP 2.90 2.93 2.58 3.45 2.12 2.19 4.21
(SEI 0.26 0.30 0.26 0.28 0.20 0.22 0.36
R, 2.76 2.99 2.16 3.69 4.54 2.45 4.88
(SE) 0.20 0.15 0.14 0.29 0.30 0.16 0.24
Rs - Rp -0.14 0.06 -0.42 0.24 2.42* 0.26 0.67
(SE) 0.33 0.33 0.29 0.40 0.36 0.27 0.43
*
P < 0.05.TABLE 4
Average bristle number of offspring of reciprocal crosses between synthetics showing extreme responses to selection in
opposite directions (crosses made at generation t)
Cross (6 X 9) t 66 99 (15+ X B + ) X (2- X 3-) 24 28.83 f 0.44 36.13 f 0.48 (2- X 3-) X (15+ X B + ) 24 28.63 f 0.32 36.43 f 0.47 (15+ X B+) X (A- X C - ) 25 27.70 f 0.42 33.80 f 0.37 (A- X C-) X (15+ X B+) 25 27.63 & 0.35 33.73 f 0.39
parents per generation (800). However, effective sizes as low as 10% of the number of parents only modify this estimate at the fifth decimal point. T h e mutational heritability estimated from control data was much larger than those calculated from the response to selection. Nevertheless, it was not significantly differ- ent from zero, since it was based on the above men- tioned regression coefficient that was also nonsignifi- cant. This illustrates the difficulty of estimating the mutational heritability without selection.
Selection from crosses between lines: T h e evolu- tion of the mean of the eight selected synthetics formed by crossing pairs of lines which had previously shown a significant response to selection, together with that of the corresponding parental lines, is pre- sented in Figure 6. All synthetics selected downward clearly exceeded the level attained by both parental lines. Different mutations were, therefore, responsible for the response observed in each line. On the other hand, the cross between the two lines responding to upward selection did not surpass the parental level when selection was continued. Nothing can, however, be concluded from this negative result, since the mean of the three lines included in the comparison fluc- tuated considerably during the period considered, and one parental line (B+) continued responding after the
cross was made. Thus, it is difficult to accept the alternative hypothesis of the same mutation having been selected in both parental lines.
The deviations from the control of both the means of the downward selected synthetics (averaged over
generations after response ceased) and the sum of the means of the corresponding parental lines (averaged from generation 11 to that in which the crosses were made) are shown in Table 3. We estimated the cessa- tion of response by finding the earliest generation such that the regression coefficient of the mean devia- tion from the control on generation number did not differ significantly from zero. It should be pointed out that synthetics 3- X 13- and A- X C - showed a markedly reduced fertility and were lost at genera- tions 24 and 26, respectively. Therefore, their final responses had to be calculated from the means of the last 2-3 generations of selection. Synthetic 3- x 1 1- was formed in generation 17, after a second major mutation occurred within line 1 1
-
(see below). In this particular instance, the response of line 1 1- was cal- culated as the average deviation from control over generations 17-20. Only in one case (3- x 13-) was the mean of a synthetic significantly different from the sum of the means of its parents. On the whole, the results suggest little or no epistatic gene action between pairs of newly arisen mutations.At generation 24-25, reciprocal crosses were made between those synthetics showing the largest re- sponses in opposite directions (15+ x B + , 2- X 3- and A- X C - ) , the results being shown in Table 4.
No significant differences were found between the means of individuals of the same sex from reciprocal crosses. Thus, additive genes on the X chromosome do not appear to be involved in the observed responses to selection.
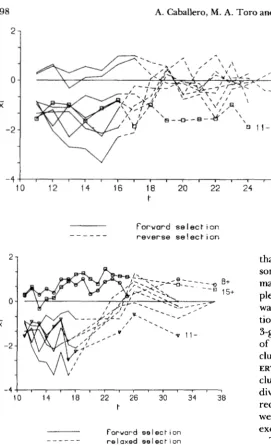
The effects of reverse and relaxed selection: Lines previously responding to selection (excepting line 1 1 -) subsequently responded to reverse selection, recovering their original (control) level in all cases (Figure 7). This indicates that the mutations respon- sible for the initial response have not reached fixation.
ure 8). However, the mean of the two lines responding to upward selection did not regress under relaxation. Apparently, mutations increasing the bristle score of their carriers were not closely connected to fitness.
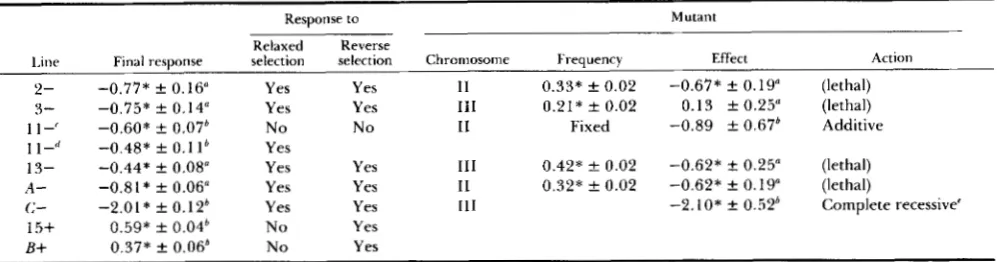
The analysis of the lethals: A different lethal was detected in each of lines
2-,
3-, 13- and A - . Their effect on bristles as well as their frequencies are listed in Table 5 , together with other relevant information. No lethals were detected in any of the remaining lines examined (1 1 -, C - , 15+, B+ and control).Lethals in lines 2-, 13- and A - had a similar significant pleiotropic effect on bristles of 0.6 pheno- typic standard deviations. Their frequencies were close to one-third, this being the expected value when artificial selection favors the heterozygous form of a recessive lethal. T h e expected response of each line can be calculated by assuming that it can be totally attributed to the corresponding lethal. This value can be compared to the actual mean deviation from the control. Observed and predicted responses were not significantly different for lines 2- and 13-, indicating that, in both cases, the response attained was due to a
single mutation. However, the response achieved by line A - can only be partially attributed to the lethal. Finally, the lethal found in line 3- had an appreciable frequency but no effect on bristles. In this situation, the hypothesis that the response observed can be attributed to a different gene closely linked to the lethal should be considered.
A semilethal (s) was detected on chromosome
ZZZ
of line C - , the viability of the homozygote relative to that of the heterozygote being 0.37. The effect of s in the homozygote was -4.12 f 1.02 bristles, not significantly different from the average difference in mean between line C- and the control (-3.94 f 0.24 bristles). Therefore, the presence of s explains the whole response observed. With respect to bristle score, the gene action appears to be completely reces- sive, the effect of s in the heterozygote not being significantly different from zero (-0.59 f 0.56 bris- tles).Line 11-: This line showed an early response to selection, followed by a long period of stability (aver- age deviation from control over generations 1 1-1 6: 1.17 f 0.14 bristles). This response was associated with a drastic jump of the phenotypic variance, occur- ring between generations 9 and 1 1, its value returning to the initial level afterward. A second response of comparable magnitude occurred at generation 17 (av- erage deviation from control over generations 17-20: 2.12 f 0.22 bristles). Therefore, there is an indication that two different mutations affecting bristles have appeared in this line.
No response to reverse selection starting at gener- ation 16 (before the second response appeared) was obtained, indicating that the mutation responsible for
the first response had already been fixed. T h e return to normal of the phenotypic variance also conformed with this view. However, relaxed selection starting at generation 18 (after the second response was com- pleted) resulted in a significant upward trend and the mean of the line regressed to the level attained before generation 17. Therefore, the second mutation has not been fixed and had a deleterious effect.
At generation 20, the relaxed line 11-, in which only the first mutation would be present (and fixed) was crossed to the control line. This cross was subse- quently relaxed during four generations and, at that moment, its divergence from the control (0.68 f 0.41 bristles) did not significantly differ from half of the first response shown by the line (0.58 A 0.07 bristles). This result indicates that the first mutation acts addi- tively for bristles and is practically neutral with respect to fitness.
Homozygous and heterozygous effects of individual chromosomes of line 11- have been calculated as de- viations from the control line. Only the homozygous effect of chromosome
ZZ
approached significance (-1.75 f 1.31 bristles) and its magnitude was similar to that of the response observed in the line. In parallel, the heterozygous effect of chromosomeZZ
was highest (-0.74 k 0.66 bristles) and comparable to half the response achieved. These results indicate that the mutant responsible should be located on chromosomeZZ.
They also provide further support in favor of an additive gene action for bristle score of the first mu- tation.Dysgenic potential of selected lines: Only those synthetics showing the largest response in both direc- tions of selection were tested, the results being shown in Table 6. Complete gonadal sterility was found in the female offspring of the cross between Harwich males and Canton-S females, confirming both the strong P factor activity of the Harwich strain and the M cytotype of the Canton-S strain. T h e small percent gonadal sterility in the progeny of crosses to Canton-
S females indicates a reduced capacity to induce trans- position, and that found in the progeny of crosses to Harwich males, points toward a variable cytotype- regulating activity. Therefore, our selected lines and, correspondingly, the isogenic base population, can be classified either as Q (weak P) or M' (pseudo"). In this situation, some intact P elements may be present at a small frequency and they may sporadically induce mutation by transposition.
98 A . Caballero, M. A. Toro and C. L6pez-Fanjul
\ v
"
/ - /1
Vi o
12 1 4 16 18 20 22 tf o r w a r d selection
r e v e r s e selection
"""
21
- 4
10 1 4 18 22 26 30 34 38
t
f o r w a r d selection
r e l a x e d selection """
FIGURE 8.-Response to relaxed selection as a deviation from control, in lines previously responding to forward selection.
sponse achieved over the next few generations. At generation 17, a second batch of 25 offspring of each sex was collected in lines
7,
8, 10 and 12 (+ and -).From these samples, selection was continued for five generations at 29" (generation 18) or 27" (genera- tions 19-22), with the same proportion (5/25 of each sex) and in the same direction as in the corresponding replicates at 25", which were scored simultaneously. No significant change of the mean was detected in these lines at any temperature.
DISCUSSION
A genetically homogeneous base population is nec- essary for unambiguously ascribing to new mutation the selection response observed in a line. It also sim- plifies the study of the genetic properties of the mu- tations arising in individual replicates. An isogenic line was considered to meet this requirement better
FIGURE 7,"Response to reverse selection as a devia- tion from control, in lines previously responding to for- ward selection.
24 26
than a highly inbred line, as the latter will always show some residual genetic variation. Two pieces of infor- mation confirmed that our isogenic line was com- pletely homozygous. First, no significant divergence was found between lines selected in opposite direc- tions during the first five generations, or in the earlier 3-generation testing period. Second, the large effect of the mutations detected in later generations pre- cluded their presence in the original population (ROB-
ERTSON 1978; SANTIAGO 1989). Our data also ex- cluded contamination during the experiment. All in- dividuals examined were homozygous for the sepia recessive marker, and all lines responding to selection were shown to carry different mutations, therefore excluding contamination between these lines.
T h e balancer chromosome stocks used have been classified as M strains for the P-M hybrid dysgenesis system. However, the type of the stock contributing the sepia marker is unknown. In this respect, the results of the gonadal sterility tests were inconclusive as they only allowed the selected lines assayed to be classified as pseudo" or weak P. In principle, it is possible that the base population presented some level of P factor activity and, consequently, the mutations detected in the experiment might be attributed to an increased mutation rate due to transposition during the formation of the isogenic line. Nevertheless, no dysgenic symptoms were observed in this period. In addition, no response to divergent selection was de- tected in the earlier generations. Furthermore, the estimates of the mutational heritability were similar to those previously reported for "type populations. Therefore, our results are compatible with sponta- neous mutation in M strains.
5
Summary of information on mutants found in selected lines
Response to Mutant
Line Final response selection selection Chromosome Frequency Effect Action Relaxed Reverse
2- 3-
1 I-' 1 1
-<'
13-A -
c-
15+
B+
-0.77* f 0.16" -0.75* f 0.14" -0.60* k 0.07b -0.48* f 0.1 I b
-0.44* f 0.08" -0.8 I * f 0.06" -2.01* f 0.12* 0.59* f 0.04' 0.37* f 0.06b
Yes Yes No Yes Yes Yes Yes N o No
Yes 11 0.33* f 0.02 -0.67* f 0.19" (lethal) Yes 111 0.21* f 0.02 0.13 f 0.25" (lethal)
No I1 Fixed -0.89 k 0.67b Additive
Yes 111 0.42* f 0.02 -0.62* k 0.25" (lethal) Yes I1 0.32* f 0.02 -0.62* f 0.19" (lethal)
Yes 111 -2. I O * f 0.52b Complete recessive' Yes
Yes
" Deviation from control in phenotypic standard deviation units (males).
" Deviation from control in phenotypic standard deviation units (both sexes). First mutation.
Second mutation.
,.
' Semilethal.
* P < 0.05.
TABLE 6
Percent gonadal sterility (GS) in n offspring from crosses between tester lines (Canton4 and Harwich) and selected synthetics showing extreme responses in opposite directions
X Canton-S fe- X Harwich
males males
Line n GS n GS
(H2ar;i;l) 43 100
36 17 38 5
( A - X C-) 43 7 41 11
(15+ X E + ) 57 3 49 22
Control 36 4 29 7
First, both the magnitude of the environmental vari- ance of the trait and the duration of selection set a lower limit on the resolution. Mutations with an effect smaller than 0.2 phenotypic standard deviations will be practically impossible to detect in any single line until some of them accumulate. In turn, this will require more than 20 generations of selection (HILL
1985; HILL and RASBASH 1986). This is in agreement with the stability of the variance of the means of the 32 lines not showing a significant response to selec- tion, observed throughout the experiment. Second, the fixation probability of an additive mutation with an effect of 0.2 phenotypic standard deviations will be small for both effective sizes considered. In prac- tice, this probability will be substantially lower when a major mutation is also segregating in the same line, as the selection pressure exerted on minor genes will thus be correspondingly diminished. In the third place, mutations with an appreciable heterozygous effect will have a higher chance of being picked up by selection. This agrees with the observation that the only recessive mutation detected in this experiment
also had the largest effect of any mutation.
A significant response to selection has been detected in six downward selected lines. In three cases, it could be totally attributed to a single lethal (lines
2-
and13-) or semilethal (line C-) mutation with a pleio- tropic effect on bristle score. Another lethal mutant was likewise shown to be responsible for most of the response achieved in line A-. A further lethal at high frequency was found in line 3- but it had no effect on bristles. Notwithstanding, a sudden response was observed in this line lasting only 1-2 generations. Thus, it is very likely that only one mutation with an effect on the trait was involved, originally linked to the lethal and later losing its association. Finally, the response observed in line 1 1- can be ascribed to two different mutations. The one appearing first, showing additive action for bristles, was quasineutral and reached fixation before the second (deleterious) mu-
tation occurred. Little can be said concerning the genetic changes experienced by the two lines signifi- cantly responding to upward selection, other than that they seem to be due to quasineutral mutations in both instances.
T h e joint distribution of mutant effects on the selected trait and fitness was markedly asymmetrical, since most mutations decreased both the number of bristles and the fitness of their carriers. T h e asym- metry can be quantified either by the proportion of mutations of negative effect among ail mutations found (7/9) or by the final downward response relative to the total divergence (85%) (KEIGHTLEY and HILL
1987). Of course, the two procedures will not give equivalent results in all cases. In principle, this asym- metry cannot be attributed to the specific genotype of
100 A . Caballero, M. A. Tor0 and C. L6pez-Fanjul
BALLERO and LOPEZ-FANJUL 1987; LOPEZ-FANJUL, GUERRA and GARCIA 1989).
In addition, the joint distribution is expected to be highly leptokurtic, since the effects of the observed mutations on bristles and fitness were large (KEIGH-
TLEY and HILL 1987). Lethals with a substantial pleio- tropic effect on abdominal bristles have often been detected in selected lines and, in some cases, they have been ascribed to specific loci such as scabrous (JONES,
FRANKHAM and BARKER 1968), bobbed (FRANKHAM,
BRISCOE and NURTHEN 1980), and scute (Yo0 1980). Major genes affecting quantitative traits have also been identified in other experimental and domestic animals, resulting in a leptokurtic distribution of gene effects (see PIPER and SHRIMPTON 1989 for a review). With respect to dominant gene action on bristle score, our data are restricted to only the two nonlethal mutations. These were the quasineutral mutation in line 1 1-, showing additive gene action, and the sem- ilethal in line C-, presenting complete recessivity. N o
evidence has been found of epistatic gene action be- tween the mutations decreasing bristle score. Unfor- tunately, nothing can be said about the gene action of the mutations responsible for the upward response.
A distinction should be made between the original distribution of mutant effects and the distribution for genes segregating in populations after natural selec- tion has acted. Abdominal bristle number does not appear to be causally related to fitness, i e . , it is a
“peripheral” trait (ROBERTSON 1955), but pleiotropic fitness effects of alleles affecting bristle number have been demonstrated. Our data show similar fitness effects. Therefore, the variation observed in natural populations, although operationally neutral (LATTER
and ROBERTSON 1962; LOPEZ-FANJUL, GUERRA and
GARCIA 1989), cannot be solely explained as the result of balancing drift and mutation forces, as selection is also playing a role. This observation casts doubts on the validity of comparing the heritabilities of the SO- called peripheral traits estimated in natural popula- tions with their predicted equilibrium value obtained from drift-mutations models.
Previous results from artificial selection experi- ments agree with our findings. Operationally, a dis- tinction should be made between the short- and the long-term response achieved in lines of a given effec- tive size. T h e first could be defined as that which is mainly dependent on the genetic variation already present in the base population, essentially additive and quasineutral since deleterious mutations will be screened by natural selection. T h e second will be increasingly influenced by new variation originating from mutation during the course of selection, a con- siderable proportion of the mutations showing pleio- tropic unfavorable effects on fitness. T h e duration of the two periods is closely related to the distribution
of mutant effects on the selected trait: the larger these effects the sooner mutations will appreciably affect the response. In earlier generations, the decline in fitness experienced by the selected lines will not be large and it will be due to inbreeding rather than to selection itself. This has been usually confirmed by the small fraction of the response achieved that be- comes lost after a subsequent period of relaxation
(CLAYTON and ROBERTSON 1957; LATTER and ROB-
ERTSON 1962; FRANKHAM, JONES and BARKER 1968). If selection is continued, deleterious mutations will be incorporated and plateaus will be reached, character- ized by the antagonism between natural and artificial selection forces. Experimentally, this has been often found. Thus, between one-quarter (LATTER and ROB-
ERTSON 1962; FRANKHAM, JONES and BARKER 1968)
and three-quarters (CLAYTON and ROBERTSON 1957;
YOO 1980) of the lines selected for abdominal bristle number in previous experiments carried at least one lethal at maximum frequency with a large effect on that trait. None of these lethals were found segregat- ing in the base population when attempts were made to find them, and in one case (YOO 1980) some of them were unambiguously shown to be new mutations that occurred during selection. In those experiments in which divergent selection was carried out (CLAYTON
and ROBERTSON 1957; LATTER and ROBERTSON
1962), the decline in reproductive capacity experi- enced in the long term was greater in the lines selected for low bristle number. This result agrees with the asymmetry of the joint distribution of mutant effects on bristles and fitness found in the present experi- ment.
Once the equilibrium variance has been reached, the response to artificial selection due to new mutation is expected to be a function of the selection intensity, the effective population size, and the mean square of the effects of mutants affecting the trait in the direc- tion of selection. Therefore, when lines are selected in the same direction and with the same proportion, the largest response will be achieved by those selected at the greatest effective size. In our situation this implies L+
>
S+>
S->
L - , in agreement with the pattern found from generation 10. With only muta- tion and drift (LYNCH and HILL 1986), the number of generations needed to reach 90% of the equilib- rium variance will be 27 and 140 for lines S and L , respectively. These periods are smaller with selection and for mutations of large effect. However, it is quite possible that L lines had not yet reached the equilib- rium variance by the end of the experiment.opposite directions. In our case, all mutations detected had a large effect and no indication of minor muta- tions contributing to the observed response was found. In agreement with theory (HILL 1982b), the divergence between the L+ and L- lines was five
times larger than that between the S+ and S- lines, the L lines having an effective size five times larger than the S lines. Nevertheless, the magnitude of the divergence was only 28% of that expected for both types of lines under the hypothesis of all genes having large effects. This prediction has been obtained under the assumptions of additive gene action within and between loci, linkage equilibrium and neutrality. It also depends on an a priori estimate of the mutational heritability of lo-’, usually suggested for Drosophila bristle traits (discussed below). Departures from ad- ditivity will not be important as long as the mutations involved have an effect on the heterozygote (HILL
1982a), the only exception to this being the semilethal mutation found in line C-. In general, the influence of linkage on the response will be small (KEIGHTLEY
and HILL 1983) and it certainly is so in our case, since the responses observed in most lines can each be reasonably attributed to a single mutation. T h e choice of values of i and N entering the prediction equation will not significantly affect the outcome. First, the expected and observed intensities of selection were very close to each other. Second, the experimental design ensures that the effective size of the L lines will be five times larger than that of the S lines, even if we cannot be certain of the latter. In conclusion, neutral- ity appears to be the only assumption violated by the data and this can seriously distort the predictions. When a selected line reaches a plateau determined by the antagonism between natural and artificial selec- tion, previous response to artificial selection will be much less than expected when natural selection is not acting (NICHOLAS and ROBERTSON 1980). In our ex- periment, all but one of the mutants decreasing bristle number had deleterious pleiotropic effects and most of them were lethals or semilethals. T h e maximum frequency in a selected line that can be attained by a single recessive lethal with an effect on the selected trait is one-third. Accordingly, the expected response should be reduced to an analogous fraction of that calculated for neutral additive genes yielding the same mutational variance per generation.
Different estimates of the mutational heritability of abdominal bristle score have been calculated by as- suming that all mutants involved had either small or
large effects. If major mutations occur, the first as- sumption will result in overestimates, particularly so in the L lines where the influence of drift on the response to selection will be less important. In fact, the estimate for the L lines obtained under the infin- itesimal model was significantly larger than that for
the S lines. In practice, all responses observed can be wholly attributed to major mutants. Consequently, the mutational heritability estimated under this hy- pothesis should be closer to the true value and, be- sides, independent of population size. In agreement with this, very similar estimates were obtained for the L and S lines ((0.31-0.35) X lo-’). Mutational herit- abilities have been calculated from the cumulative responses to selection and, consequently, their validity is subject to the same restrictions mentioned above when comparing expected and observed responses. Of those, the lack of neutrality appears to be the only important departure from the model’s assumptions. T h e antagonism between natural and artificial selec- tion will lead to underestimates of the mutational heritabilities and, in fact, those found in the present work were smaller than the average value (1 0-’) ob- tained in previous experiments (HILL 1982b; LYNCH
1988).
This work was supported by Comisi6n Interministerial d e Ciencia y Tecnologia, Spain (PA86-0007-C02-01). We thank
L. DEMPFLE, A. GALLEGO, A. GARCIA-DORADO, W. G. HILL and P. KEIGHTLEY for helpful comments, and M. TURELLI and K. E. WEBER for suggesting improvements to the final draft of the man- uscript.
LITERATURE CITED
BECKER, W. A., 1967 Manual ofprocedures in Quantitative Genetics.
Washington State University Press, Pullman.
BURGER, R., G. P. WAGNER and F. STETTINGER, 1989 How much heritable variation can be maintained in finite populations by mutation-selection balance. Evolution 43: 1748-1 766. CABALLERO, A., and C. LOPEZ-FANJUL, 1987 An experimental
evaluation of the usefulness of secondary traits in index selec- tion, using Drosophila melanogaster. J. Anim. Breed. Genet.
104: 175-179.
CLAYTON, G. A., and A. ROBERTSON, 1957 An experimental check on quantitative genetical theory. 11. T h e long-term ef- fects of selection. J. Genet. 55: 152-170.
CROW, J. F., 1954 Breeding strueture of populations. 11. Effective population number, pp. 543-556 in Statistics and Mathematics
in Biology, edited by 0. KEMPTHORNE, T. A. BANCROFT, J. W.
GOWEN and J. L. LUSH. Iowa State College Press, Ames. DEMPFLE, L., and E. GRUNDL, 1988 Identification of superior
animals and their use in improvement programmes, pp. 56-72
in Advances in Animal Breeding. Pudok, Wageningen.
FRANKHAM, R., D. A. BRISCOE and R. K. NURTHEN, 1980 Unequal crossing over at the rRNA tandon as a source of quantitative genetic variation in Drosophila. Genetics 9 5 727-742. FRANKHAM, R., L. P. JONES and J. S. F. BARKER, 1968 T h e effects
of population size and selection intensity in selection for a quantitative character in Drosophila. 111. Analyses of lines. Genet. Res. 12: 267-283.
HILL, W. G., 1982a Rates of change in quantitative traits from fixation of new mutations. Proc. Natl. Acad. Sci. USA 79: 142-
145.
HILL, W. G., 1982b Predictions of response to artificial selection from new mutations. Genet. Res. 4 0 255-278.
HILL, W. G., 1985 Effects of population size o n response to short and long term selection. J. Anim. Breed. Genet. 102: 161-173. HILL, W. G., and P. D. KEIGHTLEY, 1988 Interrelations of muta-
102 A . Caballero. M . A. Toro and C. L6pez-Fanjul
in Proceedings of the Second International Conference on Quanti-
tative Genetics, edited by E. J. EISEN, M. M. GOODMAN, G.
NAMKOONG AND B. S. WEIR. Sinauer, Sunderland, Mass. HILL, W. G., and J. RASBASH, 1986 Models of long-term artificial
selection in finite population with recurrent mutation. Genet. Res. 4 8 125-1 3 1.
HOCHMAN, B., 1976 The fourth chromosome of Drosophila mela-
nogaster, pp. 903-925 in The Genetics and Biology of Drosophila,
Vol. Ib, edited by M. ASHBURNER and E. NOVITSKI. Academic Press, London.
JONES, L.P., R. FRANKHAM and J. S. F. BARKER, 1968 The effects of population size and selection intensity in selection for a quantitative character in Drosophila. 11. Long-term response to selection. Genet. Res. 12: 249-266.
KEIGHTLEY, P. D., and W. G. HILL, 1983 Effects of linkage on response to directional selection from new mutations. Genet. Res. 42: 193-206.
KEIGHTLEY, P. D., and W. G. HILL, 1987 Directional selection and variation in finite populations. Genetics 117: 573-582. KEIGHTLEY, P. D., and W. G . HILL, 1988 Genetic variability
maintained by mutation-stabilizing selection balance in finite populations. Genet. Res. 52: 33-43.
KIDWELL, M. G., 1986 P-M mutagenesis, pp. 59-82 in Drosophila:
A Practical Approach, edited by D. B. ROBERTS. IRL Press,
Oxford.
LAI C., and T. F. C. MACKAY, 1990 Hybrid dysgenesis-induced quantitative variation on the X chromosome of Drosophila
melanogaster. Genetics 1 2 4 627-636.
LATTER, B. D. H., and A. ROBERTSON, 1962 The effects of inbreeding and artificial selection on reproductive fitness. Ge- net. Res. 3: 110-138.
LOPEZ-FANJUL, C., J. GUERRA and A. GARCIA, 1989 Changes in the distribution of the genetic variance of a quantitative trait in small populations of Drosophila melanogaster. Genet. Sel. Evol. 21: 159-1 68.
LOPEZ-FANJUL, C., and E. TORROJA, 1982 Presi6n ambiental y
reacci6n genktica en caracteres cuantitativos. Actas V Congreso Latinoamericano Genetica, pp. 272-279.
LYNCH, M., 1988 The rate of polygenic mutation. Genet. Res. 51: 137-148.
LYNCH, M., and W. G. HILL, 1986 Phenotypic evolution by neu- tral mutation. Evolution 4 0 915-935.
MACKAY, T. F. C., 1989 Mutation and the origin of quantitative variation, pp. 1 13-1 19 in Evolution and Animal Breeding, edited by W. G. HILL and T . F. C. MACKAY. CAB International, Wallingford.
MALPICA, J. M., and D. A. BRISCOE, 1981 Effective population number estimates of laboratory populations of Drosophila mel-
anogaster. Experientia 37: 947.
MOUSSEAU, T. A., and D. A. ROFF, 1987 Natural selection and the heritability of fitness components. Heredity 5 9 181-197. NICHOLAS, F. W . , and A. ROBERTSON, 1980 The conflict between
natural and artificial selection in finite populations. Theor. Appl. Genet. 56: 57-64.
OSMAN, H. E. S., and A. ROBERTSON, 1968 The introduction of genetic material from inferior into superior strains. Genet. Res. 12: 221-236.
PIPER, L. R., and A. E. SHRIMPTON, 1989 The quantitative effects of genes which influence metric traits, pp. 147-151 in Evolution
and Animal Breeding, edited by W. G. HILL and T. F. C.
MACKAY. CAB International, Wallingford.
ROBERTSON, A,, 1955 Selection in animals: synthesis. Cold Spring Harbor Symp. Quant. Biol. 20: 225-229.
ROBERTSON, A,, 1978 The time of detection of recessive visible genes in small populations. Genet. Res. 31: 255-264.
ROFF, D. A,, and T . A. MOUSSEAU, 1987 Quantitative genetics and fitness: lessons from Drosophila. Heredity 58: 103-1 18. SANTIAGO, E., 1989 Time of detection of recessive genes: effects
of system of mating and number of examined individuals. Theor. Appl. Genet. 77: 867-872.
SHRIMPTON, A. E., and A. ROBERTSON, 1988a The isolation of polygenic factors controlling bristle score in Drosophila mela-
nogaster. I. Allocation of third chromosome sternopleural bris-
tle effects to chromosome sections. Genetics 1 1 8 437-443. SHRIMPTON, A. E., and A. ROBERTSON, 1988b The isolation of
polygenic factors controlling bristle score in Drosophila mela-
nogaster. 11. Distribution of third chromosome bristle effects
within chromosome sections. Genetics 118: 445-459. WALLACE, B., 1956 Studies on irradiated populations of Drosoph-
ila melanogaster. Genetics 54: 280-293.
Yoo, B. H., 1980 Long-term selection for a quantitative character in large replicate populations of Drosophila melanogaster. 11.
Lethals and visible mutants with large effects. Genet. Res. 35: 19-31.